| Param | Original file | Final file |
|---|---|---|
| Filename | modeM0/AS1A07_047T08_9000003590_24291cztM0_level2.evt | modeM0/AS1A07_047T08_9000003590_24291cztM0_level2_quad_clean.evt |
| Size (bytes) | 568,048,320 | 131,935,680 |
| Size | 541.7 MB | 125.8 MB |
| Events in quadrant A | 3,135,331 | 910,046 |
| Events in quadrant B | 3,170,661 | 926,245 |
| Events in quadrant C | 4,812,457 | 871,799 |
| Events in quadrant D | 5,644,677 | 834,312 |
| Mode SS | |||
|---|---|---|---|
| Quadrant | BADHDUFLAG | Total packets | Discarded packets |
| A | 0 | 130 | 0 |
| B | 0 | 130 | 0 |
| C | 0 | 130 | 0 |
| D | 0 | 130 | 0 |
| Mode M9 | |||
|---|---|---|---|
| Quadrant | BADHDUFLAG | Total packets | Discarded packets |
| A | 0 | 9 | 0 |
| B | 0 | 9 | 0 |
| C | 0 | 9 | 0 |
| D | 0 | 9 | 0 |
| Mode M0 | |||
|---|---|---|---|
| Quadrant | BADHDUFLAG | Total packets | Discarded packets |
| A | 0 | 13271 | 0 |
| B | 0 | 13375 | 0 |
| C | 0 | 18846 | 0 |
| D | 0 | 21233 | 1 |
| Quadrant | Total seconds | Saturated seconds | Saturation percentage |
|---|---|---|---|
| A | 6503 | 74 | 1.137936% |
| B | 6504 | 83 | 1.276138% |
| C | 6504 | 229 | 3.520910% |
| D | 6503 | 465 | 7.150546% |
Noise dominated data is calculated using 1-second bins in cleaned event files. If a bin has >2000 counts, and if more than 50% of those come from <1% of pixels, then it is considered to be noise-dominated and hence unusable.
| Quadrant | # 1 sec bins | Bins with >0 counts | Bins with >2000 counts | High rate bins dominated by noise | Noise dominated (total time) | Noise dominated (detector-on time) | Marked lightcurve |
|---|---|---|---|---|---|---|---|
| A | 7403 | 6503 | 0 | 0 | 0.00% | 0.00% | 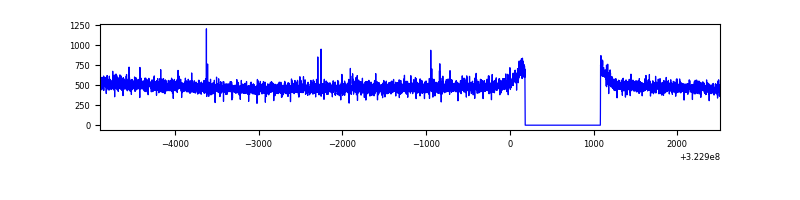 |
| B | 7404 | 6504 | 2 | 2 | 0.03% | 0.03% | 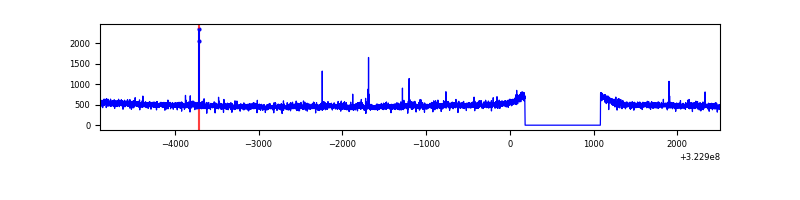 |
| C | 7403 | 6503 | 20 | 20 | 0.27% | 0.31% |  |
| D | 7403 | 6503 | 334 | 334 | 4.51% | 5.14% | 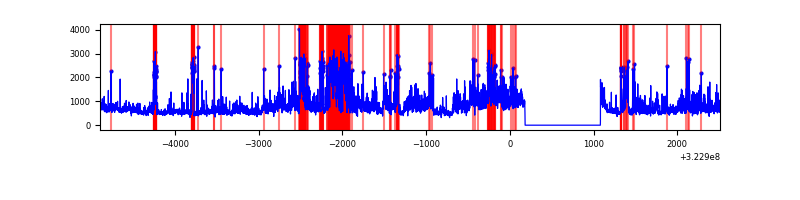 |
Top three noisy pixels from each quadrant. If the there are fewer than three noisy pixels in the level2.evt file, extra rows are filled as -1
| Pixel properties | Quadrant properties | ||||||
|---|---|---|---|---|---|---|---|
| Quadrant | DetID | PixID | Counts | Sigma | Mean | Median | Sigma |
| A | 13 | 254 | 9807 | 55.63 | 812 | 797 | 162.0 |
| A | 0 | 226 | 6975 | 38.14 | 812 | 797 | 162.0 |
| A | 3 | 137 | 6731 | 36.64 | 812 | 797 | 162.0 |
| B | 12 | 111 | 17590 | 112.3 | 805 | 787 | 149.6 |
| B | 11 | 111 | 15691 | 99.6 | 805 | 787 | 149.6 |
| B | 14 | 111 | 14112 | 89.05 | 805 | 787 | 149.6 |
| C | 7 | 247 | 1405159 | 7892.36 | 778 | 784 | 177.9 |
| C | 2 | 16 | 242609 | 1359.02 | 778 | 784 | 177.9 |
| C | 14 | 238 | 126128 | 704.41 | 778 | 784 | 177.9 |
| D | 1 | 52 | 1336465 | 7203.17 | 774 | 750 | 185.4 |
| D | 8 | 195 | 1178188 | 6349.62 | 774 | 750 | 185.4 |
| D | 12 | 233 | 200562 | 1077.53 | 774 | 750 | 185.4 |
Histogram calculated using DETX and DETY for each event in the final _common_clean file
| Quadrant A |  |
 |
Quadrant B |
|---|---|---|---|
| Quadrant D |  |
 |
Quadrant C |
| Plot type | Count rate plots | Images |
|---|---|---|
| Comparison with Poisson distribution Blue bars denote a histogram of data divided into 1 sec bins. Red curve is a Poisson curve with rate = median count rate of data. |
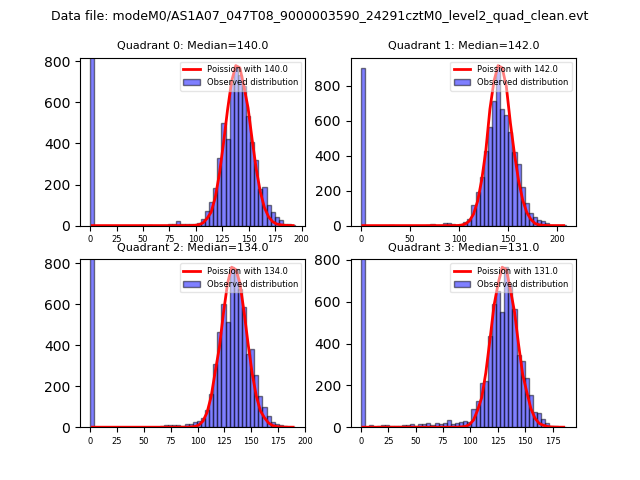 |
 |
| Quadrant-wise count rates Data is divided into 100 sec bins |
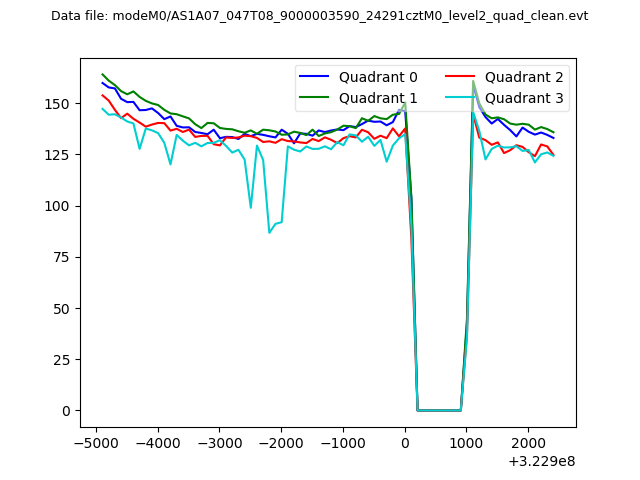 |
|
| Module-wise count rates for Quadrant A Data is divided into 100 sec bins |
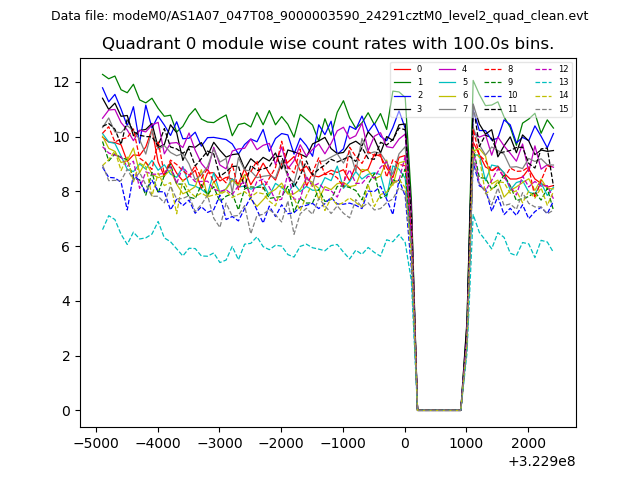 |
 |
| Module-wise count rates for Quadrant B Data is divided into 100 sec bins |
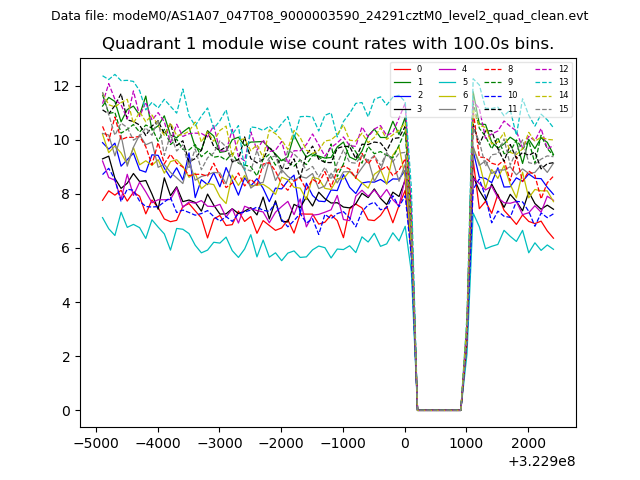 |
 |
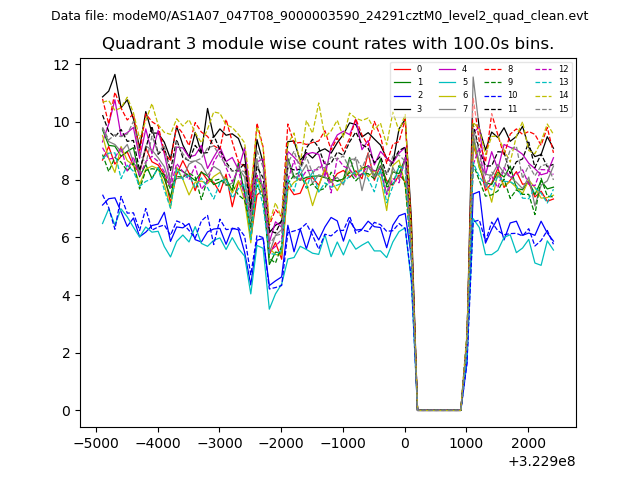
| Module-wise count rates for Quadrant C Data is divided into 100 sec bins |
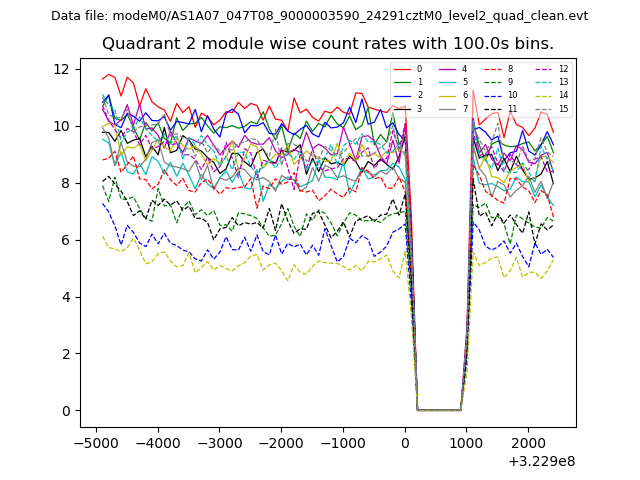 |
 |
| Module-wise count rates for Quadrant D Data is divided into 100 sec bins |
 |
 |
| Parameter | Plot |
|---|---|
| CZT HV Monitor | 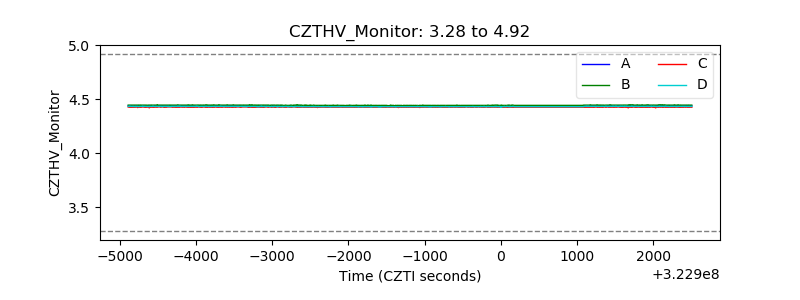 |
| D_VDD |  |
| Temperature 1 |  |
| Veto HV Monitor |  |
| Veto LLD |  |
| Alpha Counter | 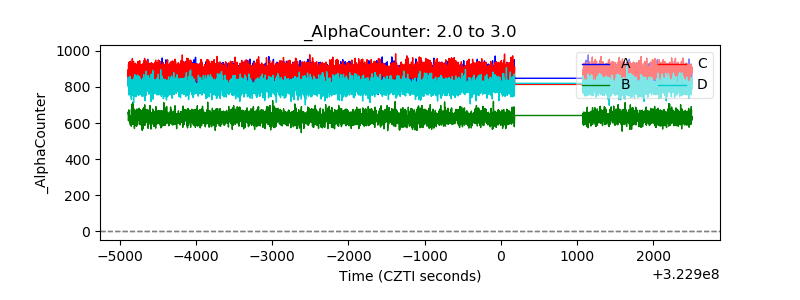 |
| _CPM_Rate | 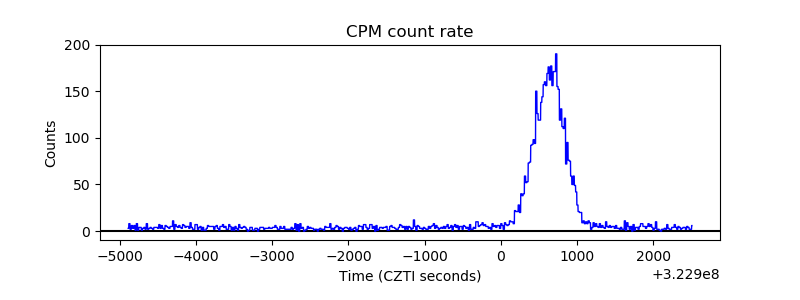 |
| CZT Counter |  |
| +2.5 Volts monitor |  |
| +5 Volts monitor |  |
| _ROLL_ROT |  |
| _Roll_DEC |  |
| _Roll_RA |  |
| Veto Counter | 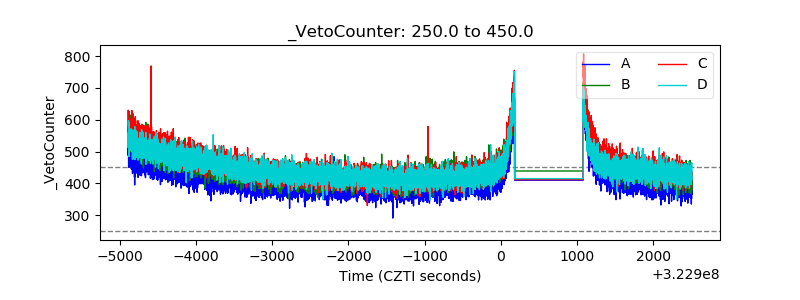 |