| Param | Original file | Final file |
|---|---|---|
| Filename | modeM0/AS1A07_047T08_9000003590_24292cztM0_level2.evt | modeM0/AS1A07_047T08_9000003590_24292cztM0_level2_quad_clean.evt |
| Size (bytes) | 312,177,600 | 69,238,080 |
| Size | 297.7 MB | 66.0 MB |
| Events in quadrant A | 1,619,094 | 471,111 |
| Events in quadrant B | 1,637,441 | 477,567 |
| Events in quadrant C | 2,671,312 | 453,608 |
| Events in quadrant D | 3,280,370 | 438,738 |
| Mode SS | |||
|---|---|---|---|
| Quadrant | BADHDUFLAG | Total packets | Discarded packets |
| A | 0 | 72 | 0 |
| B | 0 | 72 | 0 |
| C | 0 | 72 | 0 |
| D | 0 | 72 | 0 |
| Mode M0 | |||
|---|---|---|---|
| Quadrant | BADHDUFLAG | Total packets | Discarded packets |
| A | 0 | 7229 | 0 |
| B | 0 | 7269 | 0 |
| C | 0 | 10441 | 0 |
| D | 0 | 12252 | 0 |
| Quadrant | Total seconds | Saturated seconds | Saturation percentage |
|---|---|---|---|
| A | 3610 | 3 | 0.083102% |
| B | 3611 | 2 | 0.055386% |
| C | 3611 | 47 | 1.301579% |
| D | 3611 | 175 | 4.846303% |
Noise dominated data is calculated using 1-second bins in cleaned event files. If a bin has >2000 counts, and if more than 50% of those come from <1% of pixels, then it is considered to be noise-dominated and hence unusable.
| Quadrant | # 1 sec bins | Bins with >0 counts | Bins with >2000 counts | High rate bins dominated by noise | Noise dominated (total time) | Noise dominated (detector-on time) | Marked lightcurve |
|---|---|---|---|---|---|---|---|
| A | 3610 | 3610 | 0 | 0 | 0.00% | 0.00% | 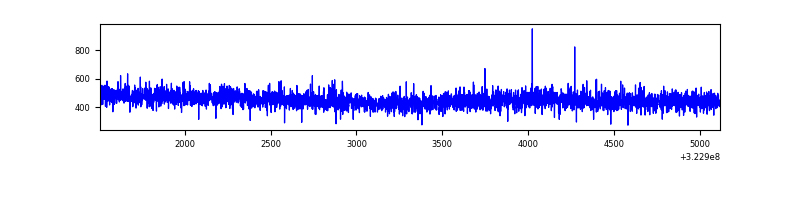 |
| B | 3611 | 3611 | 2 | 2 | 0.06% | 0.06% | 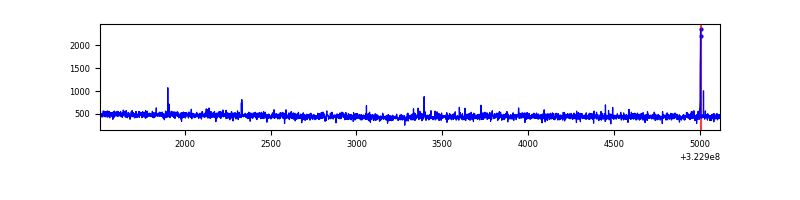 |
| C | 3611 | 3611 | 5 | 5 | 0.14% | 0.14% | 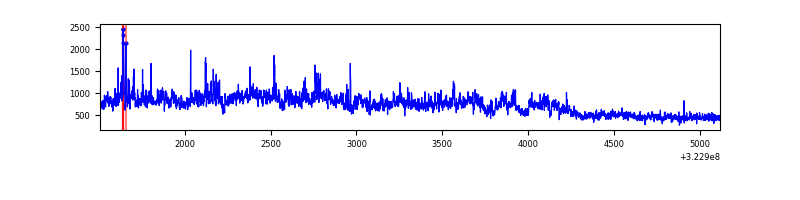 |
| D | 3611 | 3611 | 220 | 220 | 6.09% | 6.09% | 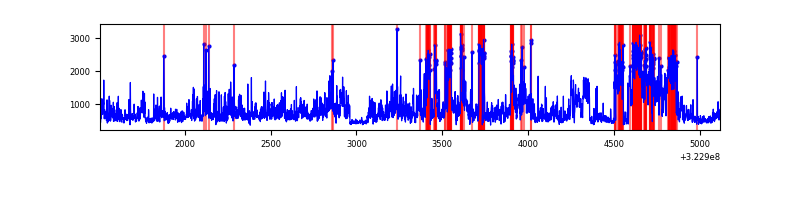 |
Top three noisy pixels from each quadrant. If the there are fewer than three noisy pixels in the level2.evt file, extra rows are filled as -1
| Pixel properties | Quadrant properties | ||||||
|---|---|---|---|---|---|---|---|
| Quadrant | DetID | PixID | Counts | Sigma | Mean | Median | Sigma |
| A | 13 | 254 | 5711 | 62.34 | 419 | 411 | 85.0 |
| A | 0 | 226 | 3606 | 37.58 | 419 | 411 | 85.0 |
| A | 3 | 137 | 3596 | 37.46 | 419 | 411 | 85.0 |
| B | 12 | 111 | 9249 | 112.62 | 413 | 403 | 78.5 |
| B | 11 | 111 | 8056 | 97.43 | 413 | 403 | 78.5 |
| B | 5 | 172 | 7979 | 96.45 | 413 | 403 | 78.5 |
| C | 7 | 247 | 934798 | 10034.16 | 400 | 403 | 93.1 |
| C | 2 | 16 | 109612 | 1172.76 | 400 | 403 | 93.1 |
| C | 14 | 238 | 64818 | 691.73 | 400 | 403 | 93.1 |
| D | 1 | 52 | 935368 | 9563.88 | 405 | 393 | 97.8 |
| D | 8 | 195 | 471119 | 4815.06 | 405 | 393 | 97.8 |
| D | 12 | 218 | 204851 | 2091.4 | 405 | 393 | 97.8 |
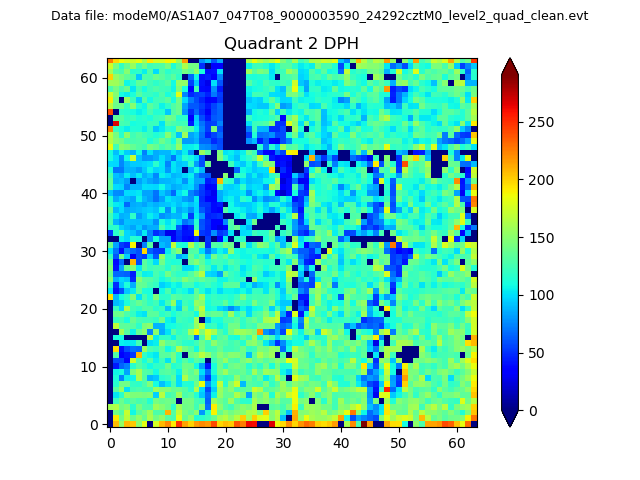
Histogram calculated using DETX and DETY for each event in the final _common_clean file
| Quadrant A | 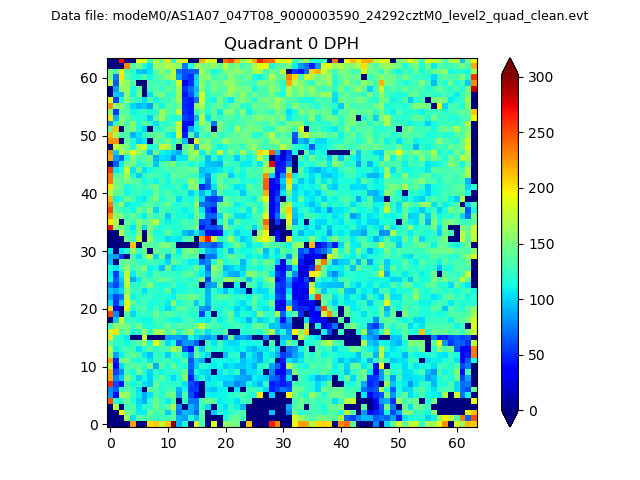 |
 |
Quadrant B |
|---|---|---|---|
| Quadrant D |  |
 |
Quadrant C |
| Plot type | Count rate plots | Images |
|---|---|---|
| Comparison with Poisson distribution Blue bars denote a histogram of data divided into 1 sec bins. Red curve is a Poisson curve with rate = median count rate of data. |
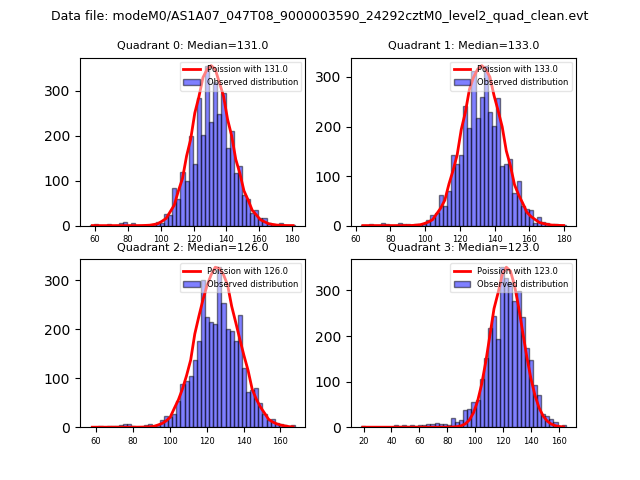 |
 |
| Quadrant-wise count rates Data is divided into 100 sec bins |
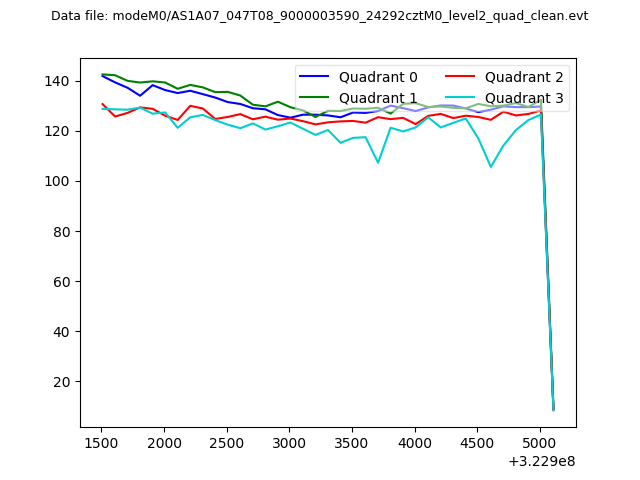 |
|
| Module-wise count rates for Quadrant A Data is divided into 100 sec bins |
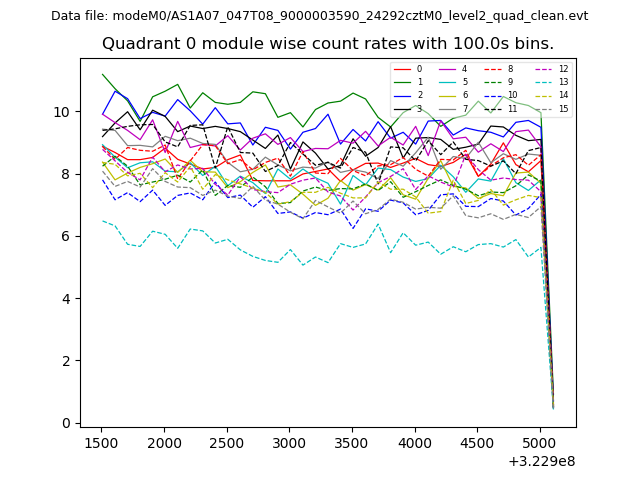 |
 |
| Module-wise count rates for Quadrant B Data is divided into 100 sec bins |
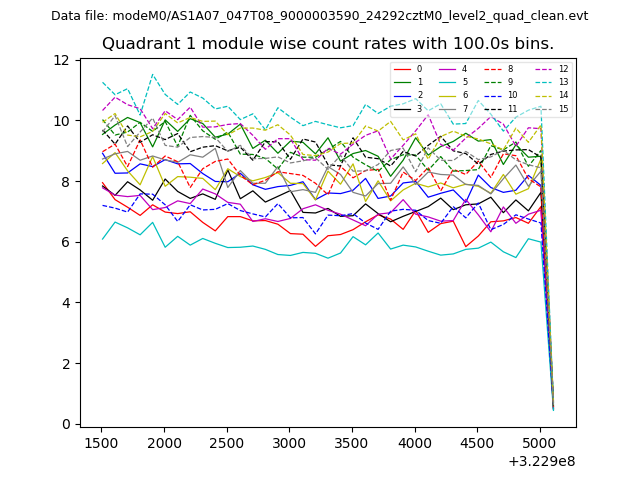 |
 |
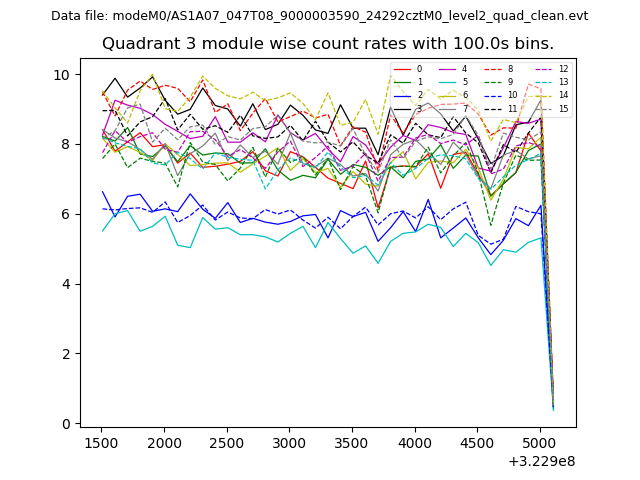
| Module-wise count rates for Quadrant C Data is divided into 100 sec bins |
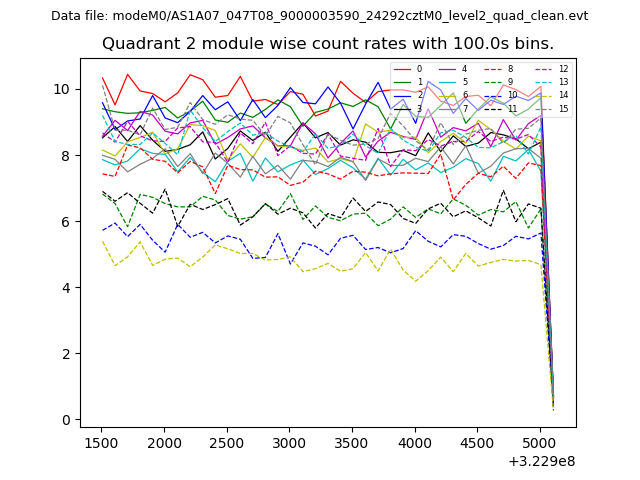 |
 |
| Module-wise count rates for Quadrant D Data is divided into 100 sec bins |
 |
 |
| Parameter | Plot |
|---|---|
| CZT HV Monitor | 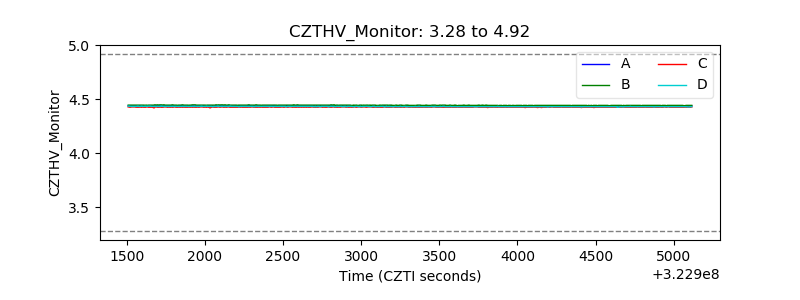 |
| D_VDD | 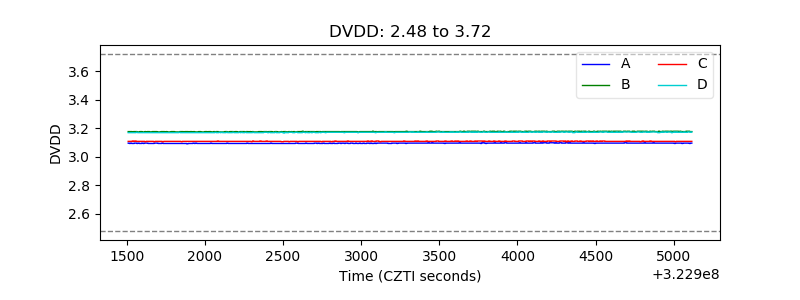 |
| Temperature 1 | 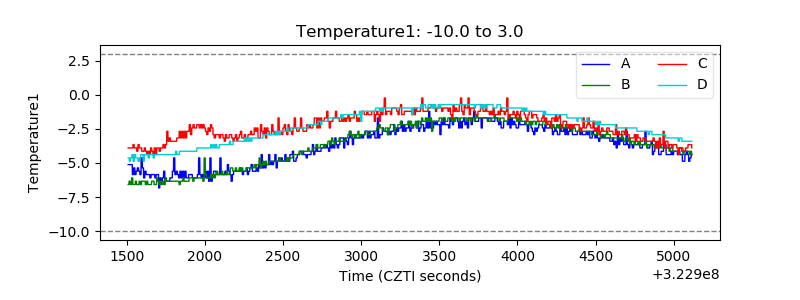 |
| Veto HV Monitor | 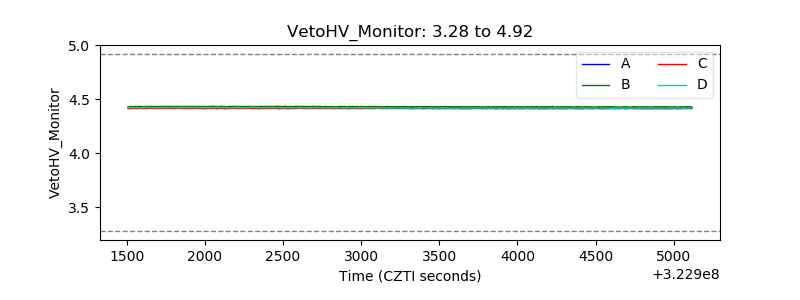 |
| Veto LLD | 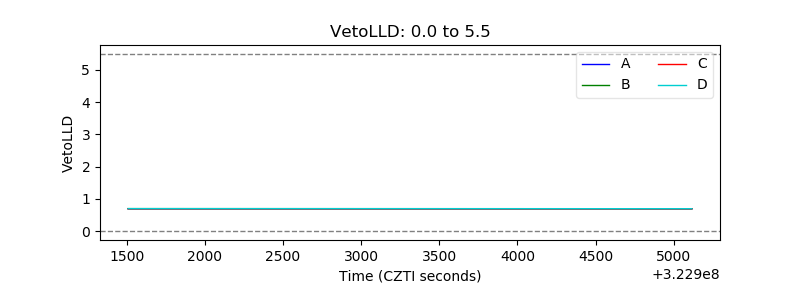 |
| Alpha Counter | 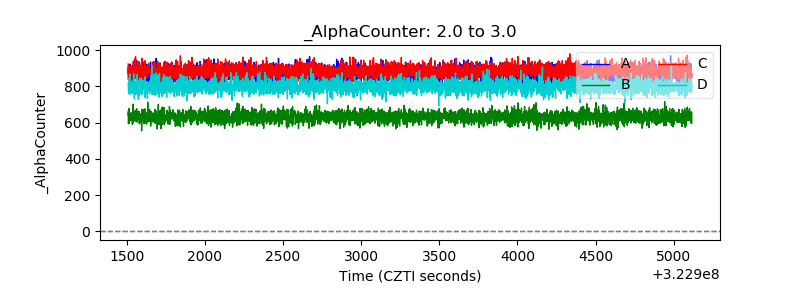 |
| _CPM_Rate | 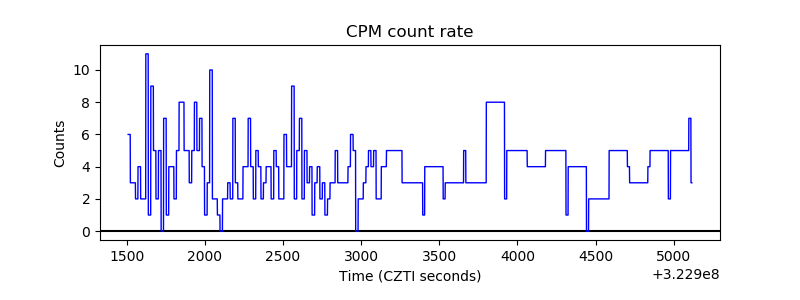 |
| CZT Counter | 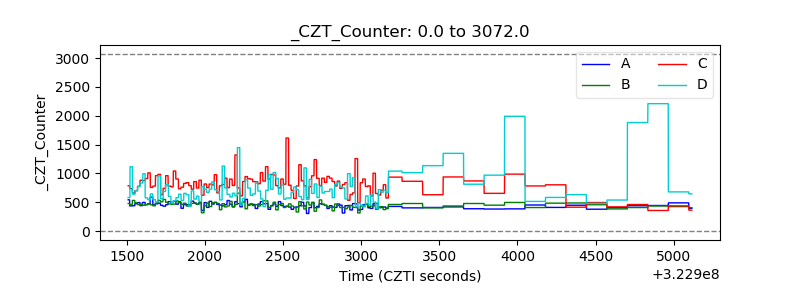 |
| +2.5 Volts monitor |  |
| +5 Volts monitor | 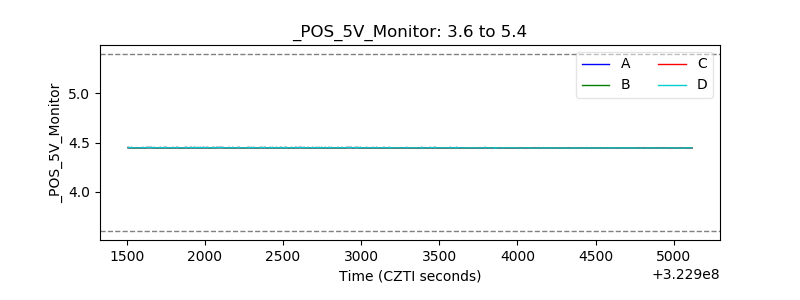 |
| _ROLL_ROT | 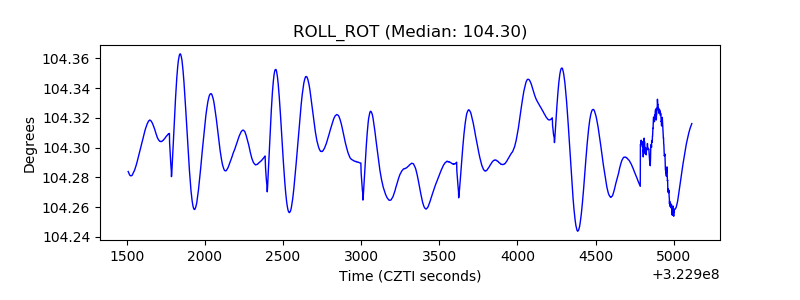 |
| _Roll_DEC | 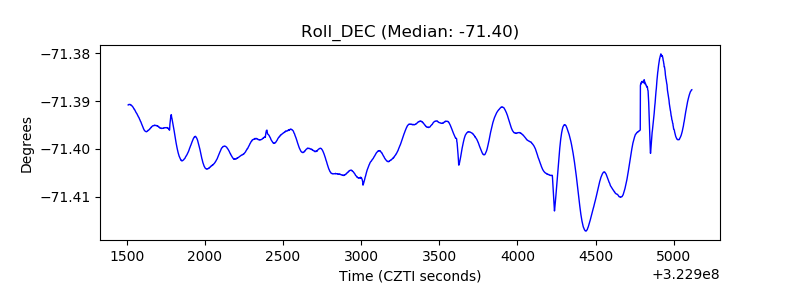 |
| _Roll_RA | 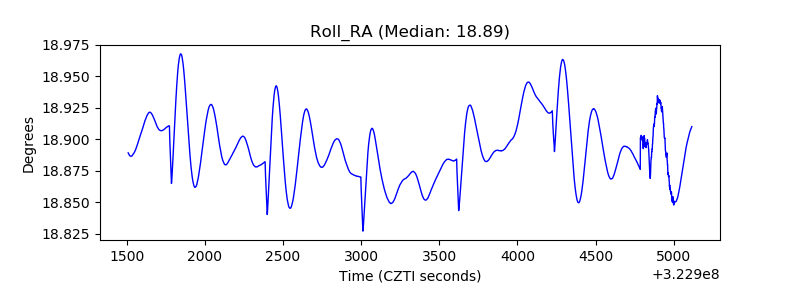 |
| Veto Counter | 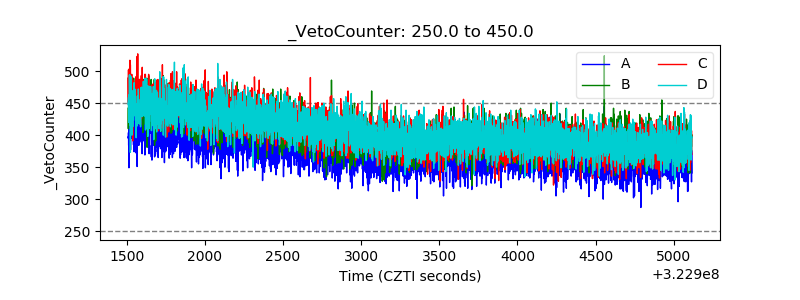 |