| Param | Original file | Final file |
|---|---|---|
| Filename | modeM0/AS1A07_027T10_9000003592_24297cztM0_level2.evt | modeM0/AS1A07_027T10_9000003592_24297cztM0_level2_quad_clean.evt |
| Size (bytes) | 273,049,920 | 37,837,440 |
| Size | 260.4 MB | 36.1 MB |
| Events in quadrant A | 1,459,919 | 240,714 |
| Events in quadrant B | 1,462,207 | 245,664 |
| Events in quadrant C | 1,640,123 | 233,386 |
| Events in quadrant D | 3,506,793 | 217,027 |
| Mode SS | |||
|---|---|---|---|
| Quadrant | BADHDUFLAG | Total packets | Discarded packets |
| A | 0 | 62 | 0 |
| B | 0 | 62 | 0 |
| C | 0 | 62 | 0 |
| D | 0 | 62 | 0 |
| Mode M9 | |||
|---|---|---|---|
| Quadrant | BADHDUFLAG | Total packets | Discarded packets |
| A | 0 | 3 | 0 |
| B | 0 | 3 | 0 |
| C | 0 | 3 | 0 |
| D | 0 | 3 | 0 |
| Mode M0 | |||
|---|---|---|---|
| Quadrant | BADHDUFLAG | Total packets | Discarded packets |
| A | 0 | 6149 | 1 |
| B | 0 | 6165 | 1 |
| C | 0 | 6551 | 1 |
| D | 0 | 12368 | 1 |
| Quadrant | Total seconds | Saturated seconds | Saturation percentage |
|---|---|---|---|
| A | 2923 | 158 | 5.405405% |
| B | 2923 | 158 | 5.405405% |
| C | 2924 | 179 | 6.121751% |
| D | 2924 | 540 | 18.467852% |
Noise dominated data is calculated using 1-second bins in cleaned event files. If a bin has >2000 counts, and if more than 50% of those come from <1% of pixels, then it is considered to be noise-dominated and hence unusable.
| Quadrant | # 1 sec bins | Bins with >0 counts | Bins with >2000 counts | High rate bins dominated by noise | Noise dominated (total time) | Noise dominated (detector-on time) | Marked lightcurve |
|---|---|---|---|---|---|---|---|
| A | 3153 | 2923 | 0 | 0 | 0.00% | 0.00% | 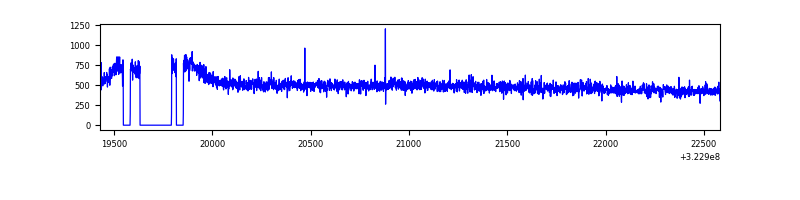 |
| B | 3153 | 2923 | 0 | 0 | 0.00% | 0.00% | 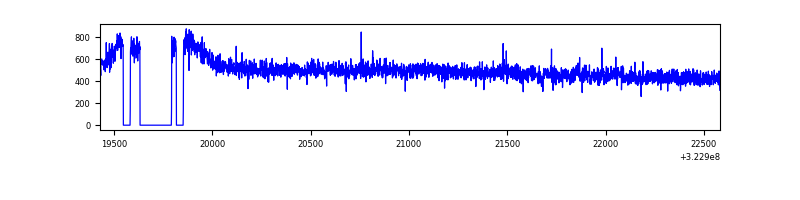 |
| C | 3154 | 2925 | 0 | 0 | 0.00% | 0.00% | 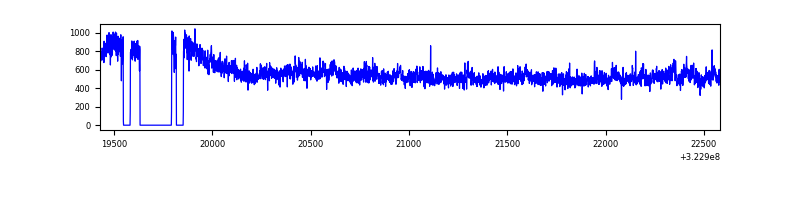 |
| D | 3154 | 2924 | 282 | 282 | 8.94% | 9.64% | 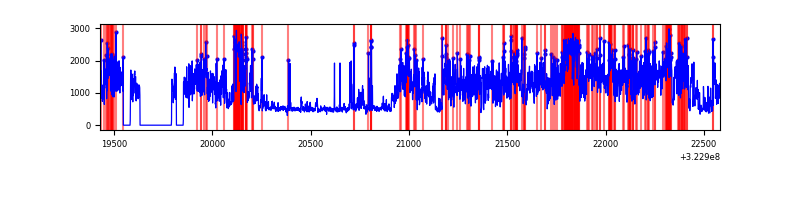 |
Top three noisy pixels from each quadrant. If the there are fewer than three noisy pixels in the level2.evt file, extra rows are filled as -1
| Pixel properties | Quadrant properties | ||||||
|---|---|---|---|---|---|---|---|
| Quadrant | DetID | PixID | Counts | Sigma | Mean | Median | Sigma |
| A | 13 | 254 | 4120 | 48.14 | 377 | 367 | 78.0 |
| A | 3 | 137 | 3528 | 40.55 | 377 | 367 | 78.0 |
| A | 0 | 226 | 3387 | 38.74 | 377 | 367 | 78.0 |
| B | 12 | 111 | 8986 | 115.55 | 370 | 359 | 74.7 |
| B | 11 | 111 | 8318 | 106.6 | 370 | 359 | 74.7 |
| B | 14 | 111 | 7029 | 89.33 | 370 | 359 | 74.7 |
| C | 7 | 247 | 195612 | 2301.07 | 356 | 356 | 84.9 |
| C | 14 | 238 | 54916 | 642.98 | 356 | 356 | 84.9 |
| C | 13 | 61 | 2406 | 24.16 | 356 | 356 | 84.9 |
| D | 1 | 52 | 1789053 | 20663.01 | 348 | 338 | 86.6 |
| D | 12 | 233 | 214055 | 2468.83 | 348 | 338 | 86.6 |
| D | 10 | 103 | 120464 | 1387.68 | 348 | 338 | 86.6 |
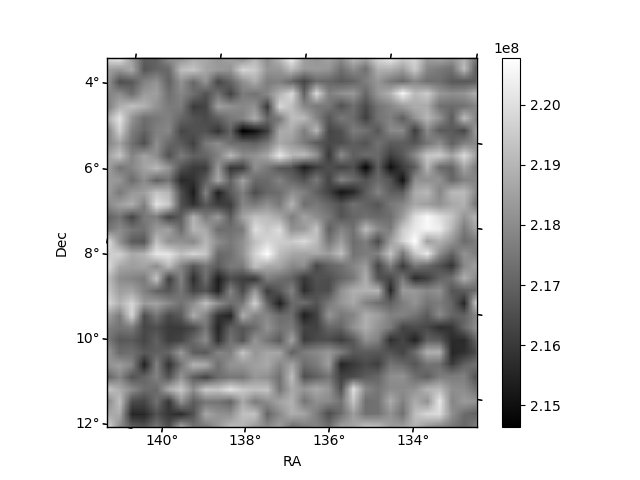
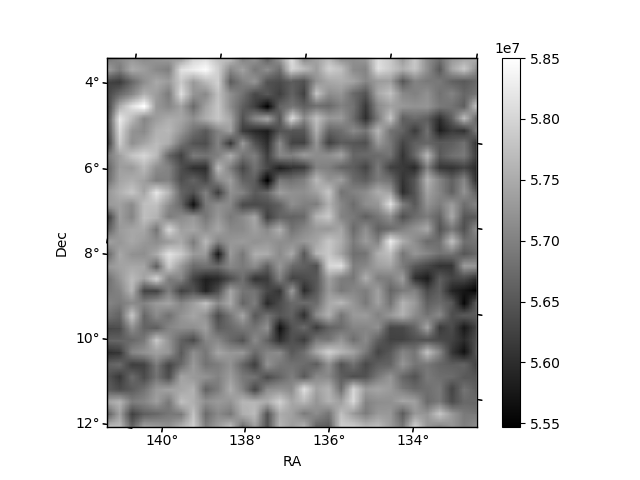
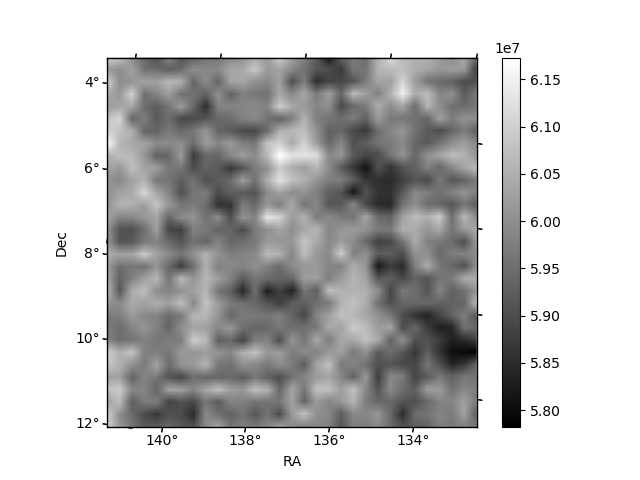
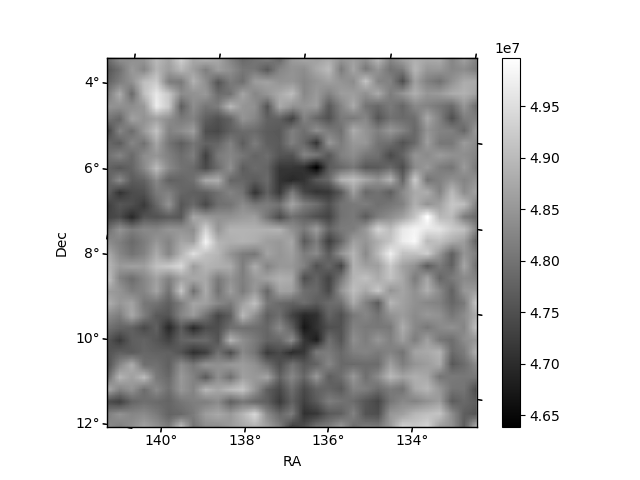
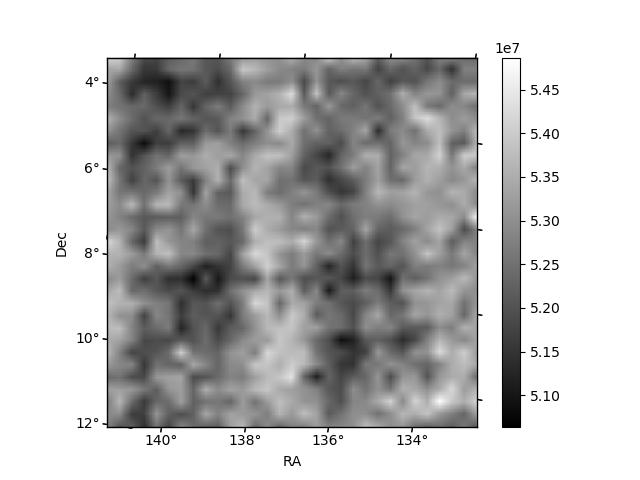
Histogram calculated using DETX and DETY for each event in the final _common_clean file
| Quadrant A | 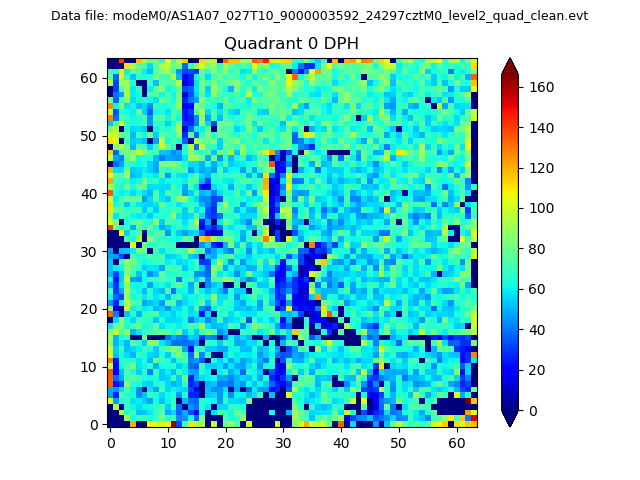 |
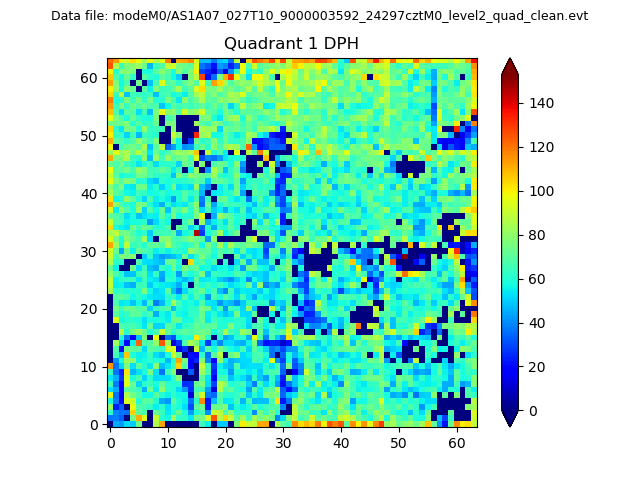 |
Quadrant B |
|---|---|---|---|
| Quadrant D | 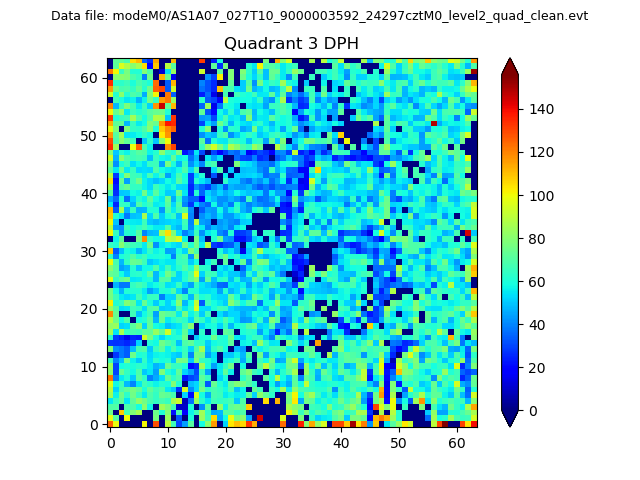 |
 |
Quadrant C |
| Plot type | Count rate plots | Images |
|---|---|---|
| Comparison with Poisson distribution Blue bars denote a histogram of data divided into 1 sec bins. Red curve is a Poisson curve with rate = median count rate of data. |
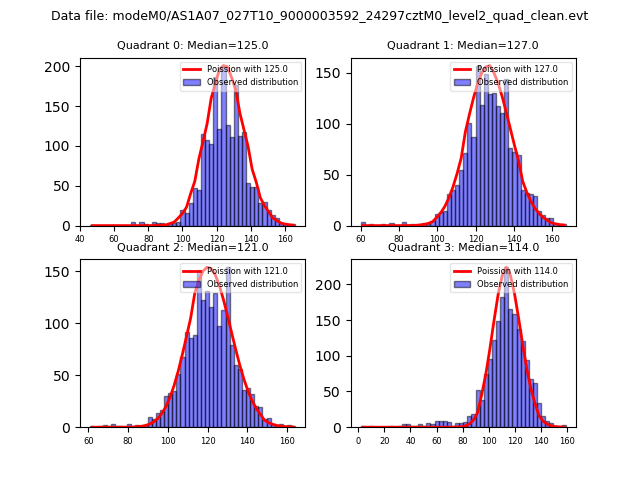 |
 |
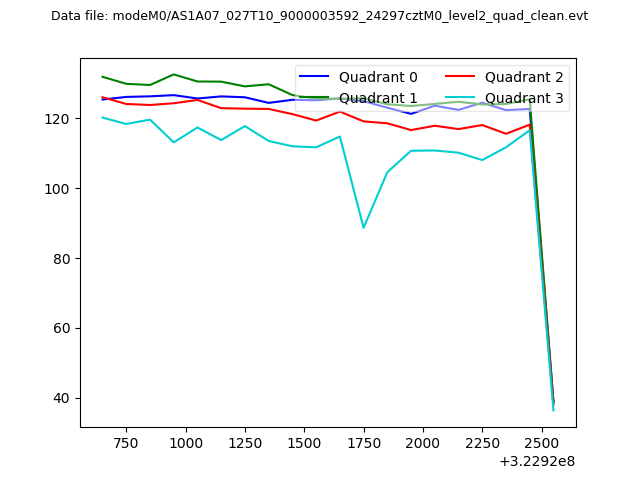
| Quadrant-wise count rates Data is divided into 100 sec bins |
 |
|
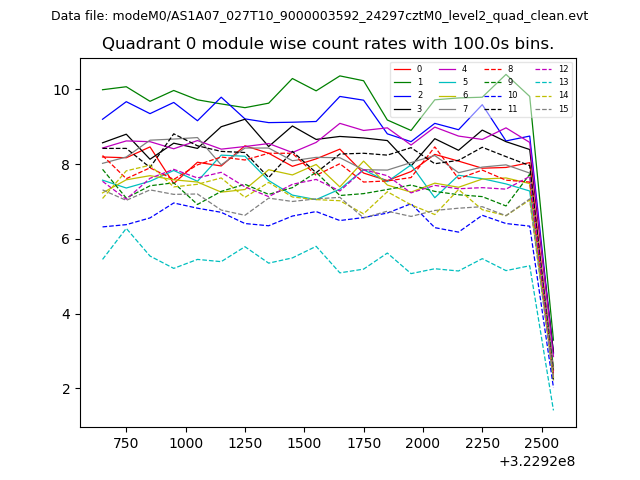
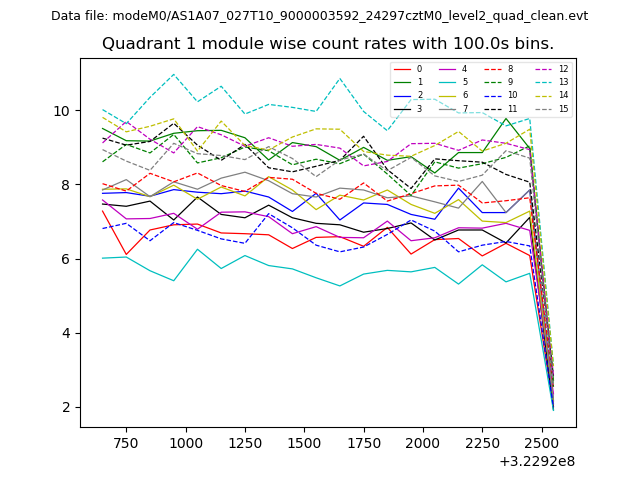
| Module-wise count rates for Quadrant A Data is divided into 100 sec bins |
 |
 |
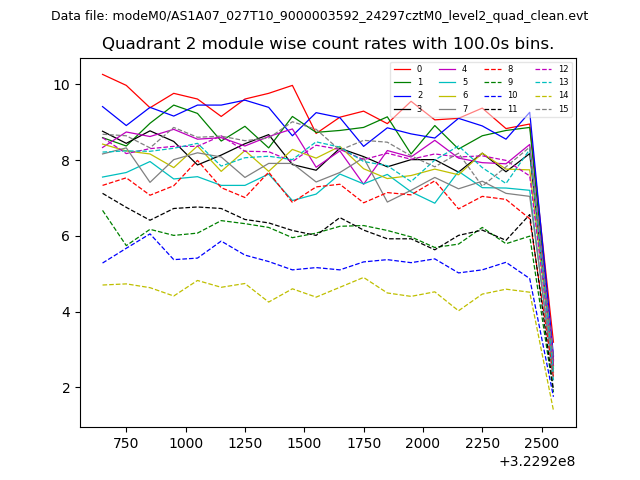
| Module-wise count rates for Quadrant B Data is divided into 100 sec bins |
 |
 |
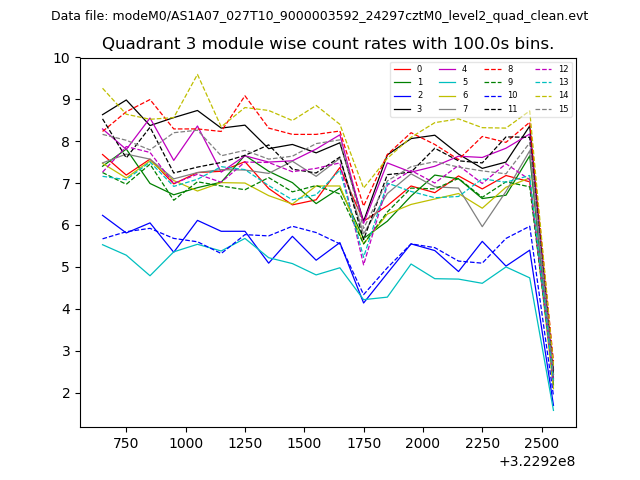
| Module-wise count rates for Quadrant C Data is divided into 100 sec bins |
 |
 |
| Module-wise count rates for Quadrant D Data is divided into 100 sec bins |
 |
 |
| Parameter | Plot |
|---|---|
| CZT HV Monitor | 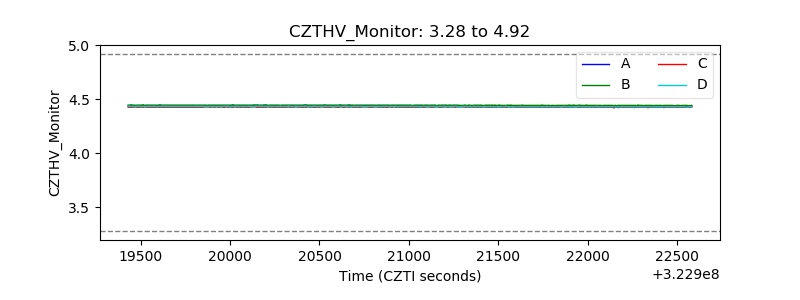 |
| D_VDD | 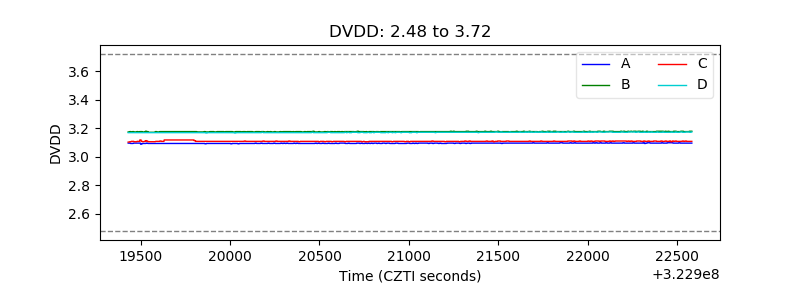 |
| Temperature 1 | 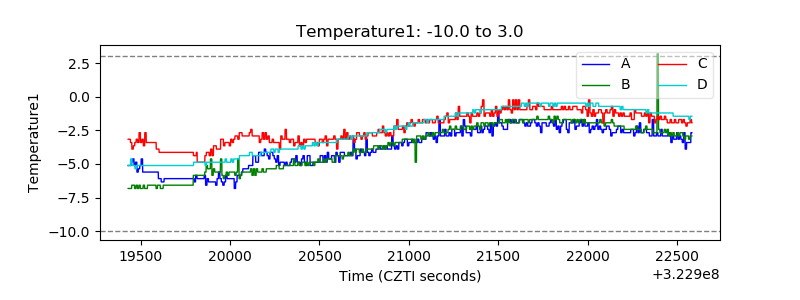 |
| Veto HV Monitor | 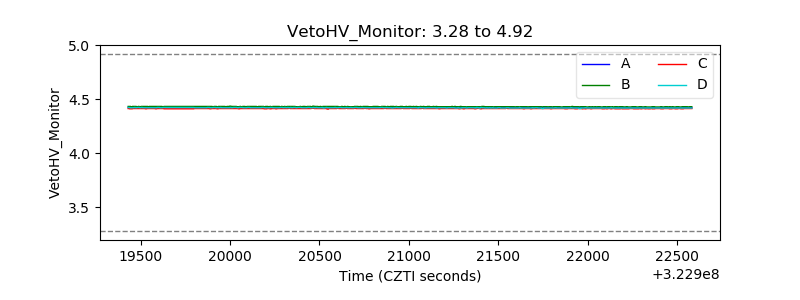 |
| Veto LLD | 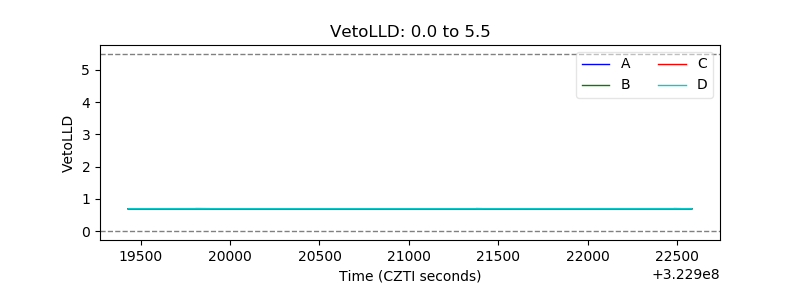 |
| Alpha Counter | 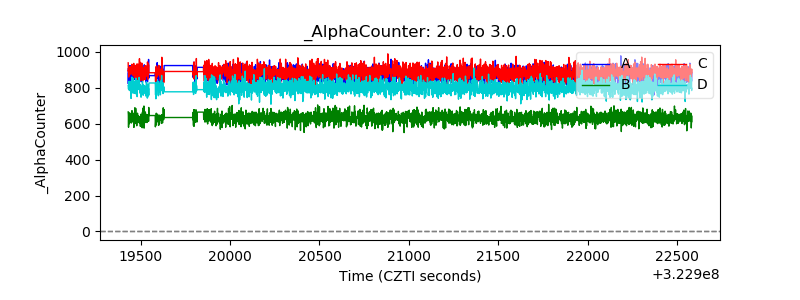 |
| _CPM_Rate | 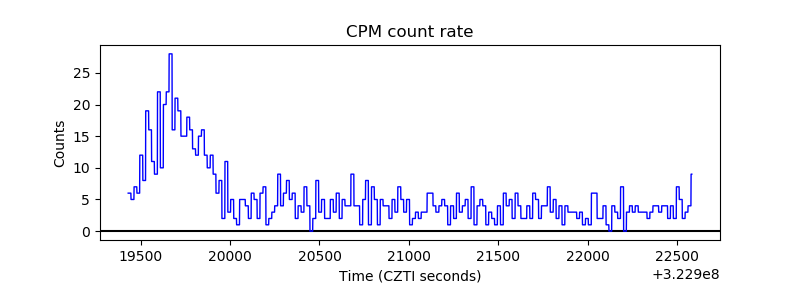 |
| CZT Counter | 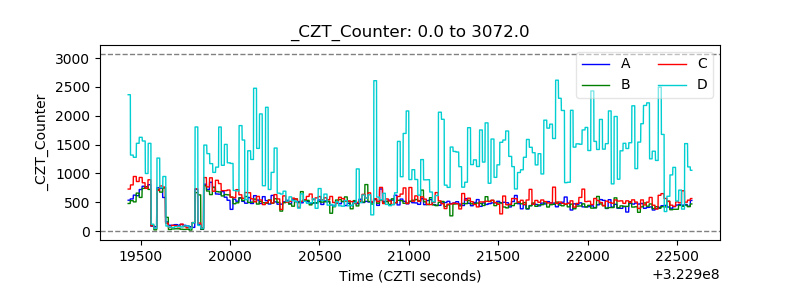 |
| +2.5 Volts monitor | 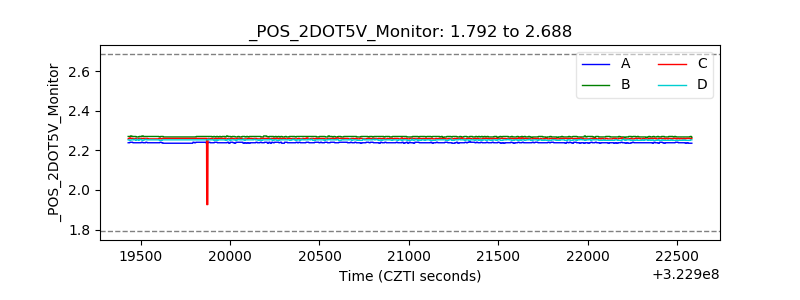 |
| +5 Volts monitor |  |
| _ROLL_ROT | 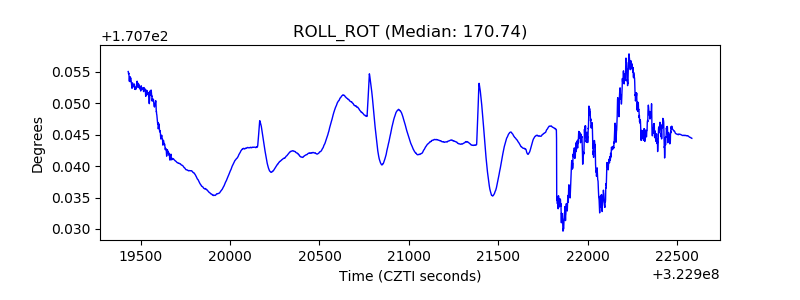 |
| _Roll_DEC | 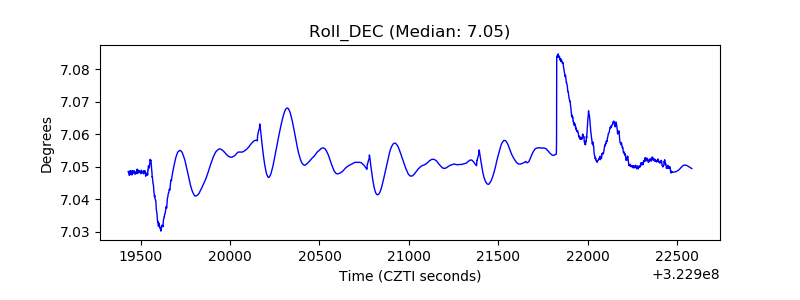 |
| _Roll_RA | 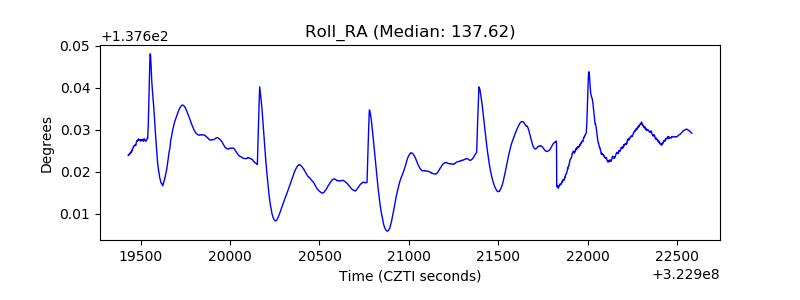 |
| Veto Counter | 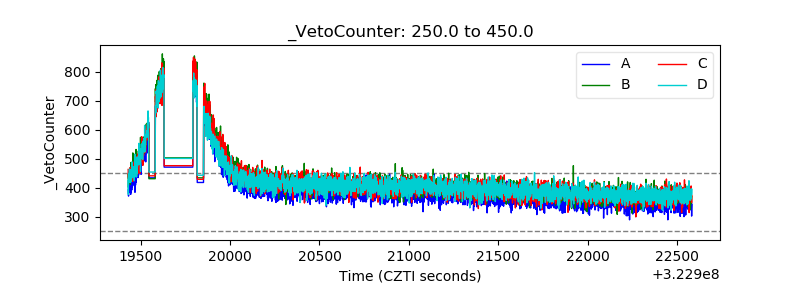 |