| Param | Original file | Final file |
|---|---|---|
| Filename | modeM0/AS1A07_145T01_9000003594cztM0_level2.fits | modeM0/AS1A07_145T01_9000003594cztM0_level2_quad_clean.evt |
| Size (bytes) | 3,736,791,360 | 3,494,243,520 |
| Size | 3.5 GB | 3.3 GB |
| Events in quadrant A | 23,218,104 | 20,747,036 |
| Events in quadrant B | 22,347,852 | 21,070,756 |
| Events in quadrant C | 22,557,698 | 20,044,052 |
| Events in quadrant D | 18,862,950 | 17,805,118 |
| Mode M0 | |||
|---|---|---|---|
| Quadrant | BADHDUFLAG | Total packets | Discarded packets |
| A | 0 | 792506 | 0 |
| B | 0 | 865258 | 0 |
| C | 0 | 1052864 | 0 |
| D | 0 | 1257681 | 0 |
| Mode M9 | |||
|---|---|---|---|
| Quadrant | BADHDUFLAG | Total packets | Discarded packets |
| A | 0 | 618 | 0 |
| B | 0 | 618 | 0 |
| C | 0 | 618 | 0 |
| D | 0 | 618 | 0 |
| Mode SS | |||
|---|---|---|---|
| Quadrant | BADHDUFLAG | Total packets | Discarded packets |
| A | 0 | 7780 | 0 |
| B | 0 | 7770 | 0 |
| C | 0 | 7778 | 0 |
| D | 0 | 7778 | 0 |
| Quadrant | Total seconds | Saturated seconds | Saturation percentage |
|---|---|---|---|
| A | 382031 | 4339 | 1.135772% |
| B | 382043 | 8892 | 2.327487% |
| C | 382035 | 14461 | 3.785255% |
| D | 381952 | 44607 | 11.678693% |
Noise dominated data is calculated using 1-second bins in cleaned event files. If a bin has >2000 counts, and if more than 50% of those come from <1% of pixels, then it is considered to be noise-dominated and hence unusable.
| Quadrant | # 1 sec bins | Bins with >0 counts | Bins with >2000 counts | High rate bins dominated by noise | Noise dominated (total time) | Noise dominated (detector-on time) | Marked lightcurve |
|---|---|---|---|---|---|---|---|
| A | 450509 | 382303 | 0 | 0 | 0.00% | 0.00% |  |
| B | 450509 | 382307 | 0 | 0 | 0.00% | 0.00% | 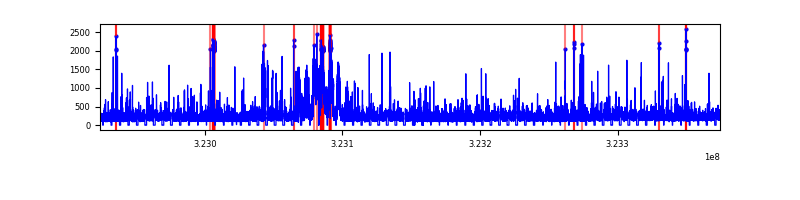 |
| C | 450509 | 382262 | 0 | 0 | 0.00% | 0.00% |  |
| D | 450509 | 381435 | 0 | 0 | 0.00% | 0.00% | 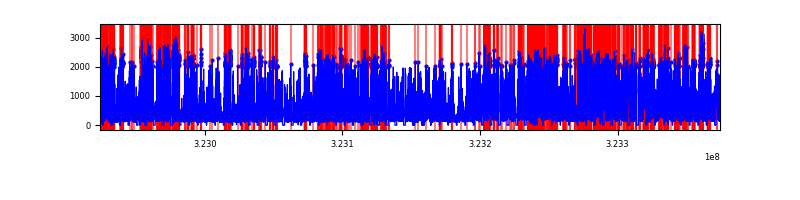 |
Top three noisy pixels from each quadrant. If the there are fewer than three noisy pixels in the level2.evt file, extra rows are filled as -1
| Pixel properties | Quadrant properties | ||||||
|---|---|---|---|---|---|---|---|
| Quadrant | DetID | PixID | Counts | Sigma | Mean | Median | Sigma |
| A | 0 | 29 | 22136 | 11.11 | 6040 | 5653 | 1483.3 |
| A | 7 | 110 | 18493 | 8.66 | 6040 | 5653 | 1483.3 |
| A | 9 | 19 | 17139 | 7.74 | 6040 | 5653 | 1483.3 |
| B | 2 | 9 | 18105 | 10.82 | 5908 | 5632 | 1153.3 |
| B | 2 | 8 | 15168 | 8.27 | 5908 | 5632 | 1153.3 |
| B | 3 | 80 | 14712 | 7.87 | 5908 | 5632 | 1153.3 |
| C | 1 | 80 | 17268 | 7.8 | 5948 | 5562 | 1501.1 |
| C | 1 | 81 | 17229 | 7.77 | 5948 | 5562 | 1501.1 |
| C | 12 | 241 | 15644 | 6.72 | 5948 | 5562 | 1501.1 |
| D | 3 | 14 | 13743 | 6.17 | 5384 | 4901 | 1433.4 |
| D | 15 | 46 | 13537 | 6.02 | 5384 | 4901 | 1433.4 |
| D | 7 | 3 | 13364 | 5.9 | 5384 | 4901 | 1433.4 |
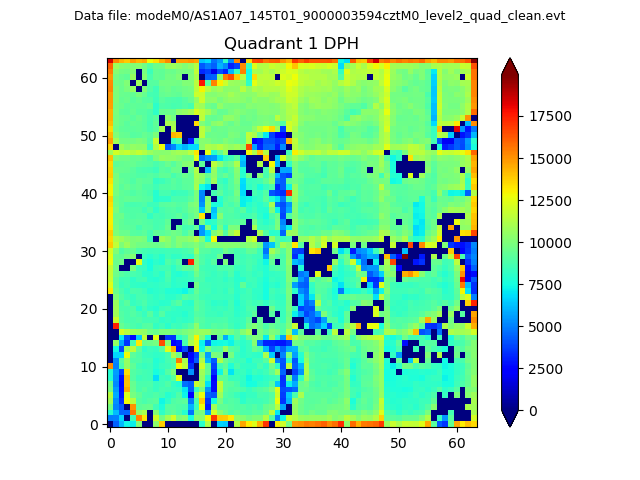
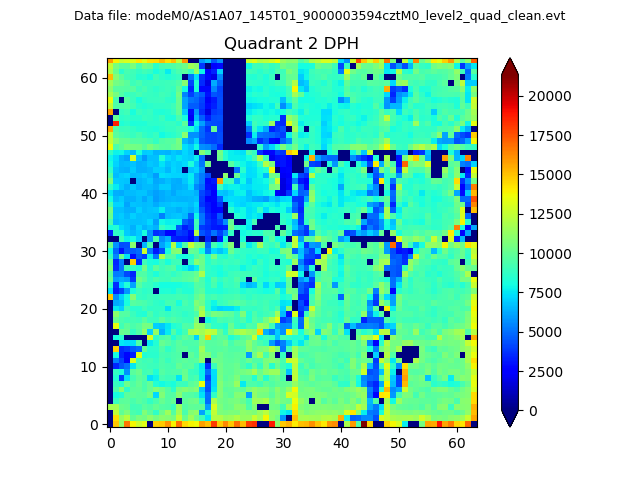
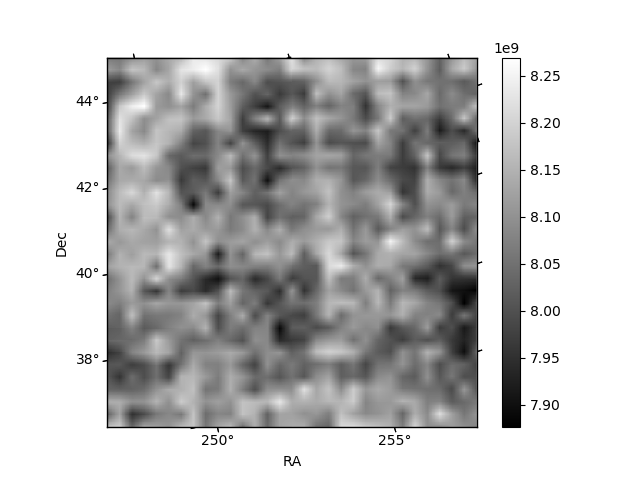
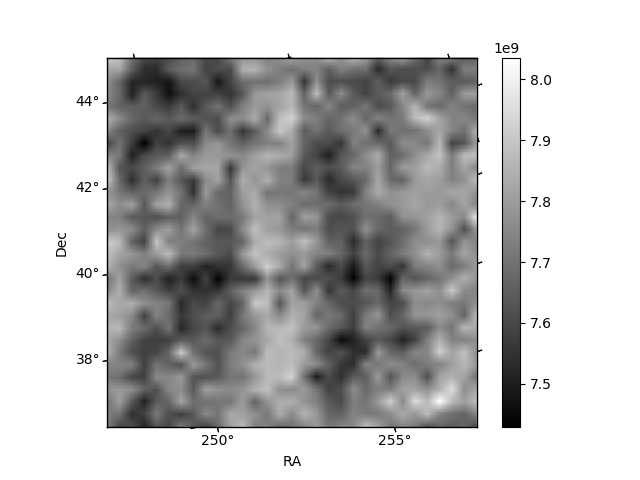
Histogram calculated using DETX and DETY for each event in the final _common_clean file
| Quadrant A |  |
 |
Quadrant B |
|---|---|---|---|
| Quadrant D |  |
 |
Quadrant C |
| Plot type | Count rate plots | Images |
|---|---|---|
| Comparison with Poisson distribution Blue bars denote a histogram of data divided into 1 sec bins. Red curve is a Poisson curve with rate = median count rate of data. |
 |
 |
| Quadrant-wise count rates Data is divided into 100 sec bins |
 |
|
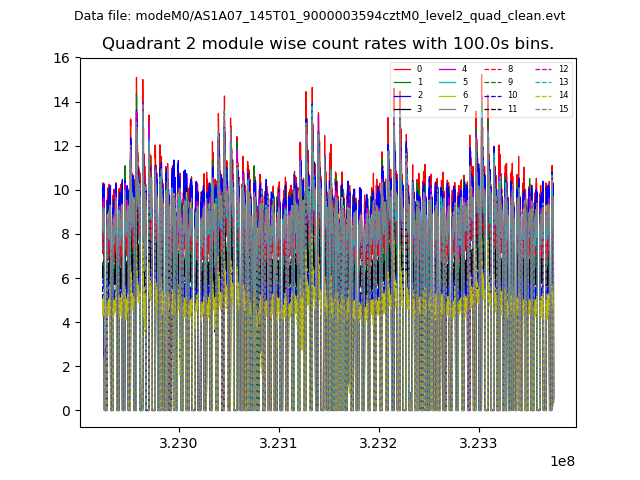
| Module-wise count rates for Quadrant A Data is divided into 100 sec bins |
 |
 |
| Module-wise count rates for Quadrant B Data is divided into 100 sec bins |
 |
 |
| Module-wise count rates for Quadrant C Data is divided into 100 sec bins |
 |
 |
| Module-wise count rates for Quadrant D Data is divided into 100 sec bins |
 |
 |
| Parameter | Plot |
|---|---|
| CZT HV Monitor |  |
| D_VDD | 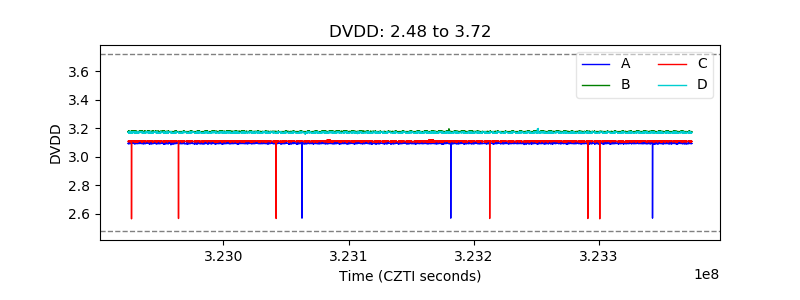 |
| Temperature 1 | 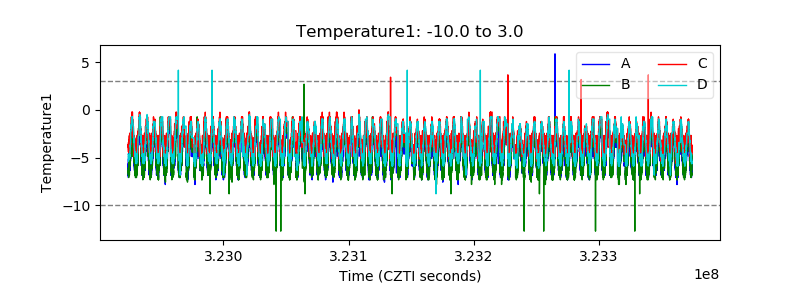 |
| Veto HV Monitor |  |
| Veto LLD | 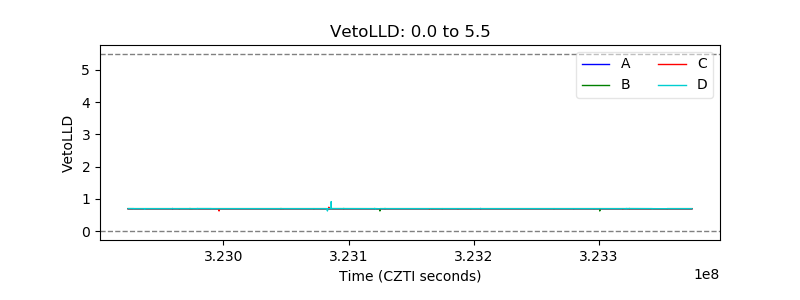 |
| Alpha Counter |  |
| _CPM_Rate |  |
| CZT Counter |  |
| +2.5 Volts monitor |  |
| +5 Volts monitor |  |
| _ROLL_ROT | 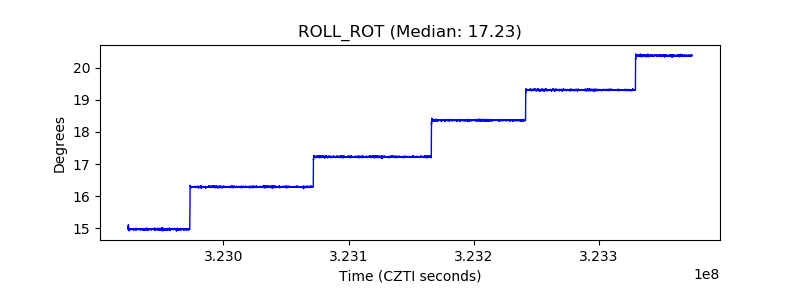 |
| _Roll_DEC | 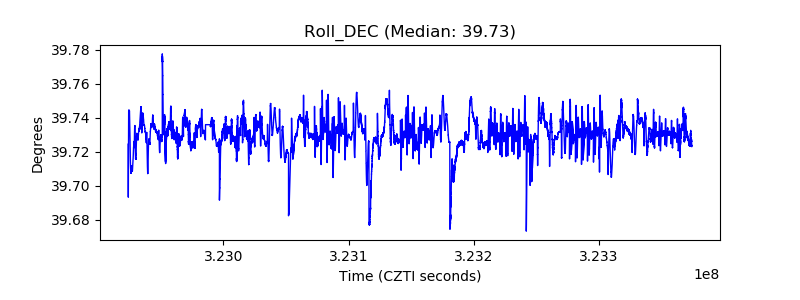 |
| _Roll_RA |  |
| Veto Counter |  |