| Param | Original file | Final file |
|---|---|---|
| Filename | modeM0/AS1A07_145T01_9000003594_24297cztM0_level2.evt | modeM0/AS1A07_145T01_9000003594_24297cztM0_level2_quad_clean.evt |
| Size (bytes) | 1,199,396,160 | 187,678,080 |
| Size | 1.1 GB | 179.0 MB |
| Events in quadrant A | 6,883,279 | 1,187,347 |
| Events in quadrant B | 7,029,412 | 1,207,172 |
| Events in quadrant C | 7,870,127 | 1,170,840 |
| Events in quadrant D | 13,561,176 | 1,116,915 |
| Mode M0 | |||
|---|---|---|---|
| Quadrant | BADHDUFLAG | Total packets | Discarded packets |
| A | 0 | 29769 | 3 |
| B | 0 | 29952 | 3 |
| C | 0 | 32127 | 3 |
| D | 0 | 50195 | 3 |
| Mode M9 | |||
|---|---|---|---|
| Quadrant | BADHDUFLAG | Total packets | Discarded packets |
| A | 0 | 20 | 0 |
| B | 0 | 20 | 0 |
| C | 0 | 20 | 0 |
| D | 0 | 20 | 0 |
| Mode SS | |||
|---|---|---|---|
| Quadrant | BADHDUFLAG | Total packets | Discarded packets |
| A | 0 | 296 | 0 |
| B | 0 | 296 | 0 |
| C | 0 | 296 | 0 |
| D | 0 | 296 | 0 |
| Quadrant | Total seconds | Saturated seconds | Saturation percentage |
|---|---|---|---|
| A | 14510 | 141 | 0.971744% |
| B | 14510 | 180 | 1.240524% |
| C | 14510 | 242 | 1.667815% |
| D | 14510 | 1989 | 13.707788% |
Noise dominated data is calculated using 1-second bins in cleaned event files. If a bin has >2000 counts, and if more than 50% of those come from <1% of pixels, then it is considered to be noise-dominated and hence unusable.
| Quadrant | # 1 sec bins | Bins with >0 counts | Bins with >2000 counts | High rate bins dominated by noise | Noise dominated (total time) | Noise dominated (detector-on time) | Marked lightcurve |
|---|---|---|---|---|---|---|---|
| A | 16460 | 14510 | 0 | 0 | 0.00% | 0.00% | 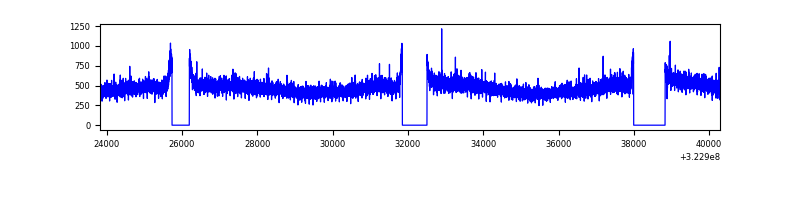 |
| B | 16460 | 14510 | 14 | 14 | 0.09% | 0.10% | 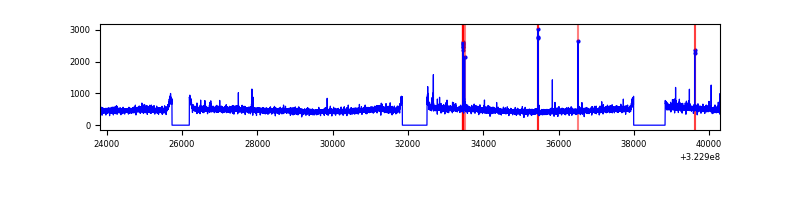 |
| C | 16460 | 14510 | 15 | 15 | 0.09% | 0.10% | 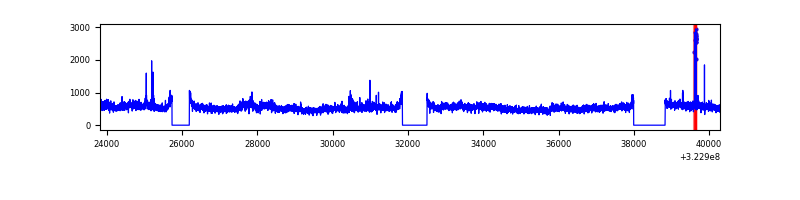 |
| D | 16460 | 14510 | 1629 | 1629 | 9.90% | 11.23% | 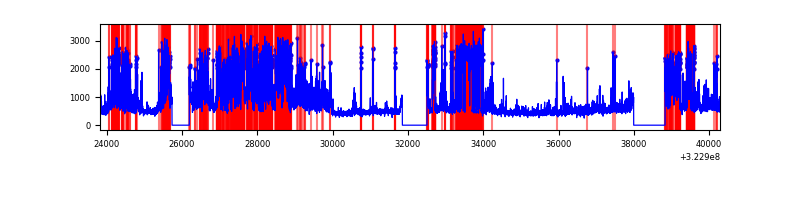 |
Top three noisy pixels from each quadrant. If the there are fewer than three noisy pixels in the level2.evt file, extra rows are filled as -1
| Pixel properties | Quadrant properties | ||||||
|---|---|---|---|---|---|---|---|
| Quadrant | DetID | PixID | Counts | Sigma | Mean | Median | Sigma |
| A | 13 | 254 | 22059 | 56.7 | 1779 | 1740 | 358.3 |
| A | 3 | 1 | 21069 | 53.94 | 1779 | 1740 | 358.3 |
| A | 3 | 137 | 16496 | 41.18 | 1779 | 1740 | 358.3 |
| B | 5 | 32 | 52420 | 148.2 | 1775 | 1729 | 342.0 |
| B | 12 | 111 | 41537 | 116.38 | 1775 | 1729 | 342.0 |
| B | 11 | 111 | 37132 | 103.5 | 1775 | 1729 | 342.0 |
| C | 7 | 247 | 846886 | 2125.47 | 1709 | 1718 | 397.6 |
| C | 14 | 238 | 271575 | 678.65 | 1709 | 1718 | 397.6 |
| C | 2 | 16 | 76528 | 188.13 | 1709 | 1718 | 397.6 |
| D | 1 | 52 | 5584367 | 13925.9 | 1636 | 1584 | 400.9 |
| D | 8 | 195 | 1463166 | 3645.82 | 1636 | 1584 | 400.9 |
| D | 12 | 233 | 173903 | 429.84 | 1636 | 1584 | 400.9 |
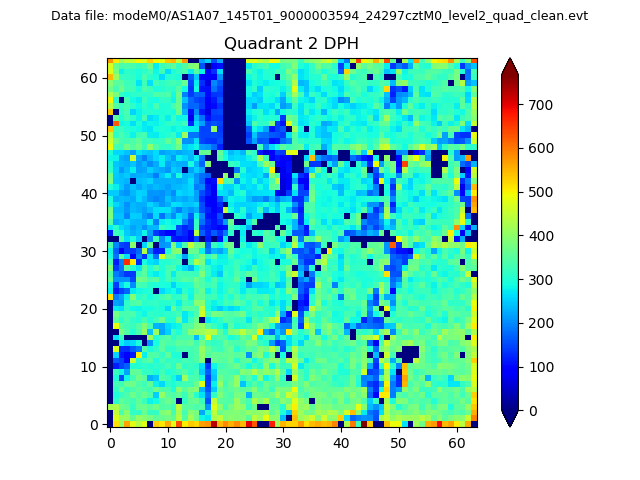
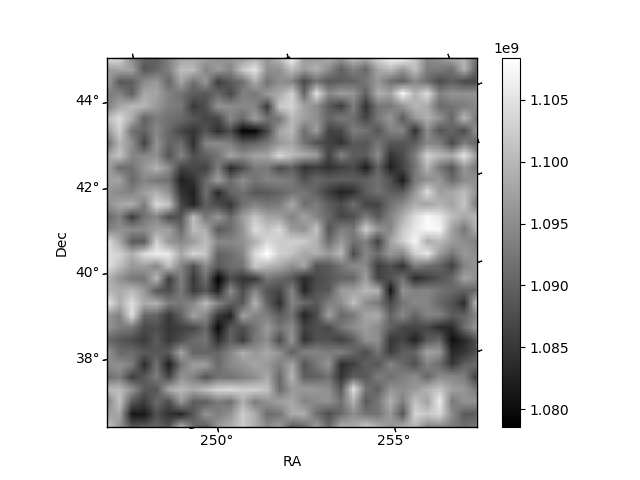
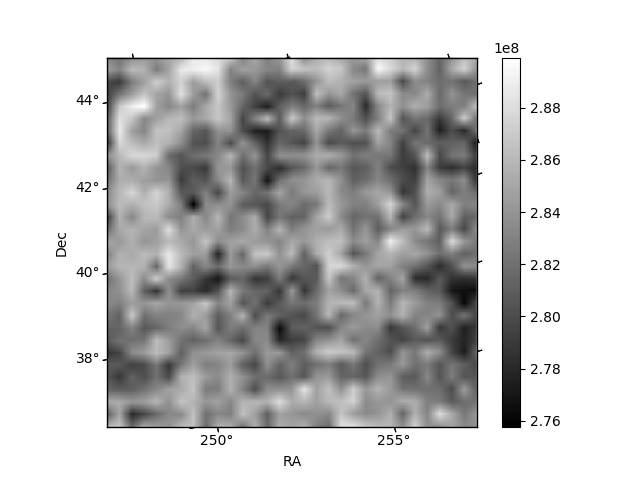
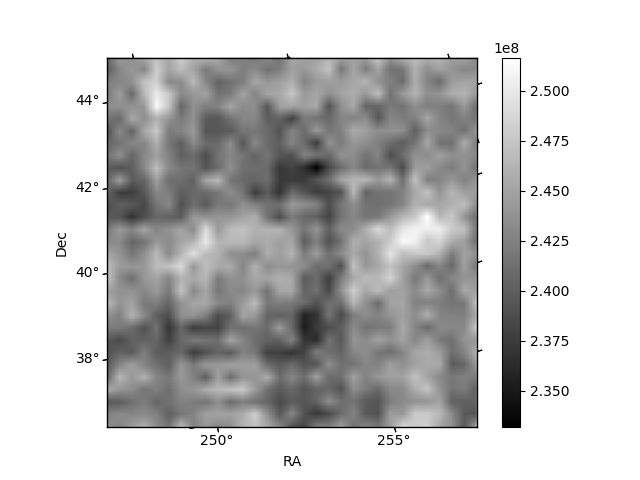
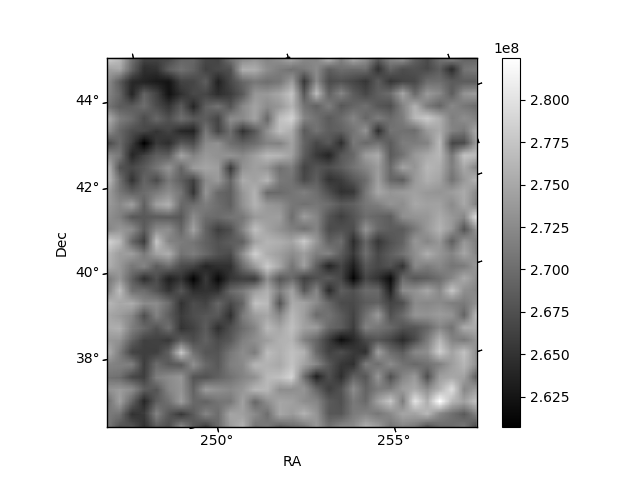
Histogram calculated using DETX and DETY for each event in the final _common_clean file
| Quadrant A | 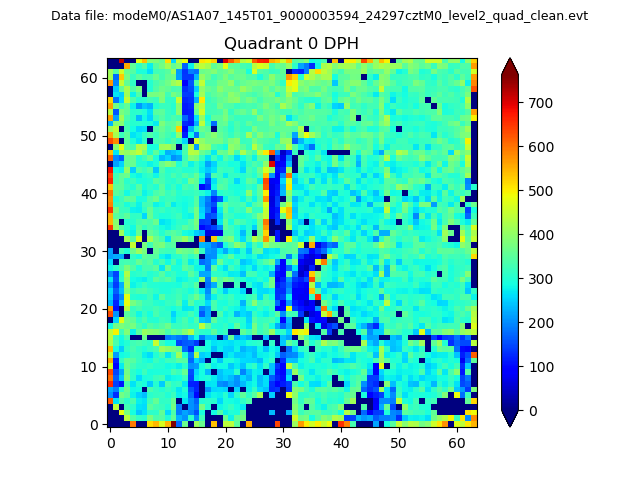 |
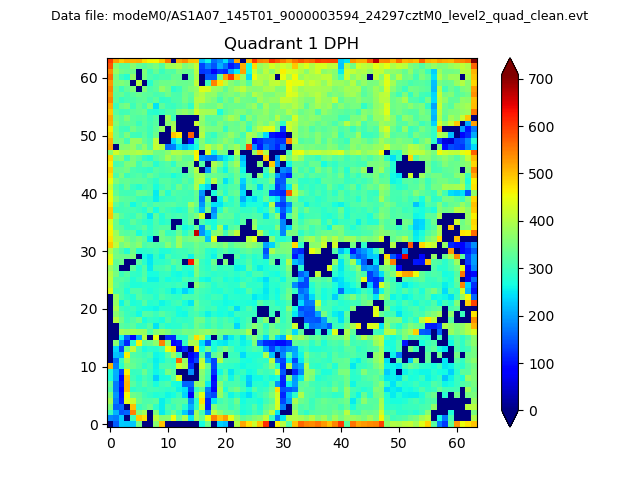 |
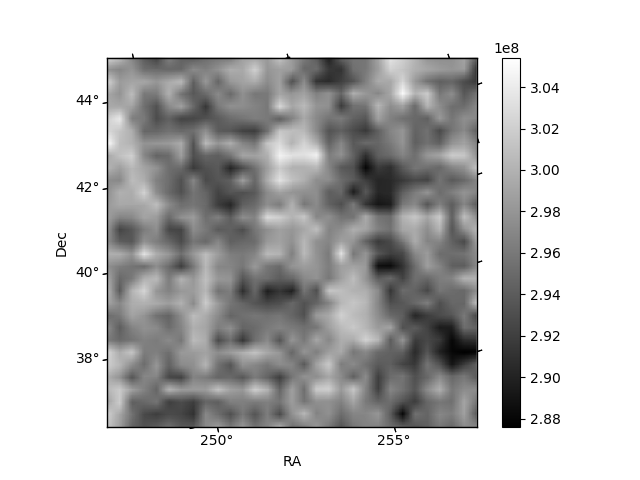
Quadrant B |
|---|---|---|---|
| Quadrant D | 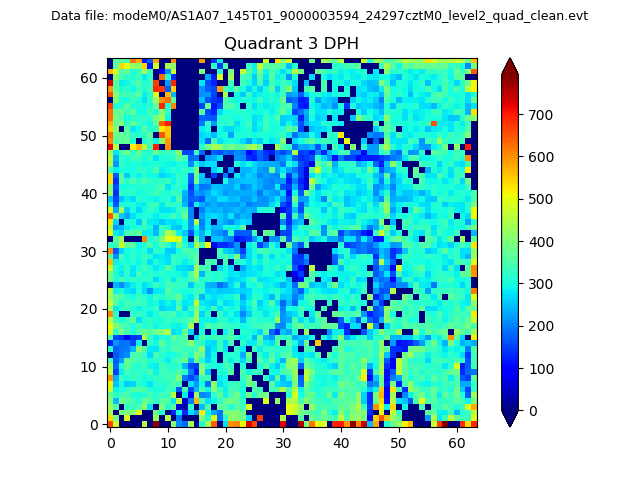 |
 |
Quadrant C |
| Plot type | Count rate plots | Images |
|---|---|---|
| Comparison with Poisson distribution Blue bars denote a histogram of data divided into 1 sec bins. Red curve is a Poisson curve with rate = median count rate of data. |
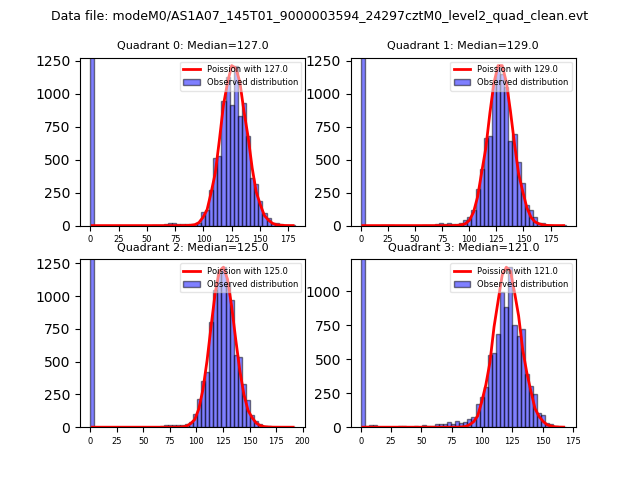 |
 |
| Quadrant-wise count rates Data is divided into 100 sec bins |
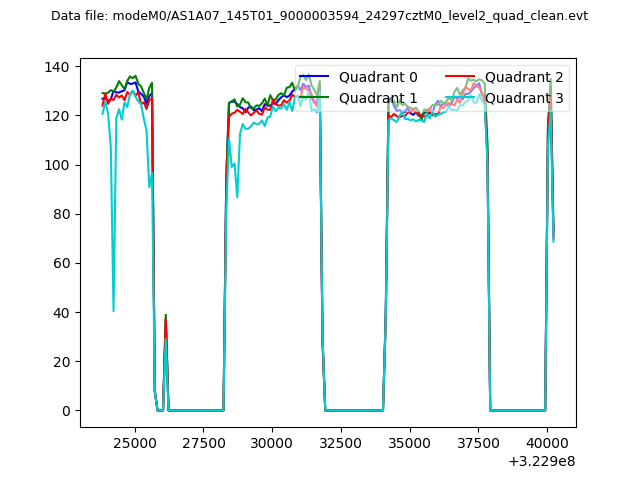 |
|
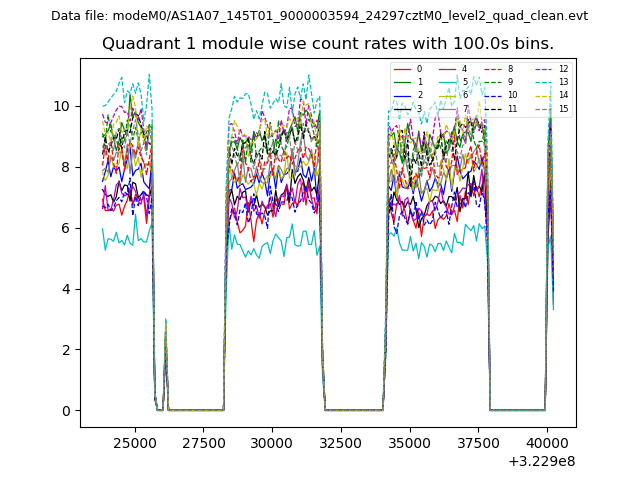
| Module-wise count rates for Quadrant A Data is divided into 100 sec bins |
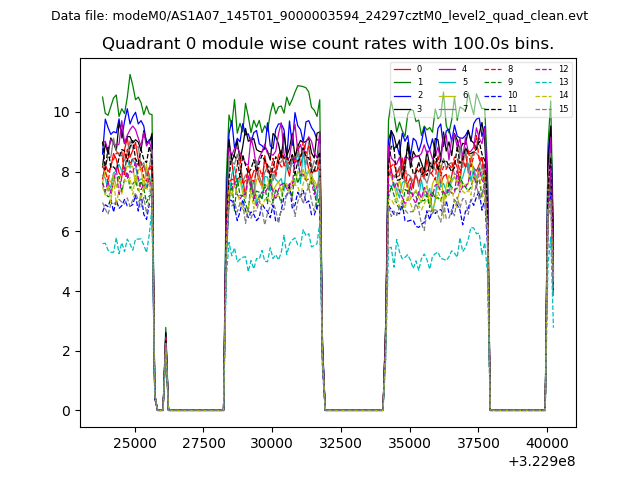 |
 |
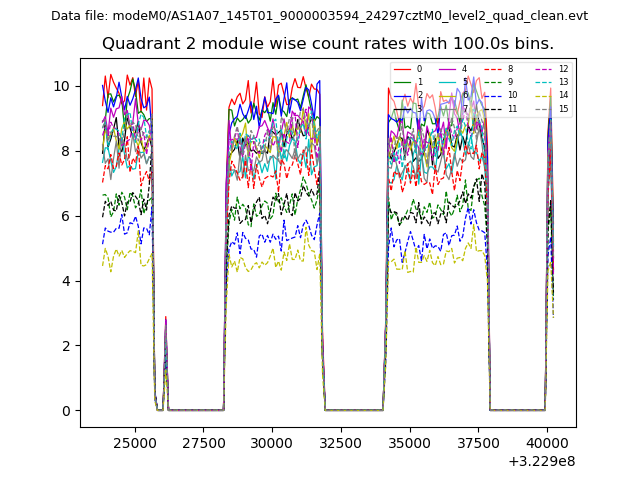
| Module-wise count rates for Quadrant B Data is divided into 100 sec bins |
 |
 |
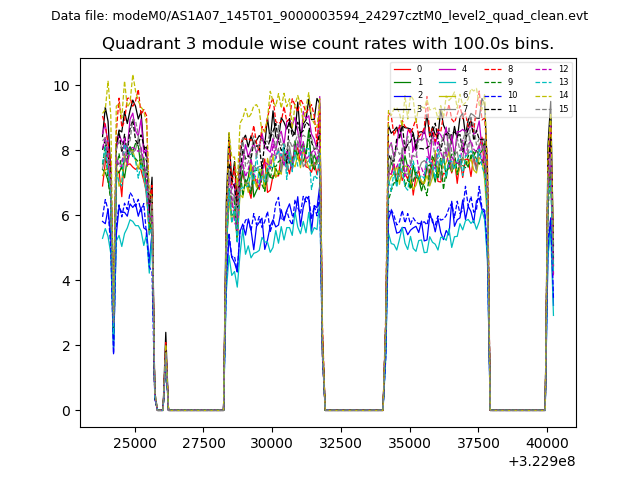
| Module-wise count rates for Quadrant C Data is divided into 100 sec bins |
 |
 |
| Module-wise count rates for Quadrant D Data is divided into 100 sec bins |
 |
 |
| Parameter | Plot |
|---|---|
| CZT HV Monitor | 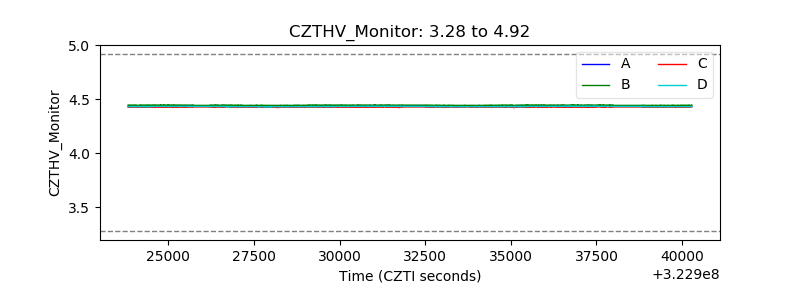 |
| D_VDD | 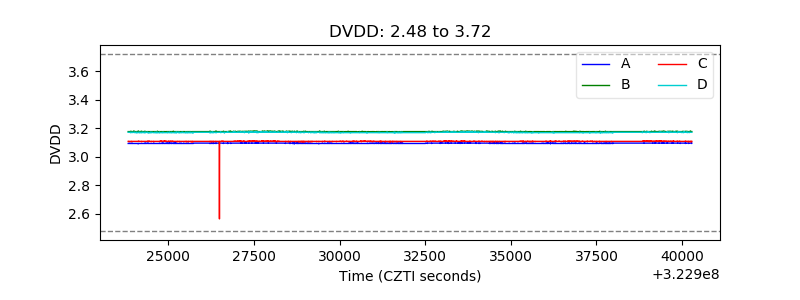 |
| Temperature 1 | 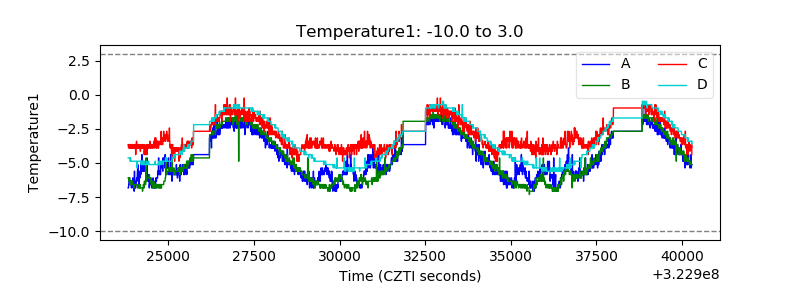 |
| Veto HV Monitor | 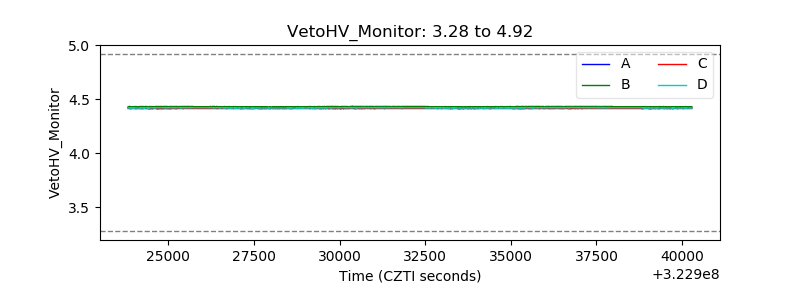 |
| Veto LLD | 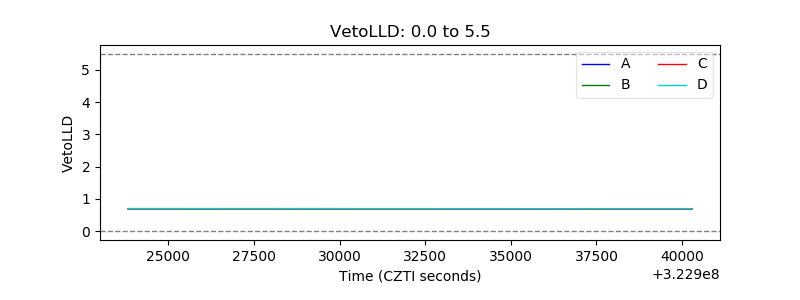 |
| Alpha Counter | 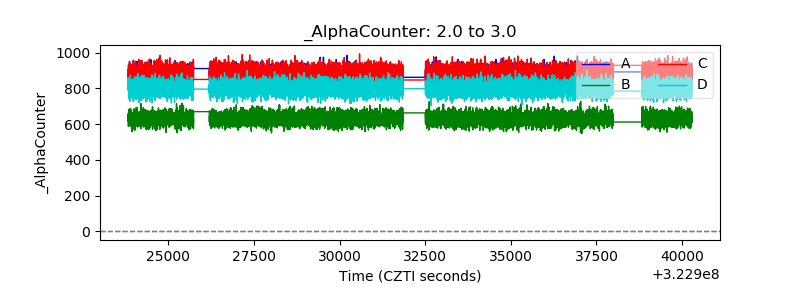 |
| _CPM_Rate | 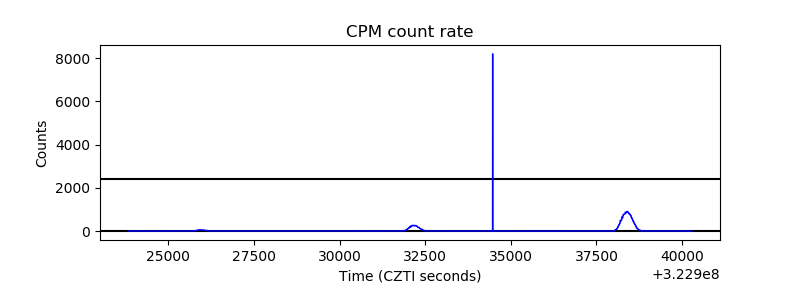 |
| CZT Counter | 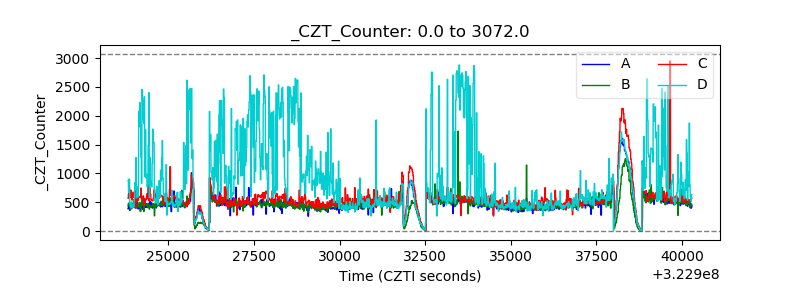 |
| +2.5 Volts monitor | 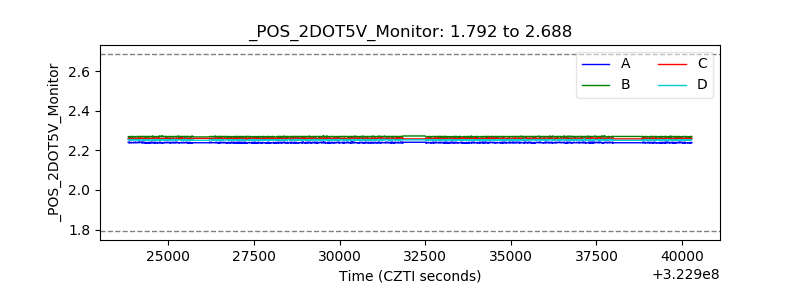 |
| +5 Volts monitor | 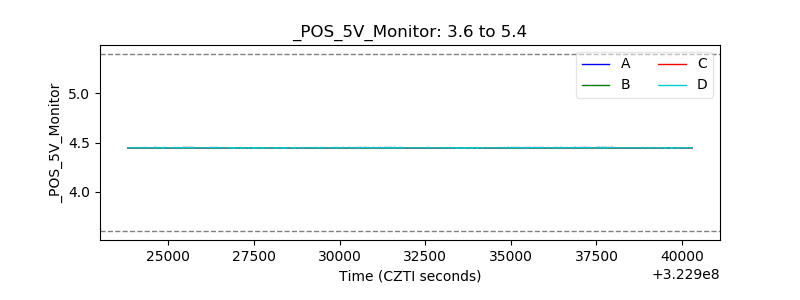 |
| _ROLL_ROT | 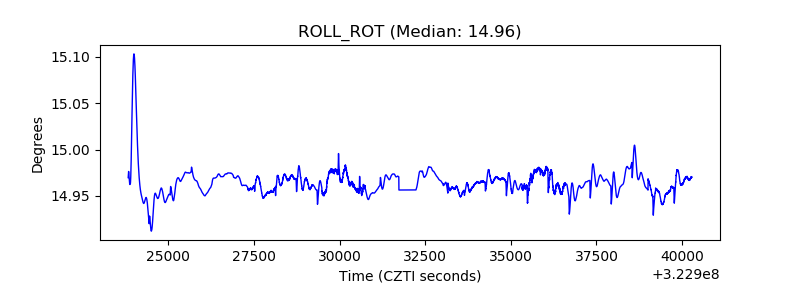 |
| _Roll_DEC | 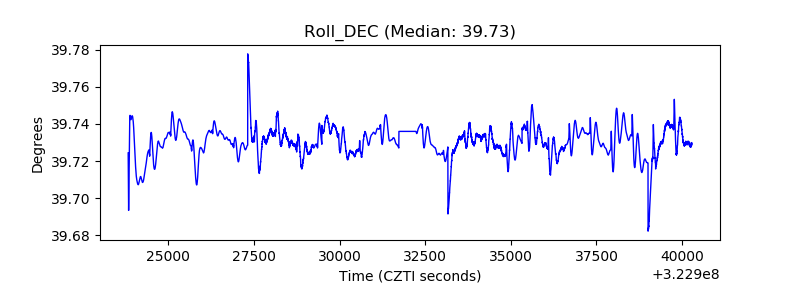 |
| _Roll_RA | 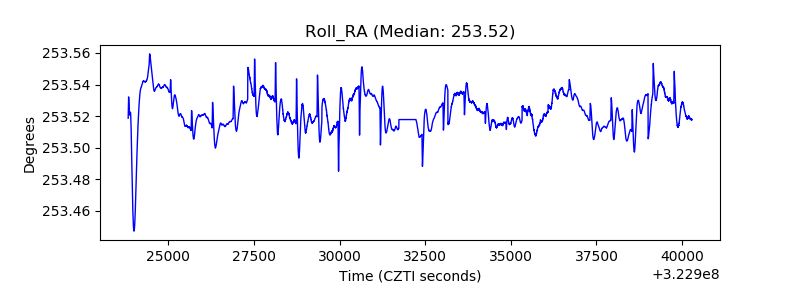 |
| Veto Counter | 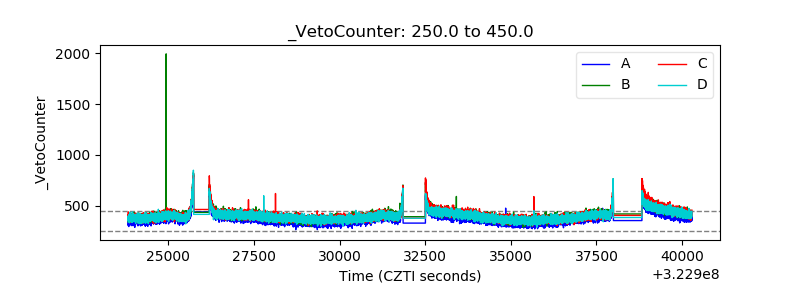 |