| Param | Original file | Final file |
|---|---|---|
| Filename | modeM0/AS1A07_145T01_9000003594_24298cztM0_level2.evt | modeM0/AS1A07_145T01_9000003594_24298cztM0_level2_quad_clean.evt |
| Size (bytes) | 537,589,440 | 89,196,480 |
| Size | 512.7 MB | 85.1 MB |
| Events in quadrant A | 3,318,058 | 560,094 |
| Events in quadrant B | 3,393,565 | 573,954 |
| Events in quadrant C | 3,788,917 | 555,045 |
| Events in quadrant D | 5,318,457 | 537,403 |
| Mode M0 | |||
|---|---|---|---|
| Quadrant | BADHDUFLAG | Total packets | Discarded packets |
| A | 0 | 14278 | 2 |
| B | 0 | 14480 | 2 |
| C | 0 | 15603 | 3 |
| D | 0 | 20539 | 2 |
| Mode M9 | |||
|---|---|---|---|
| Quadrant | BADHDUFLAG | Total packets | Discarded packets |
| A | 0 | 18 | 0 |
| B | 0 | 18 | 0 |
| C | 0 | 18 | 0 |
| D | 0 | 18 | 0 |
| Mode SS | |||
|---|---|---|---|
| Quadrant | BADHDUFLAG | Total packets | Discarded packets |
| A | 0 | 142 | 0 |
| B | 0 | 142 | 0 |
| C | 0 | 142 | 0 |
| D | 0 | 142 | 0 |
| Quadrant | Total seconds | Saturated seconds | Saturation percentage |
|---|---|---|---|
| A | 6806 | 56 | 0.822803% |
| B | 6807 | 76 | 1.116498% |
| C | 6806 | 130 | 1.910079% |
| D | 6806 | 403 | 5.921246% |
Noise dominated data is calculated using 1-second bins in cleaned event files. If a bin has >2000 counts, and if more than 50% of those come from <1% of pixels, then it is considered to be noise-dominated and hence unusable.
| Quadrant | # 1 sec bins | Bins with >0 counts | Bins with >2000 counts | High rate bins dominated by noise | Noise dominated (total time) | Noise dominated (detector-on time) | Marked lightcurve |
|---|---|---|---|---|---|---|---|
| A | 8646 | 6806 | 0 | 0 | 0.00% | 0.00% | 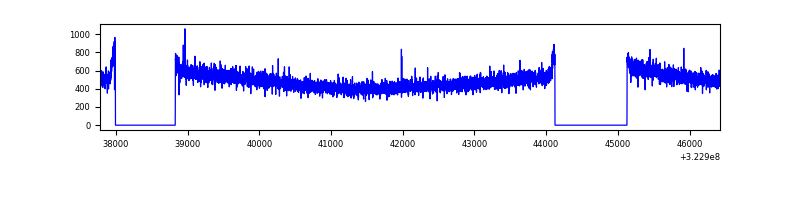 |
| B | 8647 | 6807 | 3 | 3 | 0.03% | 0.04% | 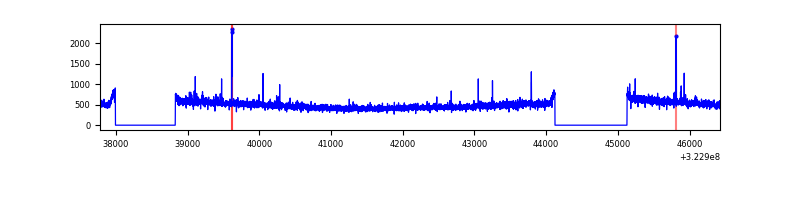 |
| C | 8646 | 6806 | 15 | 15 | 0.17% | 0.22% | 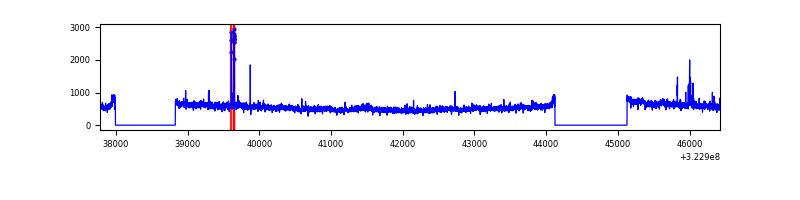 |
| D | 8646 | 6806 | 229 | 229 | 2.65% | 3.36% | 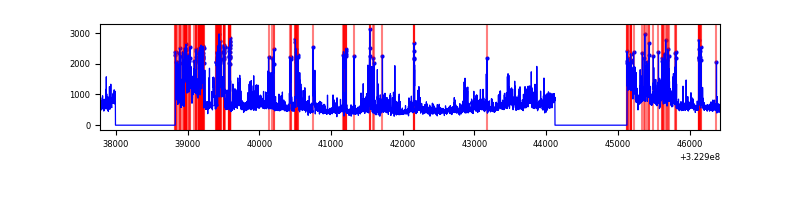 |
Top three noisy pixels from each quadrant. If the there are fewer than three noisy pixels in the level2.evt file, extra rows are filled as -1
| Pixel properties | Quadrant properties | ||||||
|---|---|---|---|---|---|---|---|
| Quadrant | DetID | PixID | Counts | Sigma | Mean | Median | Sigma |
| A | 13 | 254 | 10907 | 58.23 | 859 | 841 | 172.9 |
| A | 3 | 137 | 7717 | 39.78 | 859 | 841 | 172.9 |
| A | 0 | 226 | 7228 | 36.95 | 859 | 841 | 172.9 |
| B | 12 | 111 | 19523 | 113.58 | 856 | 836 | 164.5 |
| B | 11 | 111 | 17841 | 103.36 | 856 | 836 | 164.5 |
| B | 5 | 32 | 15213 | 87.38 | 856 | 836 | 164.5 |
| C | 7 | 247 | 329673 | 1693.27 | 829 | 835 | 194.2 |
| C | 14 | 238 | 131325 | 671.93 | 829 | 835 | 194.2 |
| C | 2 | 16 | 90965 | 464.1 | 829 | 835 | 194.2 |
| D | 1 | 52 | 1150053 | 5680.41 | 829 | 804 | 202.3 |
| D | 8 | 195 | 780919 | 3855.88 | 829 | 804 | 202.3 |
| D | 12 | 233 | 166582 | 819.39 | 829 | 804 | 202.3 |
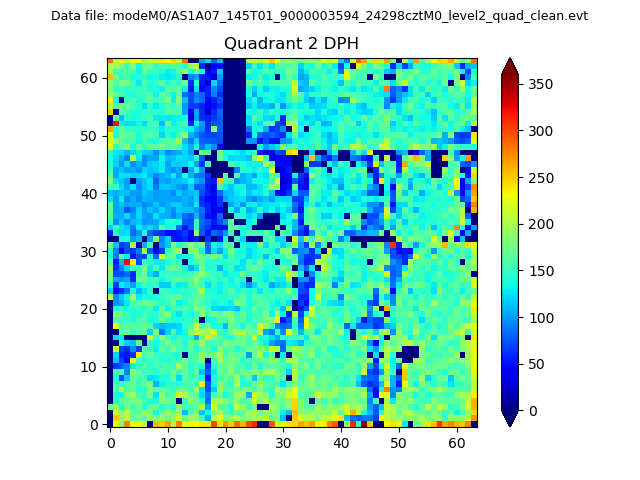
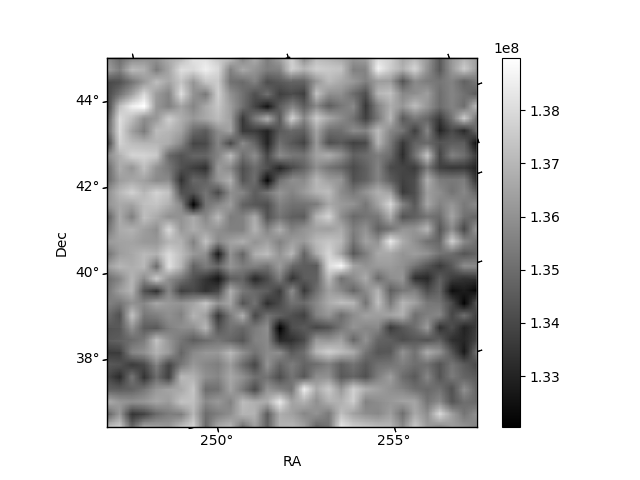
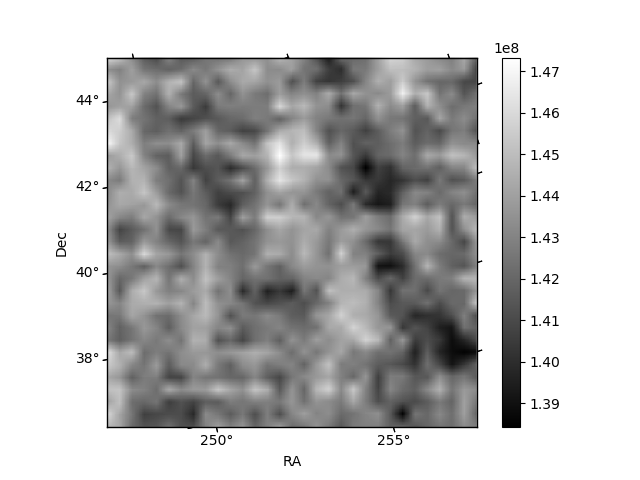
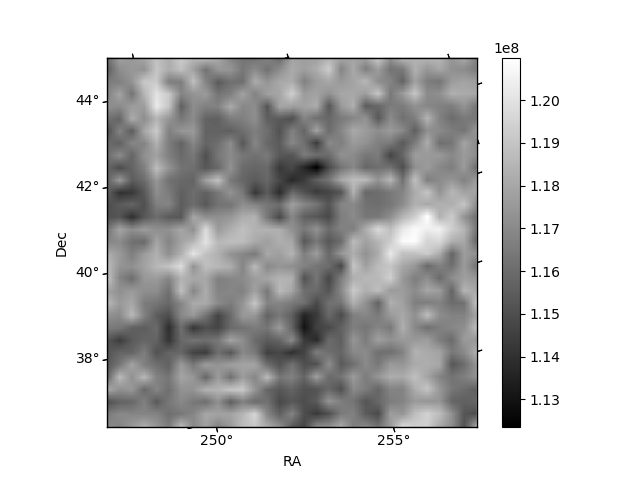
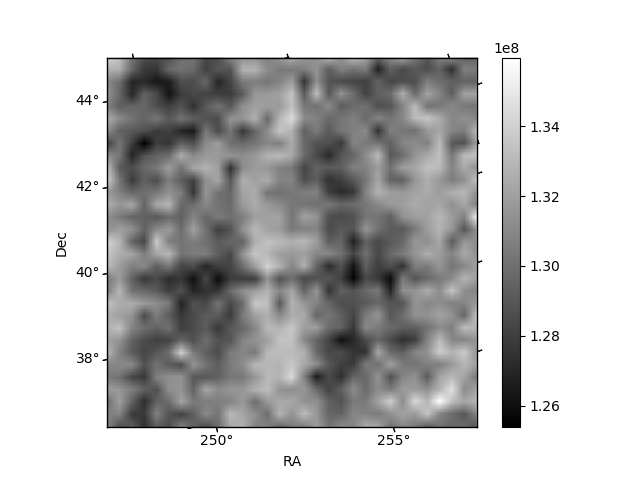
Histogram calculated using DETX and DETY for each event in the final _common_clean file
| Quadrant A | 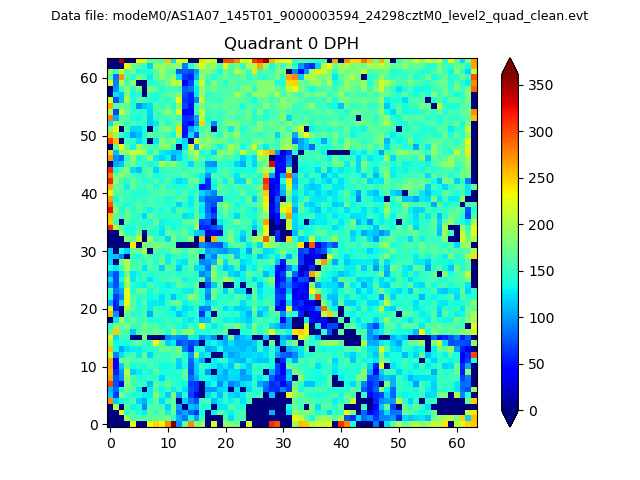 |
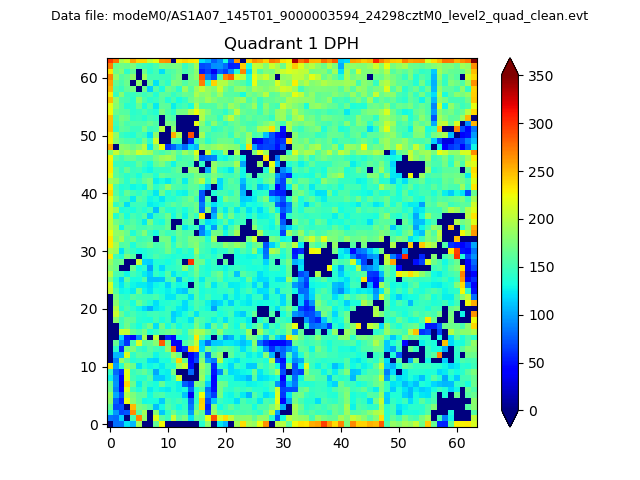 |
Quadrant B |
|---|---|---|---|
| Quadrant D | 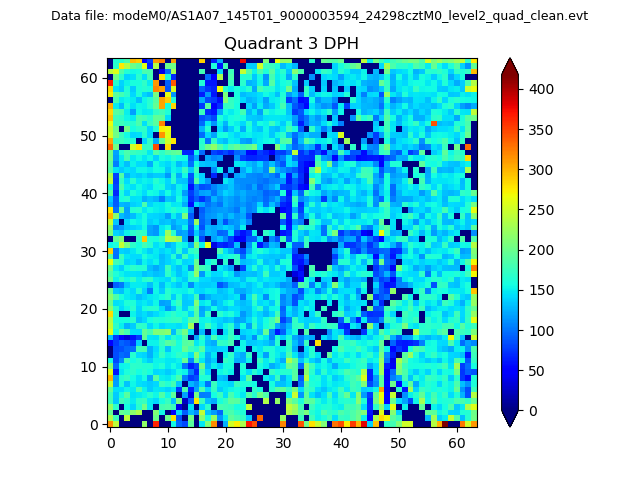 |
 |
Quadrant C |
| Plot type | Count rate plots | Images |
|---|---|---|
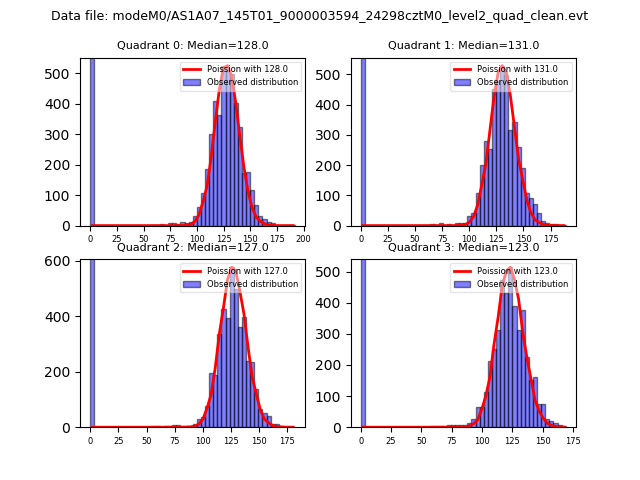
| Comparison with Poisson distribution Blue bars denote a histogram of data divided into 1 sec bins. Red curve is a Poisson curve with rate = median count rate of data. |
 |
 |
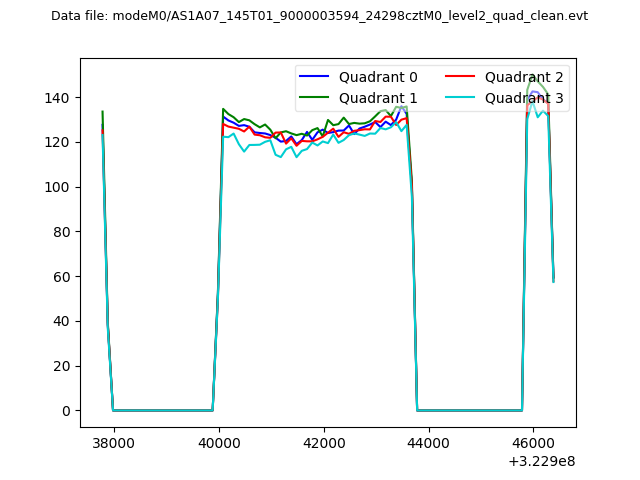
| Quadrant-wise count rates Data is divided into 100 sec bins |
 |
|
| Module-wise count rates for Quadrant A Data is divided into 100 sec bins |
 |
 |
| Module-wise count rates for Quadrant B Data is divided into 100 sec bins |
 |
 |
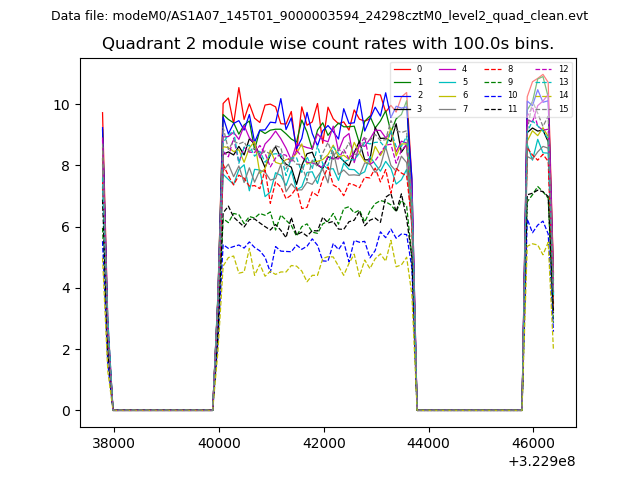
| Module-wise count rates for Quadrant C Data is divided into 100 sec bins |
 |
 |
| Module-wise count rates for Quadrant D Data is divided into 100 sec bins |
 |
 |
| Parameter | Plot |
|---|---|
| CZT HV Monitor | 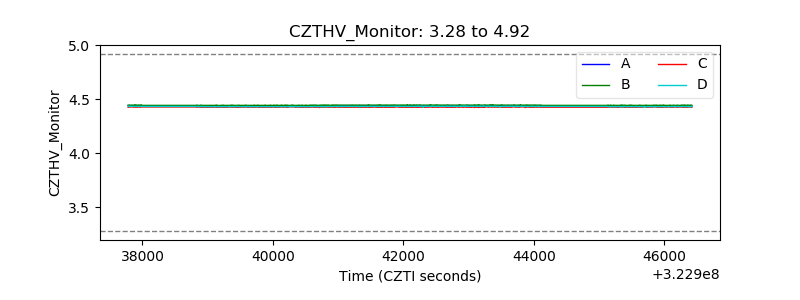 |
| D_VDD | 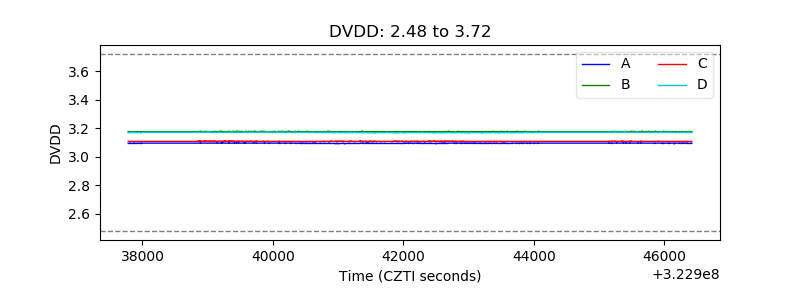 |
| Temperature 1 | 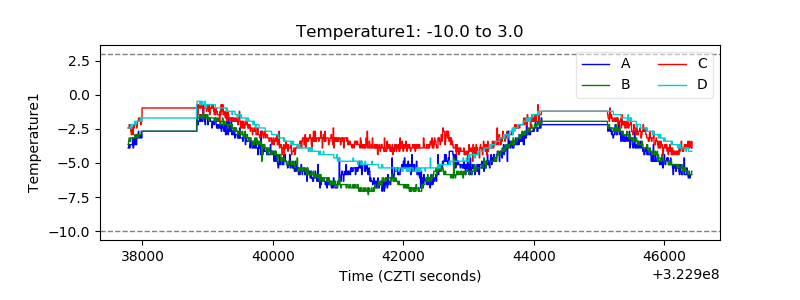 |
| Veto HV Monitor |  |
| Veto LLD | 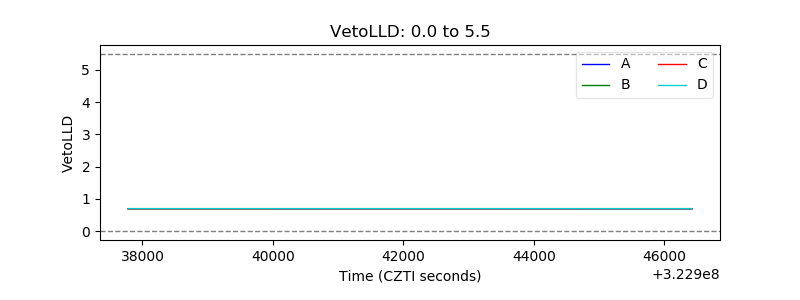 |
| Alpha Counter | 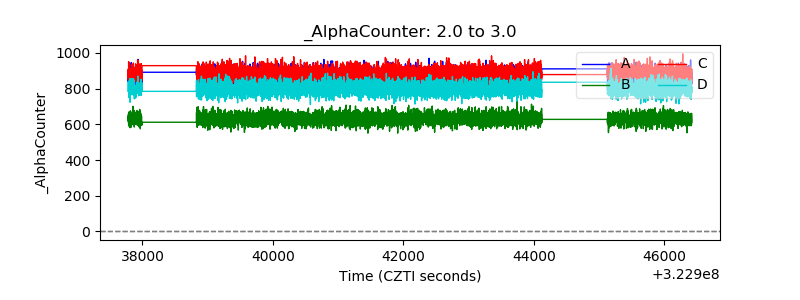 |
| _CPM_Rate | 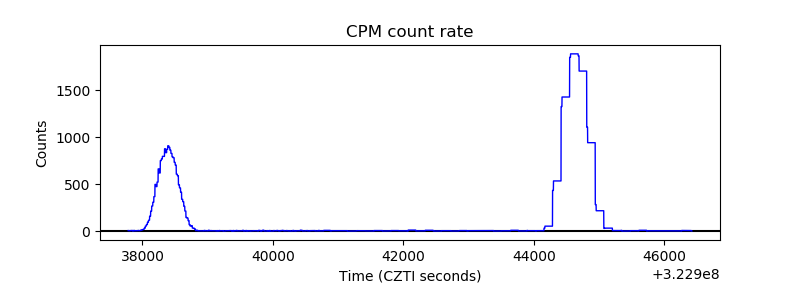 |
| CZT Counter |  |
| +2.5 Volts monitor |  |
| +5 Volts monitor |  |
| _ROLL_ROT | 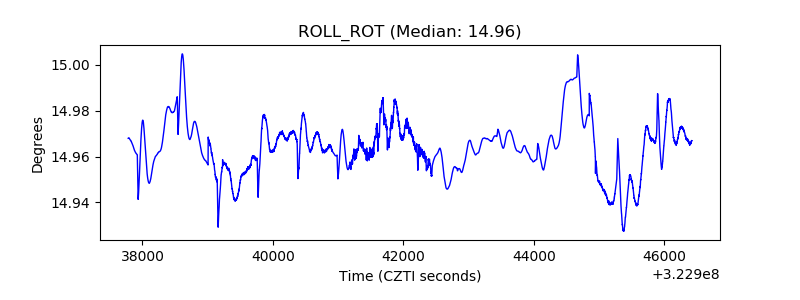 |
| _Roll_DEC |  |
| _Roll_RA |  |
| Veto Counter |  |