| Param | Original file | Final file |
|---|---|---|
| Filename | modeM0/AS1A07_145T01_9000003594_24300cztM0_level2.evt | modeM0/AS1A07_145T01_9000003594_24300cztM0_level2_quad_clean.evt |
| Size (bytes) | 522,279,360 | 98,398,080 |
| Size | 498.1 MB | 93.8 MB |
| Events in quadrant A | 3,329,735 | 628,170 |
| Events in quadrant B | 3,429,064 | 647,821 |
| Events in quadrant C | 4,078,041 | 625,938 |
| Events in quadrant D | 4,521,997 | 607,054 |
| Mode M0 | |||
|---|---|---|---|
| Quadrant | BADHDUFLAG | Total packets | Discarded packets |
| A | 0 | 14347 | 2 |
| B | 0 | 14648 | 2 |
| C | 0 | 16781 | 2 |
| D | 0 | 18095 | 2 |
| Mode M9 | |||
|---|---|---|---|
| Quadrant | BADHDUFLAG | Total packets | Discarded packets |
| A | 0 | 22 | 0 |
| B | 0 | 22 | 0 |
| C | 0 | 22 | 0 |
| D | 0 | 22 | 0 |
| Mode SS | |||
|---|---|---|---|
| Quadrant | BADHDUFLAG | Total packets | Discarded packets |
| A | 0 | 138 | 0 |
| B | 0 | 138 | 0 |
| C | 0 | 138 | 0 |
| D | 0 | 138 | 0 |
| Quadrant | Total seconds | Saturated seconds | Saturation percentage |
|---|---|---|---|
| A | 6762 | 48 | 0.709849% |
| B | 6763 | 66 | 0.975898% |
| C | 6763 | 151 | 2.232737% |
| D | 6763 | 178 | 2.631968% |
Noise dominated data is calculated using 1-second bins in cleaned event files. If a bin has >2000 counts, and if more than 50% of those come from <1% of pixels, then it is considered to be noise-dominated and hence unusable.
| Quadrant | # 1 sec bins | Bins with >0 counts | Bins with >2000 counts | High rate bins dominated by noise | Noise dominated (total time) | Noise dominated (detector-on time) | Marked lightcurve |
|---|---|---|---|---|---|---|---|
| A | 8922 | 6762 | 0 | 0 | 0.00% | 0.00% | 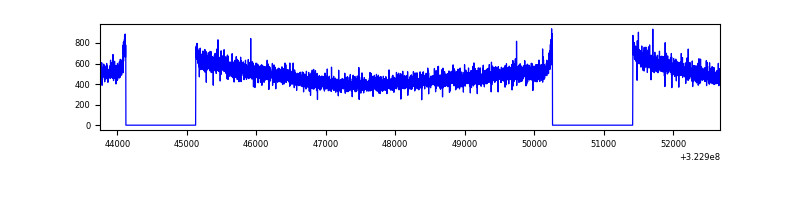 |
| B | 8923 | 6763 | 1 | 1 | 0.01% | 0.01% | 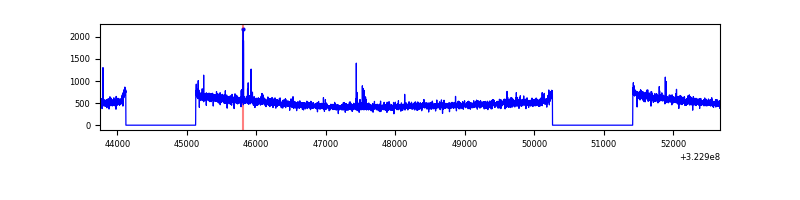 |
| C | 8923 | 6763 | 24 | 24 | 0.27% | 0.35% | 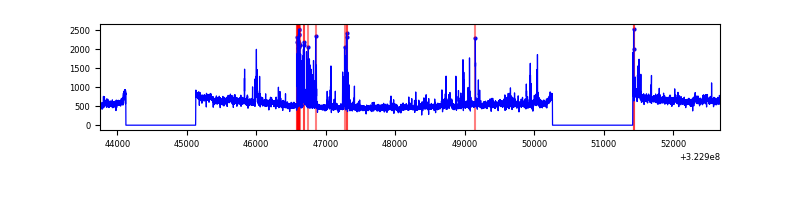 |
| D | 8923 | 6763 | 64 | 64 | 0.72% | 0.95% | 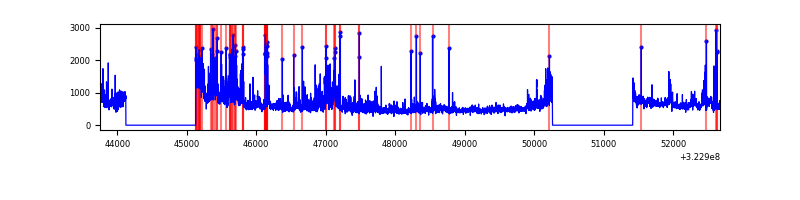 |
Top three noisy pixels from each quadrant. If the there are fewer than three noisy pixels in the level2.evt file, extra rows are filled as -1
| Pixel properties | Quadrant properties | ||||||
|---|---|---|---|---|---|---|---|
| Quadrant | DetID | PixID | Counts | Sigma | Mean | Median | Sigma |
| A | 13 | 254 | 10890 | 58.35 | 862 | 843 | 172.2 |
| A | 3 | 137 | 7730 | 40.0 | 862 | 843 | 172.2 |
| A | 0 | 226 | 7437 | 38.3 | 862 | 843 | 172.2 |
| B | 0 | 230 | 20111 | 116.33 | 867 | 845 | 165.6 |
| B | 12 | 111 | 19759 | 114.2 | 867 | 845 | 165.6 |
| B | 11 | 111 | 17677 | 101.63 | 867 | 845 | 165.6 |
| C | 7 | 247 | 340162 | 1720.8 | 843 | 851 | 197.2 |
| C | 2 | 16 | 306315 | 1549.14 | 843 | 851 | 197.2 |
| C | 14 | 238 | 134858 | 679.61 | 843 | 851 | 197.2 |
| D | 8 | 195 | 789180 | 3855.98 | 844 | 819 | 204.5 |
| D | 1 | 52 | 358511 | 1749.52 | 844 | 819 | 204.5 |
| D | 12 | 233 | 107922 | 523.85 | 844 | 819 | 204.5 |
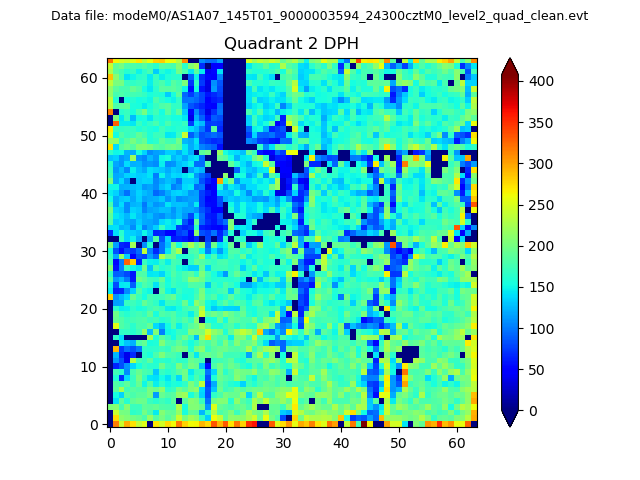
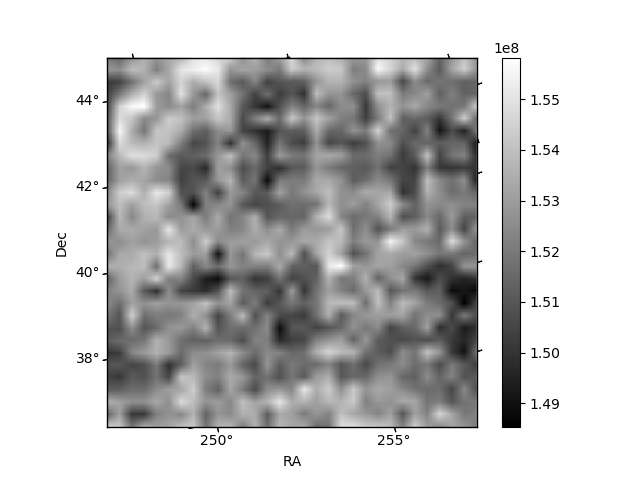
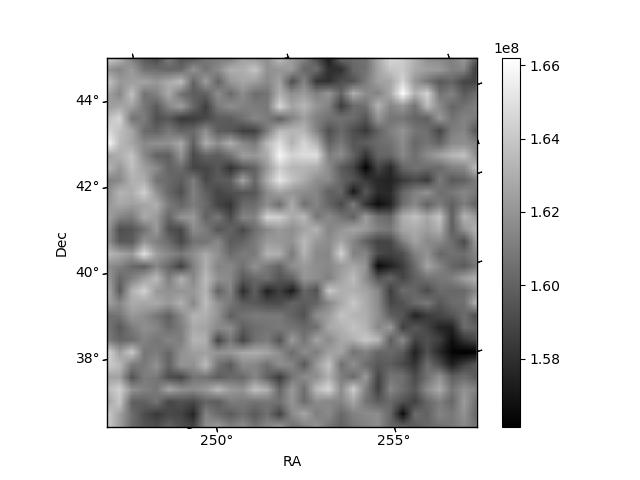
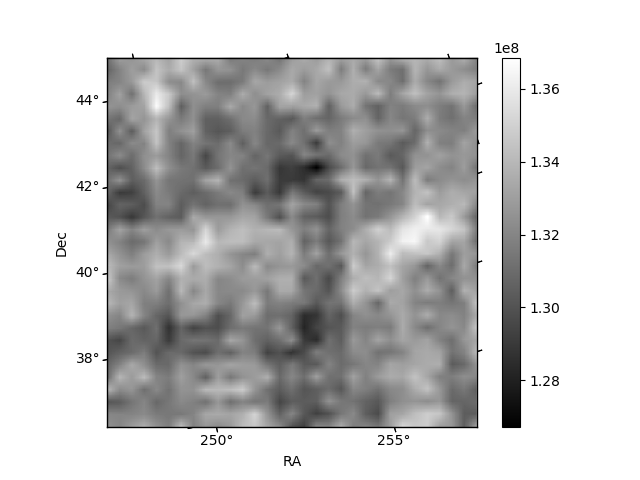
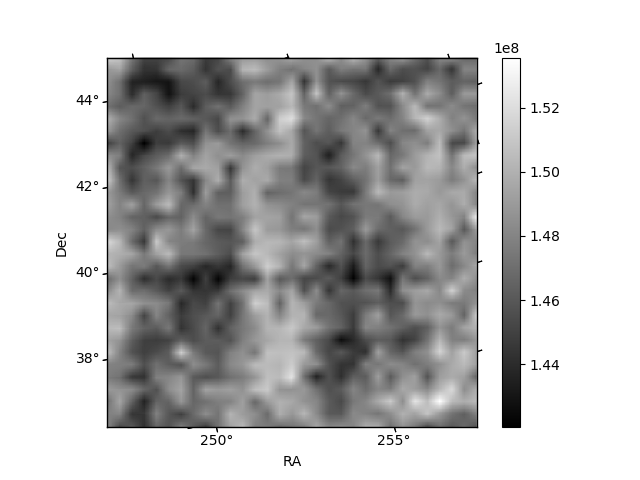
Histogram calculated using DETX and DETY for each event in the final _common_clean file
| Quadrant A | 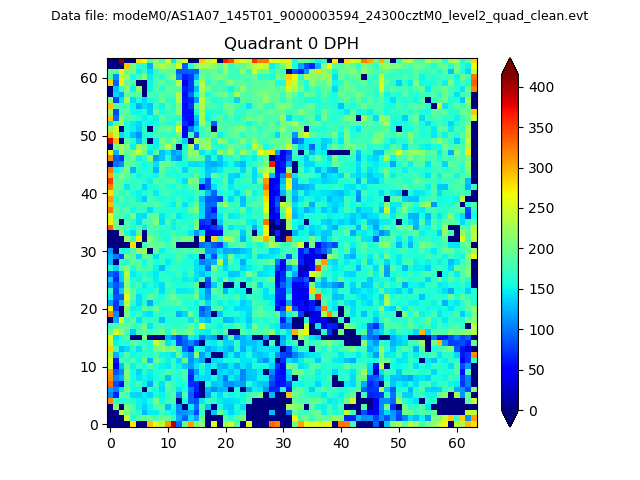 |
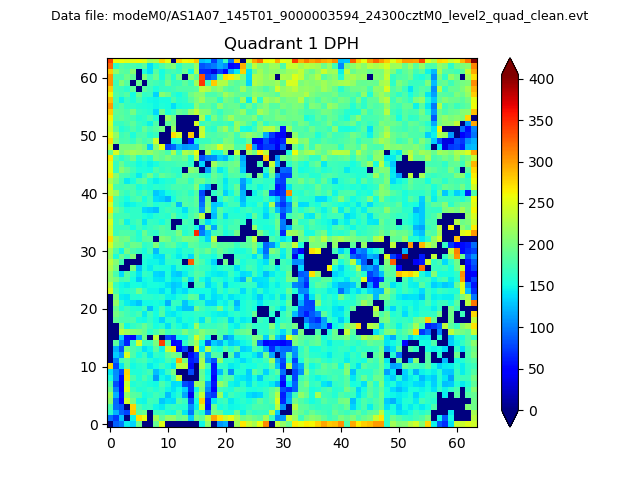 |
Quadrant B |
|---|---|---|---|
| Quadrant D | 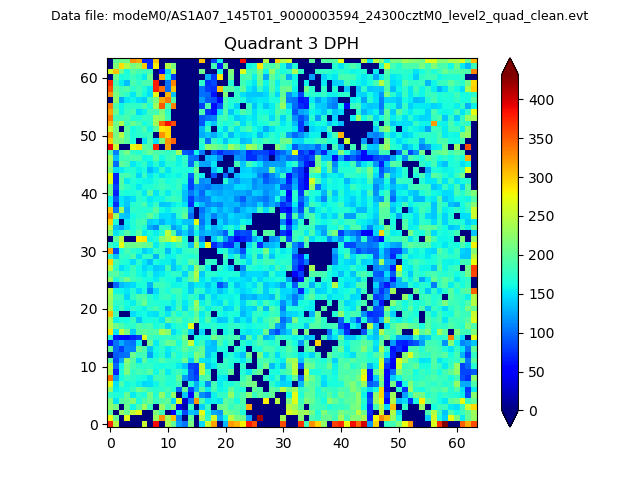 |
 |
Quadrant C |
| Plot type | Count rate plots | Images |
|---|---|---|
| Comparison with Poisson distribution Blue bars denote a histogram of data divided into 1 sec bins. Red curve is a Poisson curve with rate = median count rate of data. |
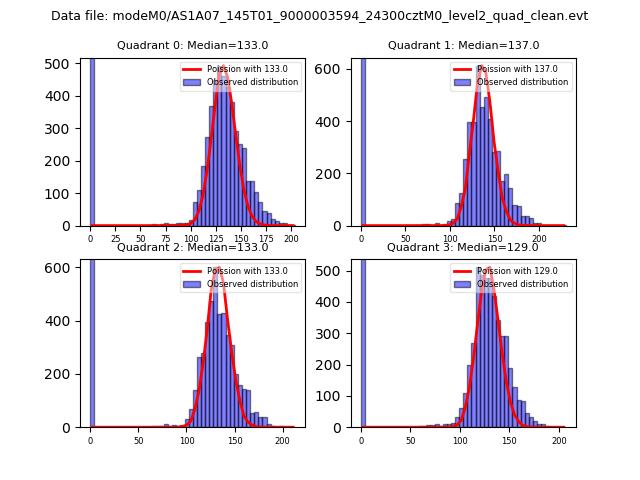 |
 |
| Quadrant-wise count rates Data is divided into 100 sec bins |
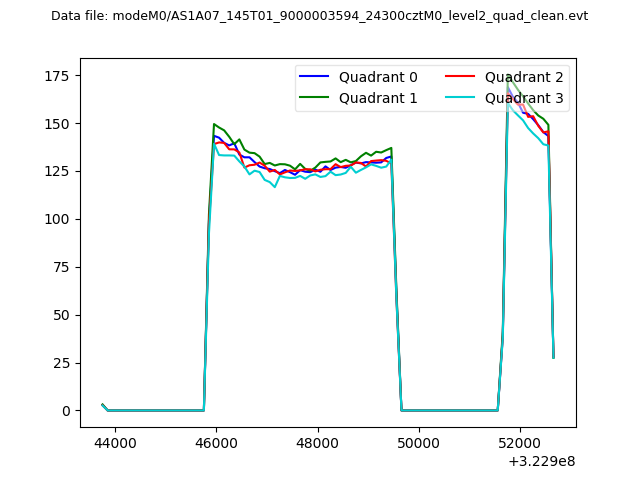 |
|
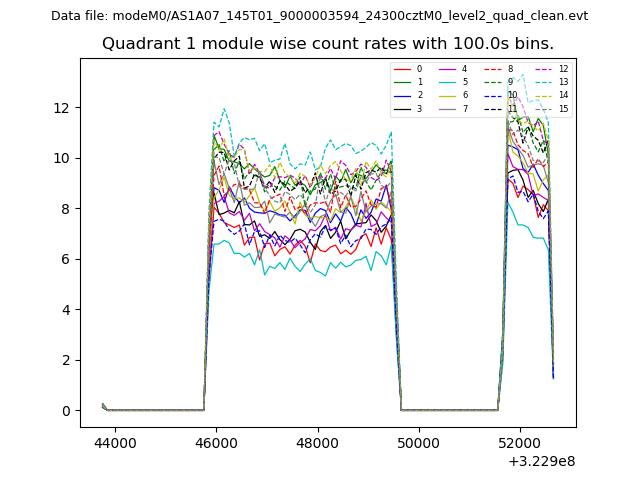
| Module-wise count rates for Quadrant A Data is divided into 100 sec bins |
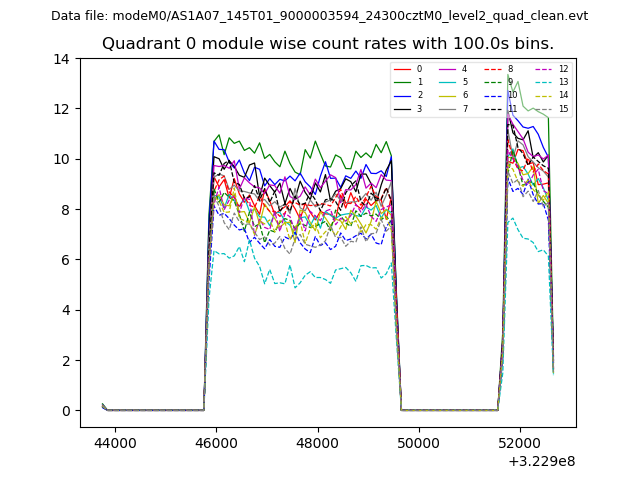 |
 |
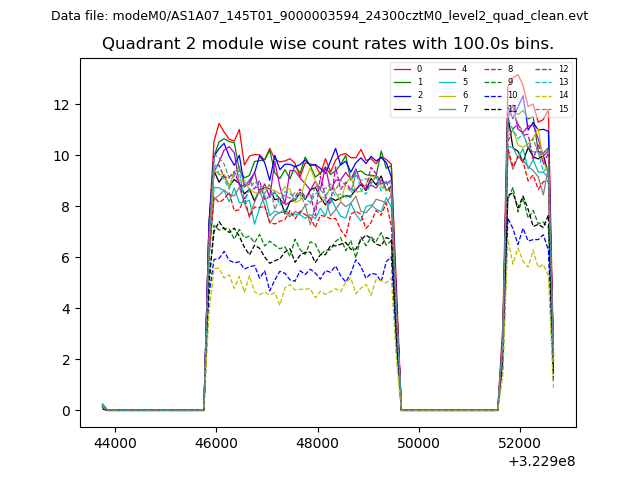
| Module-wise count rates for Quadrant B Data is divided into 100 sec bins |
 |
 |
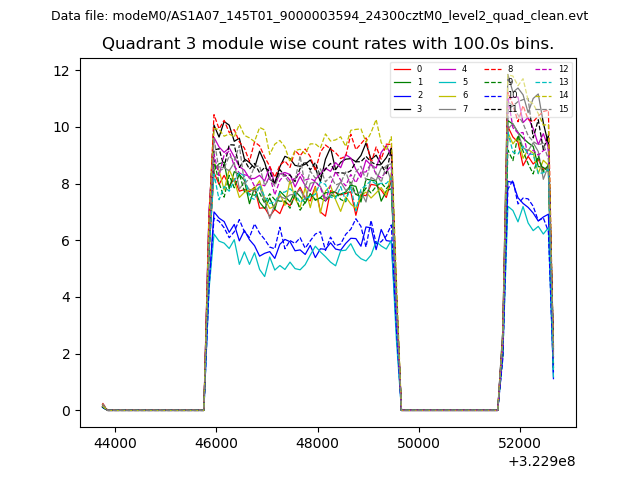
| Module-wise count rates for Quadrant C Data is divided into 100 sec bins |
 |
 |
| Module-wise count rates for Quadrant D Data is divided into 100 sec bins |
 |
 |
| Parameter | Plot |
|---|---|
| CZT HV Monitor | 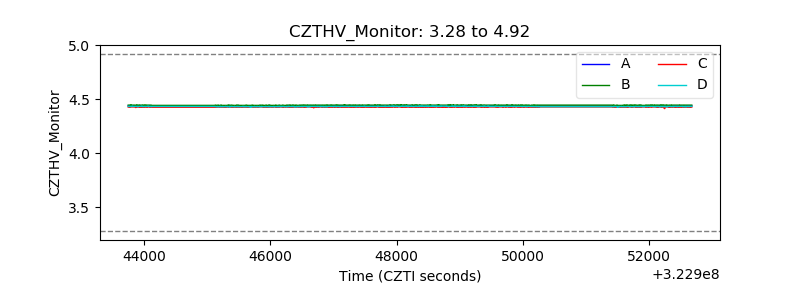 |
| D_VDD | 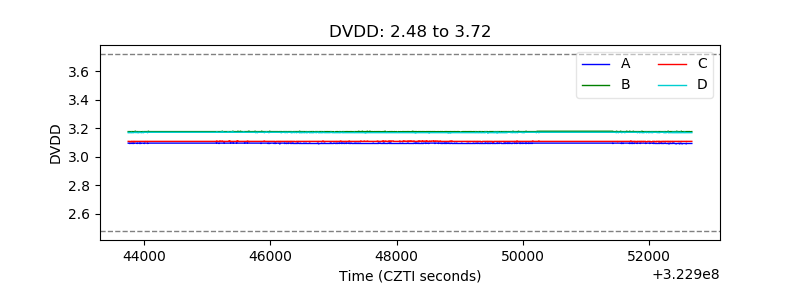 |
| Temperature 1 | 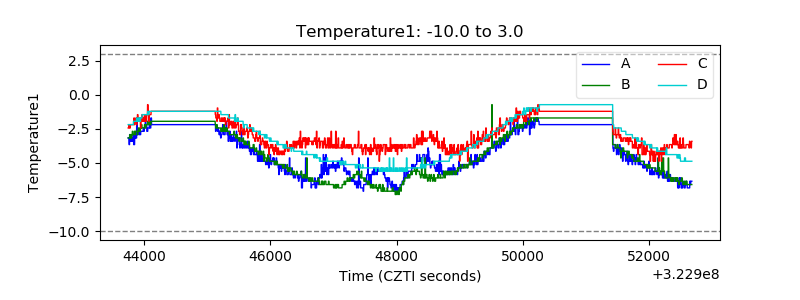 |
| Veto HV Monitor |  |
| Veto LLD | 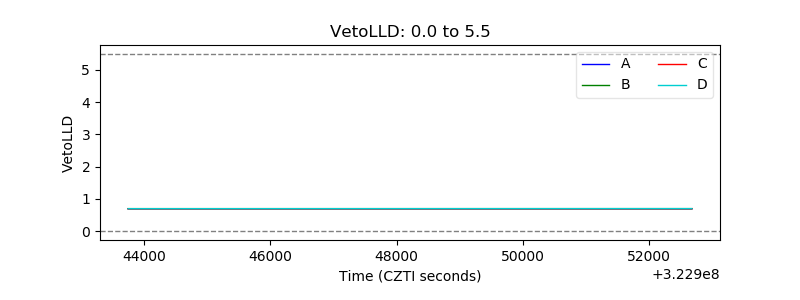 |
| Alpha Counter | 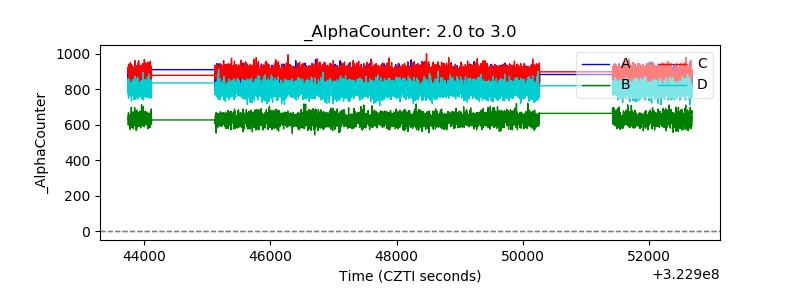 |
| _CPM_Rate | 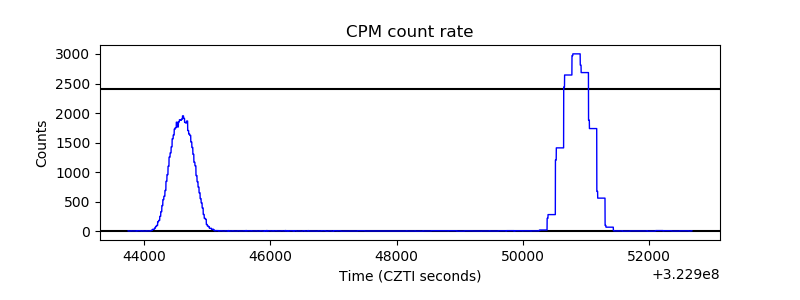 |
| CZT Counter | 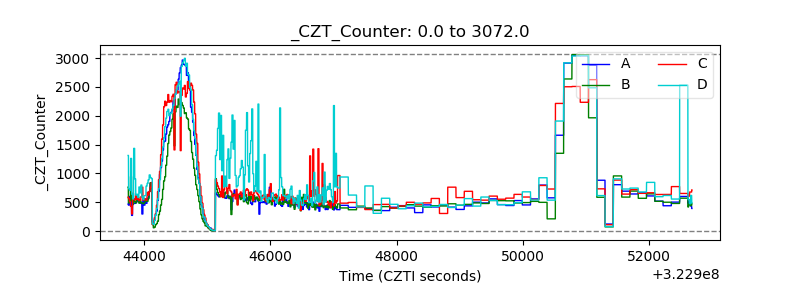 |
| +2.5 Volts monitor |  |
| +5 Volts monitor |  |
| _ROLL_ROT | 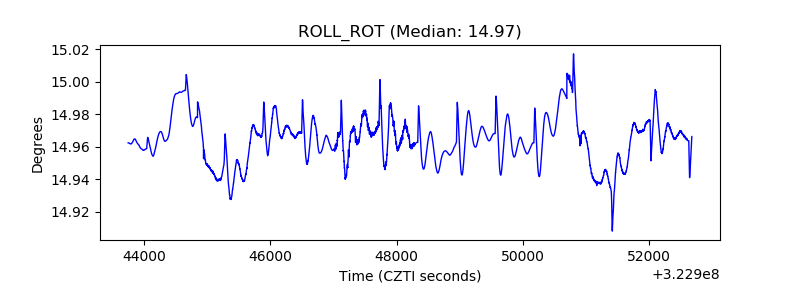 |
| _Roll_DEC | 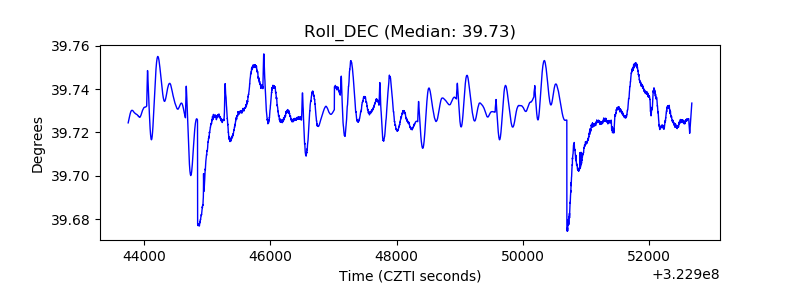 |
| _Roll_RA | 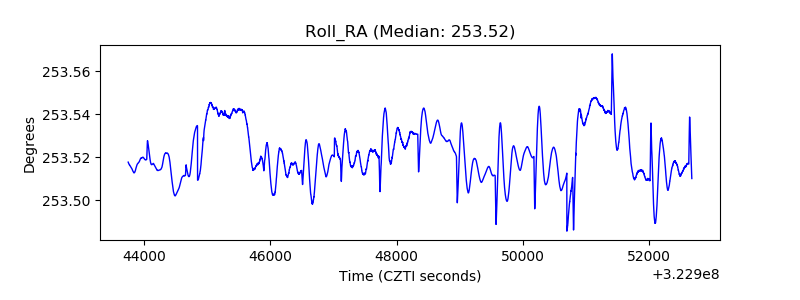 |
| Veto Counter | 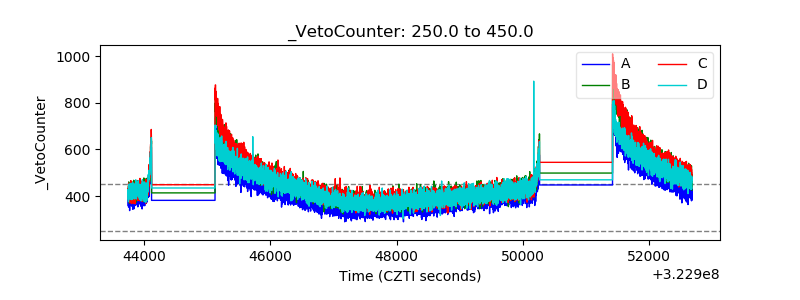 |