| Param | Original file | Final file |
|---|---|---|
| Filename | modeM0/AS1A07_145T01_9000003594_24302cztM0_level2.evt | modeM0/AS1A07_145T01_9000003594_24302cztM0_level2_quad_clean.evt |
| Size (bytes) | 549,201,600 | 112,461,120 |
| Size | 523.8 MB | 107.3 MB |
| Events in quadrant A | 3,159,190 | 753,099 |
| Events in quadrant B | 3,275,138 | 789,279 |
| Events in quadrant C | 4,366,982 | 735,796 |
| Events in quadrant D | 5,410,596 | 694,348 |
| Mode M0 | |||
|---|---|---|---|
| Quadrant | BADHDUFLAG | Total packets | Discarded packets |
| A | 0 | 13281 | 2 |
| B | 0 | 13652 | 2 |
| C | 0 | 17183 | 4 |
| D | 0 | 20228 | 2 |
| Mode M9 | |||
|---|---|---|---|
| Quadrant | BADHDUFLAG | Total packets | Discarded packets |
| A | 0 | 15 | 0 |
| B | 0 | 16 | 0 |
| C | 0 | 16 | 0 |
| D | 0 | 16 | 0 |
| Mode SS | |||
|---|---|---|---|
| Quadrant | BADHDUFLAG | Total packets | Discarded packets |
| A | 0 | 128 | 0 |
| B | 0 | 128 | 0 |
| C | 0 | 128 | 0 |
| D | 0 | 128 | 0 |
| Quadrant | Total seconds | Saturated seconds | Saturation percentage |
|---|---|---|---|
| A | 6202 | 41 | 0.661077% |
| B | 6202 | 61 | 0.983554% |
| C | 6201 | 346 | 5.579745% |
| D | 6201 | 561 | 9.046928% |
Noise dominated data is calculated using 1-second bins in cleaned event files. If a bin has >2000 counts, and if more than 50% of those come from <1% of pixels, then it is considered to be noise-dominated and hence unusable.
| Quadrant | # 1 sec bins | Bins with >0 counts | Bins with >2000 counts | High rate bins dominated by noise | Noise dominated (total time) | Noise dominated (detector-on time) | Marked lightcurve |
|---|---|---|---|---|---|---|---|
| A | 7517 | 6203 | 0 | 0 | 0.00% | 0.00% |  |
| B | 7517 | 6202 | 2 | 2 | 0.03% | 0.03% |  |
| C | 7516 | 6201 | 145 | 145 | 1.93% | 2.34% |  |
| D | 7516 | 6201 | 493 | 493 | 6.56% | 7.95% | 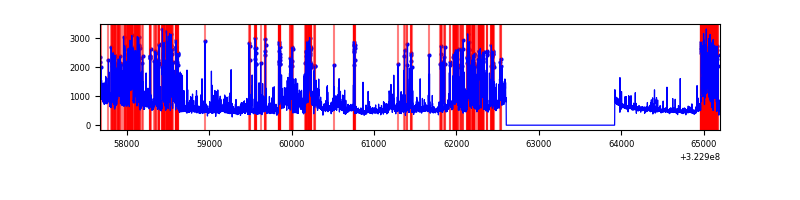 |
Top three noisy pixels from each quadrant. If the there are fewer than three noisy pixels in the level2.evt file, extra rows are filled as -1
| Pixel properties | Quadrant properties | ||||||
|---|---|---|---|---|---|---|---|
| Quadrant | DetID | PixID | Counts | Sigma | Mean | Median | Sigma |
| A | 13 | 254 | 9615 | 53.71 | 819 | 806 | 164.0 |
| A | 3 | 137 | 6879 | 37.03 | 819 | 806 | 164.0 |
| A | 0 | 226 | 6871 | 36.98 | 819 | 806 | 164.0 |
| B | 0 | 190 | 23044 | 145.07 | 829 | 812 | 153.3 |
| B | 12 | 111 | 18155 | 113.17 | 829 | 812 | 153.3 |
| B | 11 | 111 | 15951 | 98.78 | 829 | 812 | 153.3 |
| C | 7 | 247 | 648155 | 3565.65 | 789 | 797 | 181.6 |
| C | 2 | 16 | 468902 | 2578.33 | 789 | 797 | 181.6 |
| C | 14 | 238 | 128221 | 701.85 | 789 | 797 | 181.6 |
| D | 1 | 52 | 1631521 | 8811.15 | 772 | 752 | 185.1 |
| D | 9 | 1 | 348405 | 1878.39 | 772 | 752 | 185.1 |
| D | 12 | 233 | 337401 | 1818.94 | 772 | 752 | 185.1 |
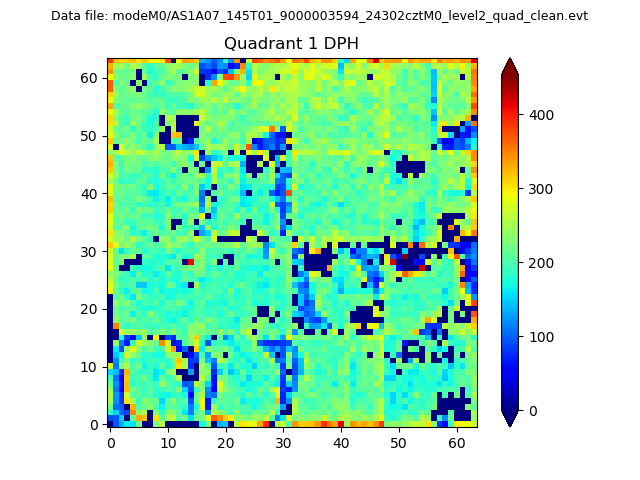
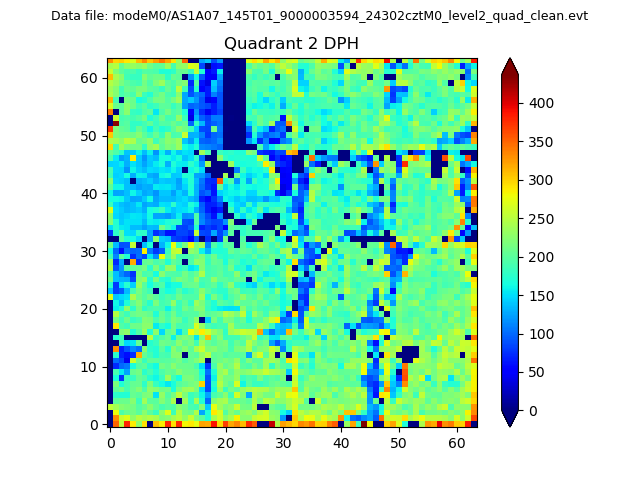
Histogram calculated using DETX and DETY for each event in the final _common_clean file
| Quadrant A |  |
 |
Quadrant B |
|---|---|---|---|
| Quadrant D | 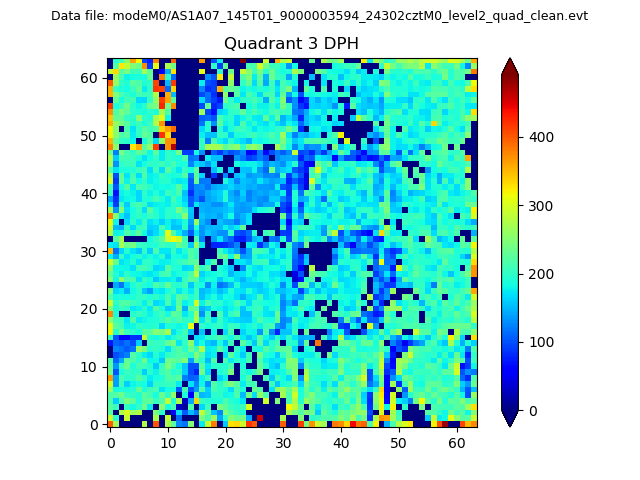 |
 |
Quadrant C |
| Plot type | Count rate plots | Images |
|---|---|---|
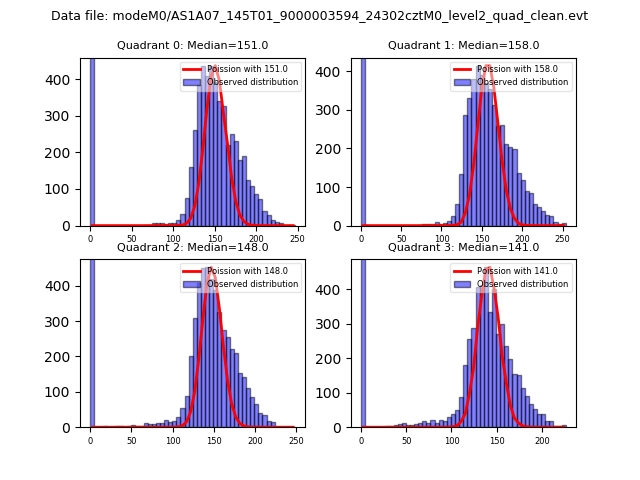
| Comparison with Poisson distribution Blue bars denote a histogram of data divided into 1 sec bins. Red curve is a Poisson curve with rate = median count rate of data. |
 |
 |
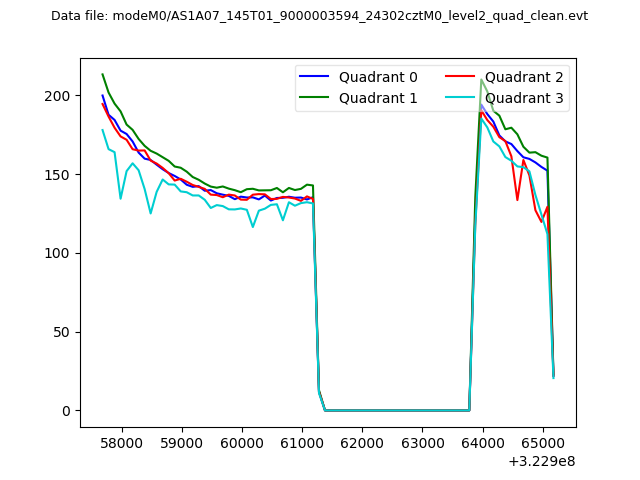
| Quadrant-wise count rates Data is divided into 100 sec bins |
 |
|
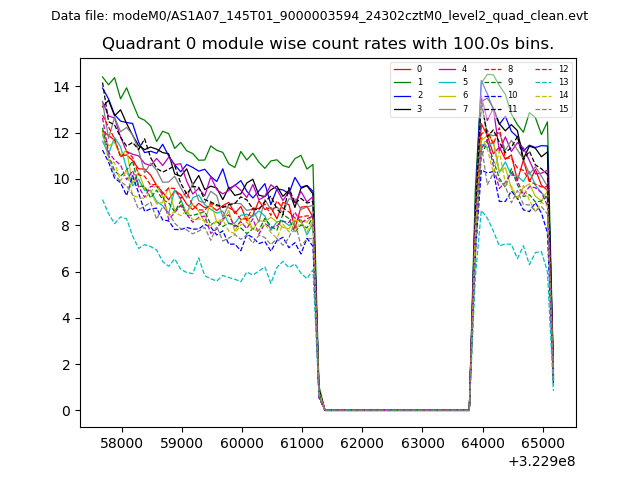
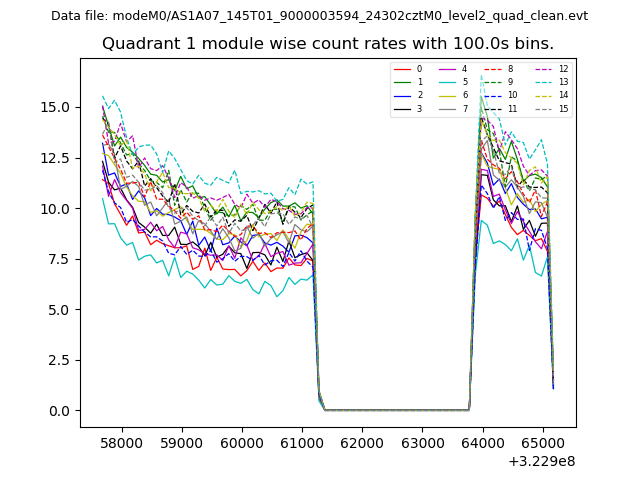
| Module-wise count rates for Quadrant A Data is divided into 100 sec bins |
 |
 |
| Module-wise count rates for Quadrant B Data is divided into 100 sec bins |
 |
 |
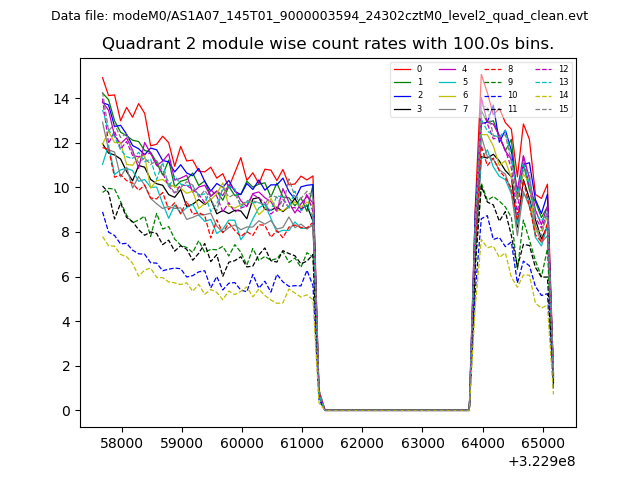
| Module-wise count rates for Quadrant C Data is divided into 100 sec bins |
 |
 |
| Module-wise count rates for Quadrant D Data is divided into 100 sec bins |
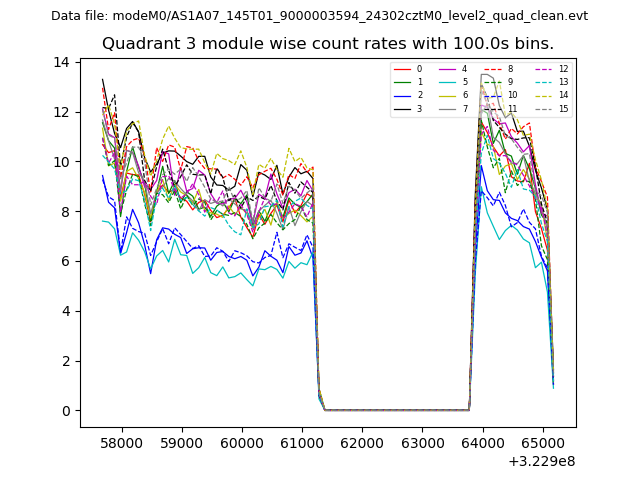 |
 |
| Parameter | Plot |
|---|---|
| CZT HV Monitor | 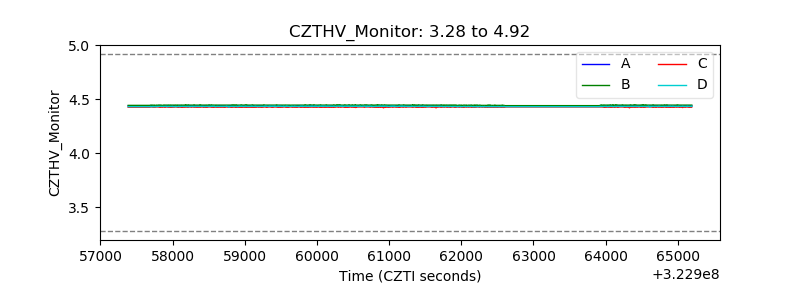 |
| D_VDD | 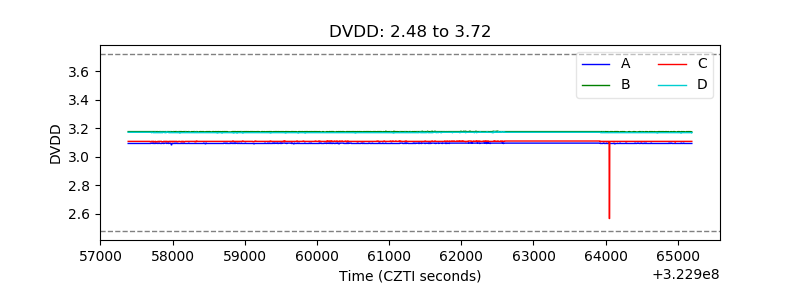 |
| Temperature 1 |  |
| Veto HV Monitor | 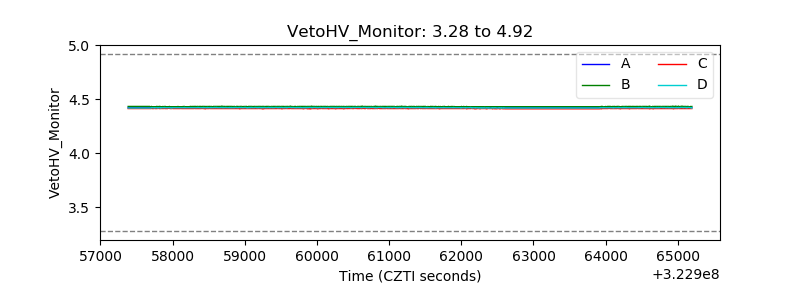 |
| Veto LLD | 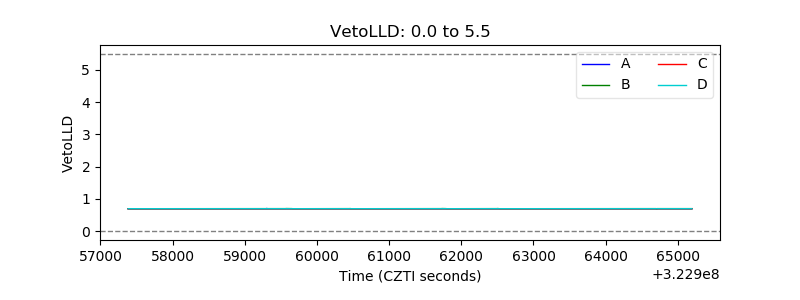 |
| Alpha Counter | 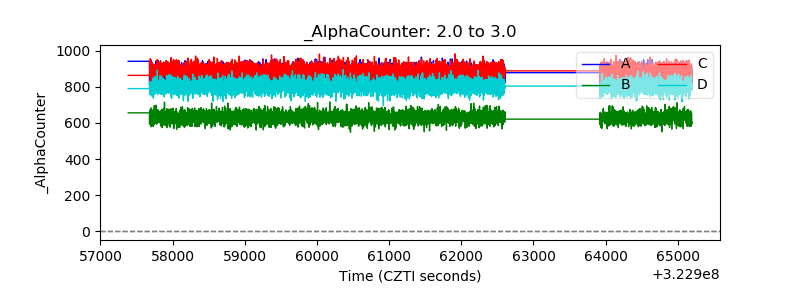 |
| _CPM_Rate |  |
| CZT Counter | 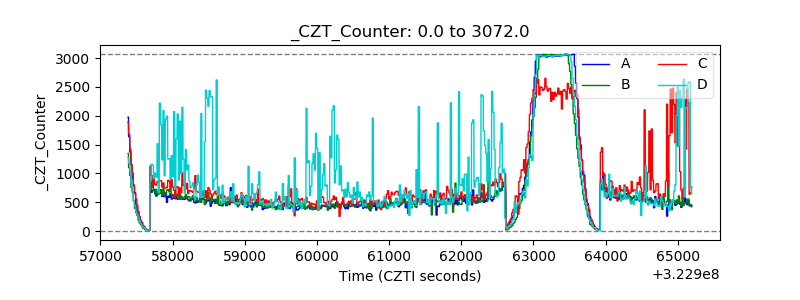 |
| +2.5 Volts monitor |  |
| +5 Volts monitor | 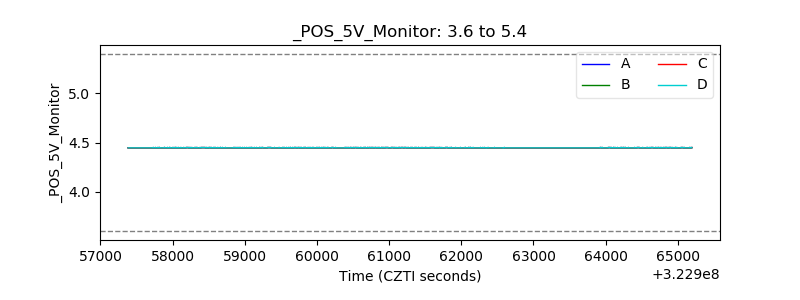 |
| _ROLL_ROT | 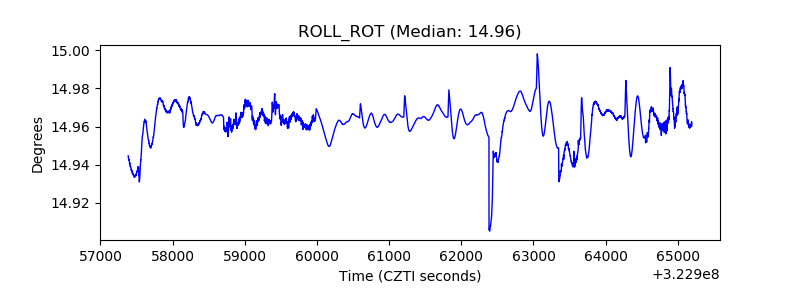 |
| _Roll_DEC | 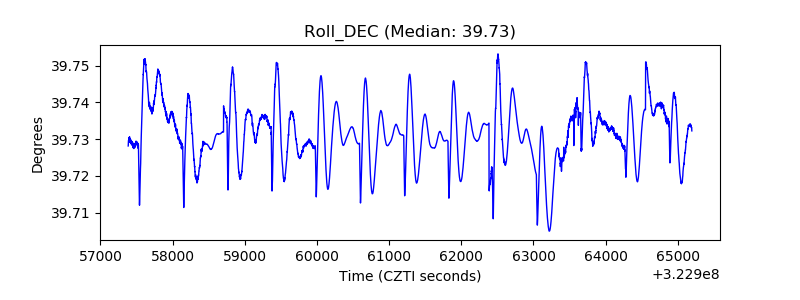 |
| _Roll_RA | 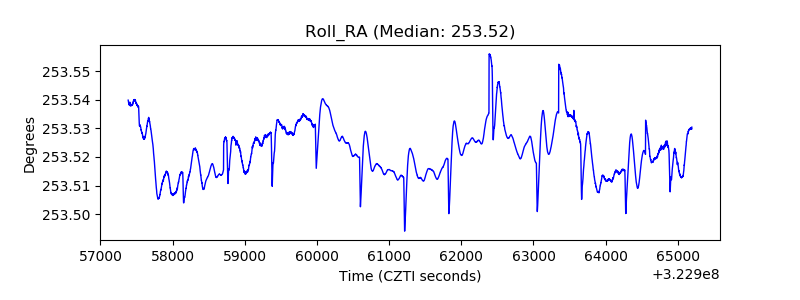 |
| Veto Counter | 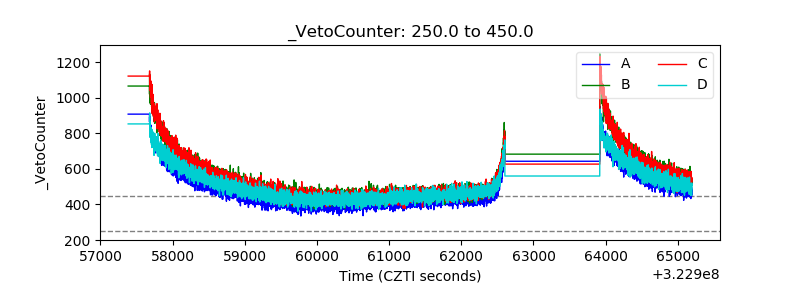 |