| Param | Original file | Final file |
|---|---|---|
| Filename | modeM0/AS1A07_145T01_9000003594_24303cztM0_level2.evt | modeM0/AS1A07_145T01_9000003594_24303cztM0_level2_quad_clean.evt |
| Size (bytes) | 604,261,440 | 104,955,840 |
| Size | 576.3 MB | 100.1 MB |
| Events in quadrant A | 3,188,302 | 705,375 |
| Events in quadrant B | 3,262,900 | 740,817 |
| Events in quadrant C | 5,942,779 | 654,489 |
| Events in quadrant D | 5,484,587 | 642,680 |
| Mode M0 | |||
|---|---|---|---|
| Quadrant | BADHDUFLAG | Total packets | Discarded packets |
| A | 0 | 13304 | 2 |
| B | 0 | 13459 | 2 |
| C | 0 | 22362 | 2 |
| D | 0 | 20472 | 2 |
| Mode M9 | |||
|---|---|---|---|
| Quadrant | BADHDUFLAG | Total packets | Discarded packets |
| A | 0 | 24 | 0 |
| B | 0 | 25 | 0 |
| C | 0 | 25 | 0 |
| D | 0 | 25 | 0 |
| Mode SS | |||
|---|---|---|---|
| Quadrant | BADHDUFLAG | Total packets | Discarded packets |
| A | 0 | 128 | 0 |
| B | 0 | 128 | 0 |
| C | 0 | 128 | 0 |
| D | 0 | 128 | 0 |
| Quadrant | Total seconds | Saturated seconds | Saturation percentage |
|---|---|---|---|
| A | 6224 | 39 | 0.626607% |
| B | 6224 | 60 | 0.964010% |
| C | 6224 | 803 | 12.901671% |
| D | 6223 | 516 | 8.291821% |
Noise dominated data is calculated using 1-second bins in cleaned event files. If a bin has >2000 counts, and if more than 50% of those come from <1% of pixels, then it is considered to be noise-dominated and hence unusable.
| Quadrant | # 1 sec bins | Bins with >0 counts | Bins with >2000 counts | High rate bins dominated by noise | Noise dominated (total time) | Noise dominated (detector-on time) | Marked lightcurve |
|---|---|---|---|---|---|---|---|
| A | 7574 | 6225 | 0 | 0 | 0.00% | 0.00% | 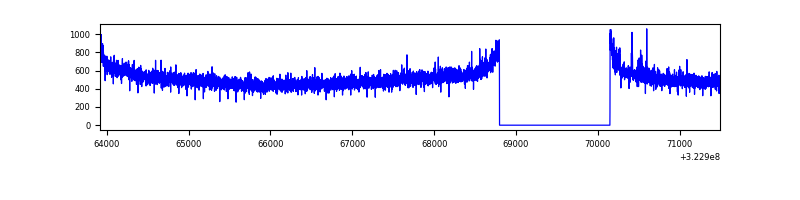 |
| B | 7574 | 6224 | 0 | 0 | 0.00% | 0.00% | 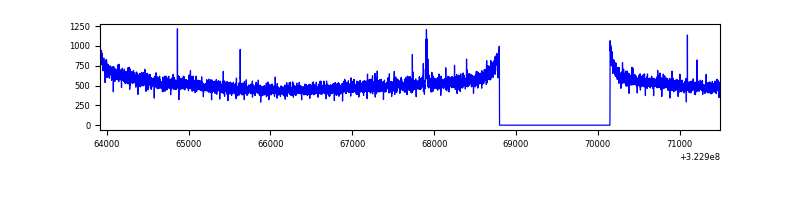 |
| C | 7574 | 6224 | 566 | 566 | 7.47% | 9.09% | 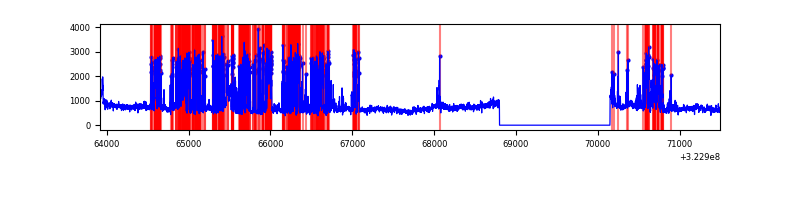 |
| D | 7573 | 6224 | 492 | 492 | 6.50% | 7.90% | 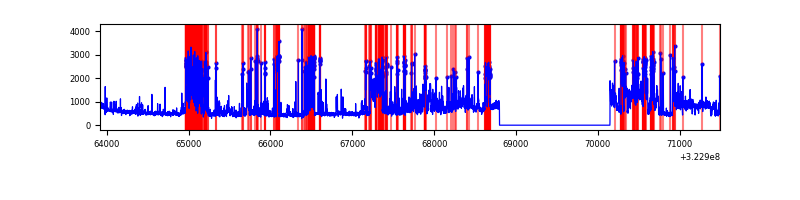 |
Top three noisy pixels from each quadrant. If the there are fewer than three noisy pixels in the level2.evt file, extra rows are filled as -1
| Pixel properties | Quadrant properties | ||||||
|---|---|---|---|---|---|---|---|
| Quadrant | DetID | PixID | Counts | Sigma | Mean | Median | Sigma |
| A | 3 | 1 | 22048 | 129.73 | 822 | 808 | 163.7 |
| A | 13 | 254 | 9435 | 52.69 | 822 | 808 | 163.7 |
| A | 0 | 226 | 6967 | 37.62 | 822 | 808 | 163.7 |
| B | 12 | 111 | 17884 | 110.36 | 830 | 811 | 154.7 |
| B | 11 | 111 | 15768 | 96.68 | 830 | 811 | 154.7 |
| B | 14 | 111 | 14443 | 88.12 | 830 | 811 | 154.7 |
| C | 2 | 16 | 1981916 | 11281.99 | 767 | 775 | 175.6 |
| C | 7 | 247 | 804445 | 4576.66 | 767 | 775 | 175.6 |
| C | 14 | 238 | 125195 | 708.53 | 767 | 775 | 175.6 |
| D | 1 | 52 | 1622262 | 8711.59 | 768 | 747 | 186.1 |
| D | 9 | 1 | 701819 | 3766.51 | 768 | 747 | 186.1 |
| D | 8 | 195 | 184766 | 988.64 | 768 | 747 | 186.1 |
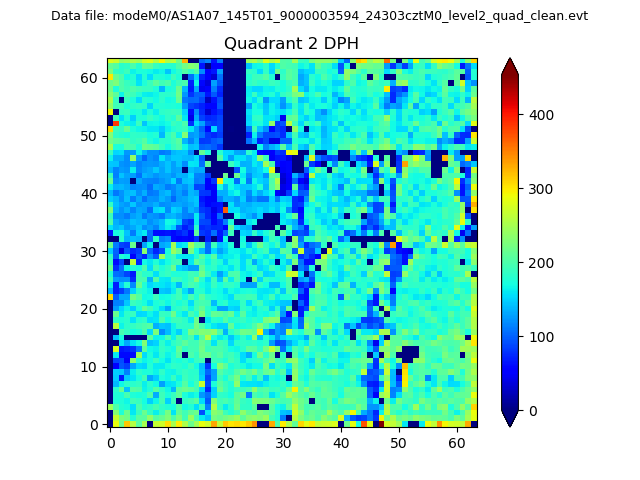
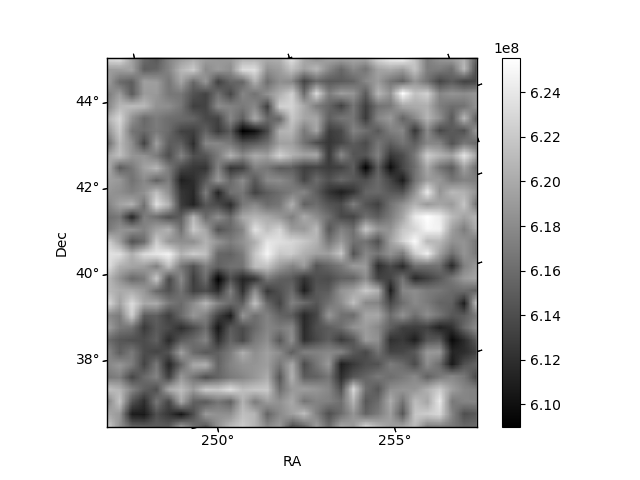
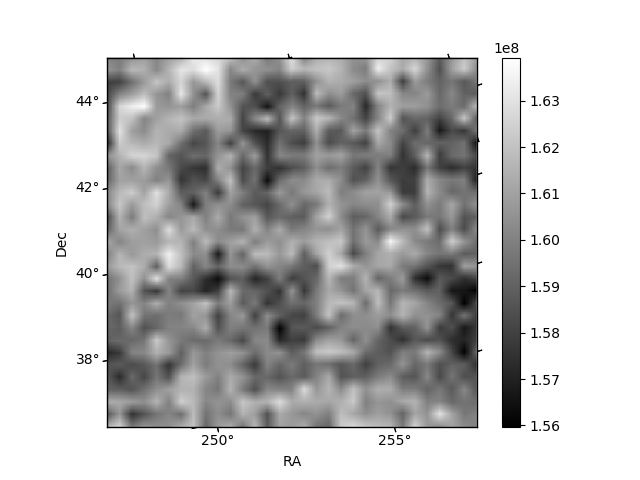
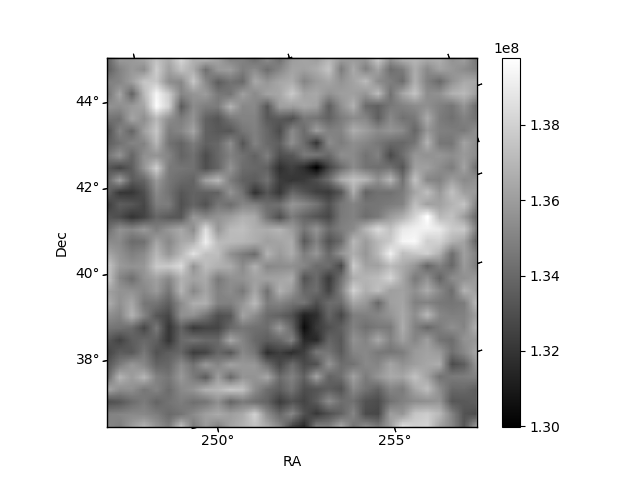
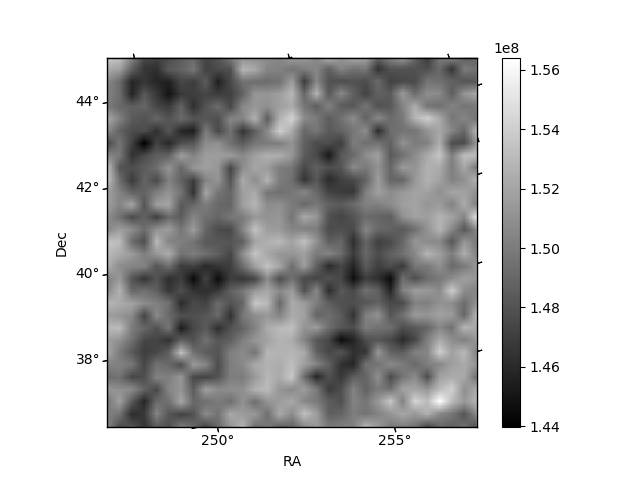
Histogram calculated using DETX and DETY for each event in the final _common_clean file
| Quadrant A | 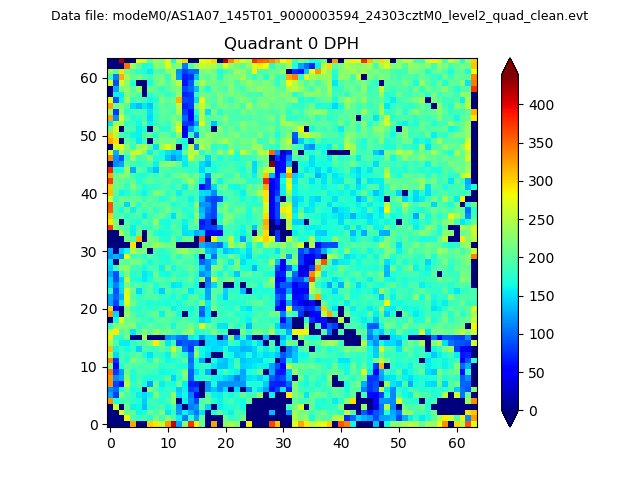 |
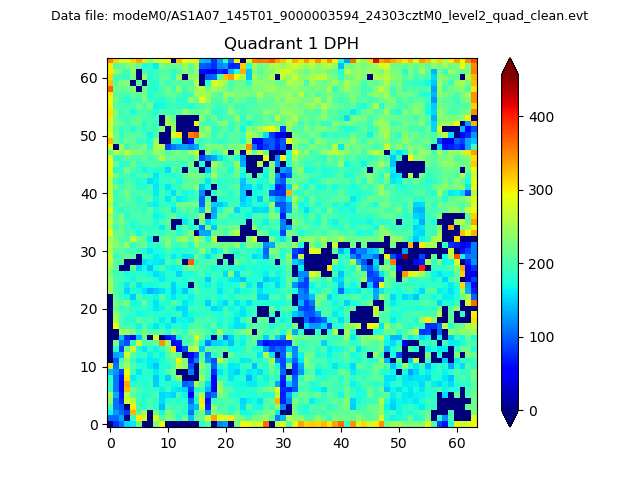 |
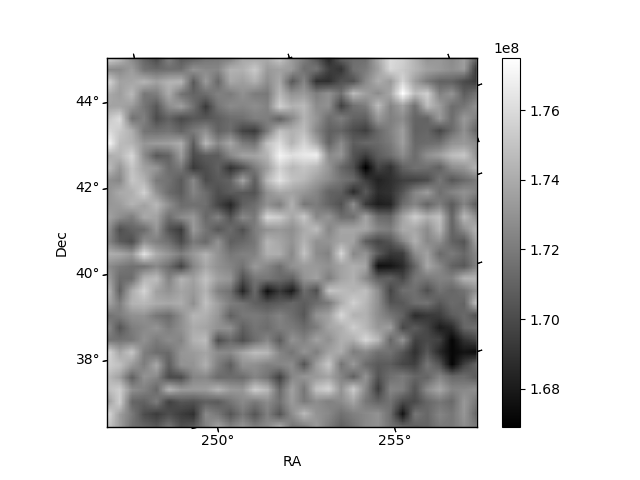
Quadrant B |
|---|---|---|---|
| Quadrant D | 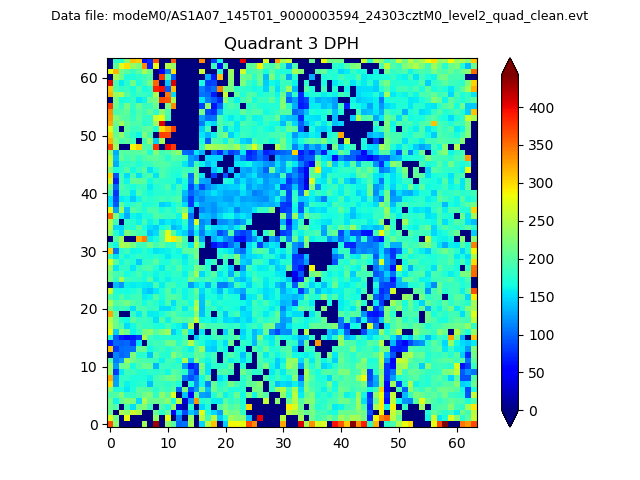 |
 |
Quadrant C |
| Plot type | Count rate plots | Images |
|---|---|---|
| Comparison with Poisson distribution Blue bars denote a histogram of data divided into 1 sec bins. Red curve is a Poisson curve with rate = median count rate of data. |
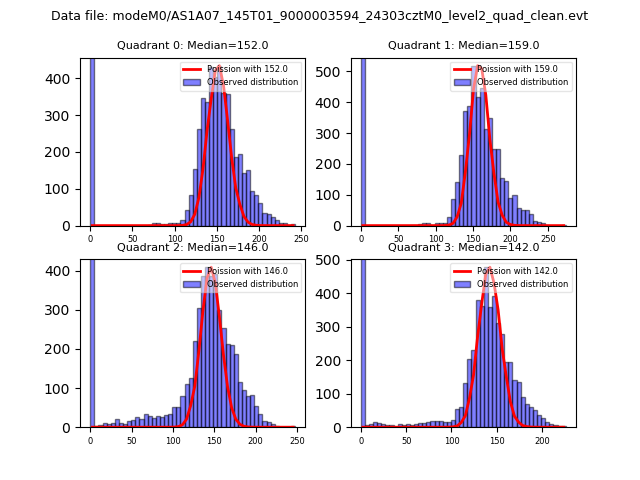 |
 |
| Quadrant-wise count rates Data is divided into 100 sec bins |
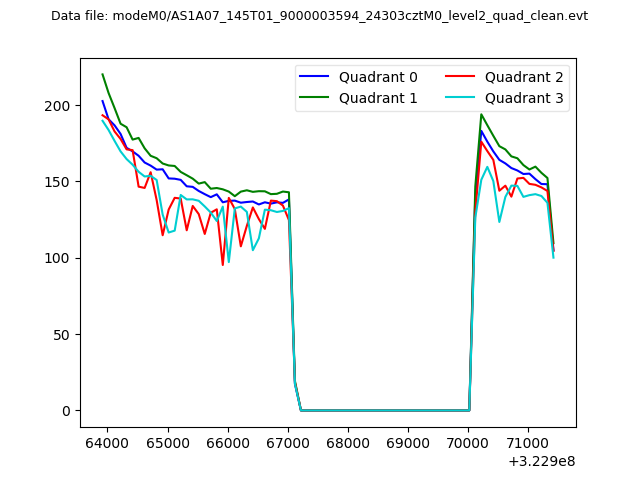 |
|
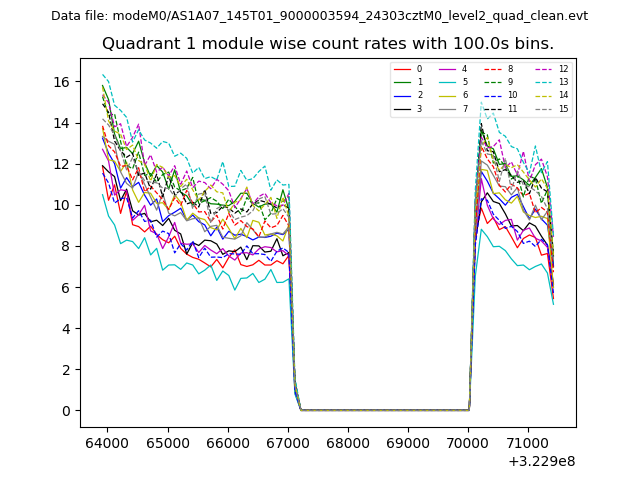
| Module-wise count rates for Quadrant A Data is divided into 100 sec bins |
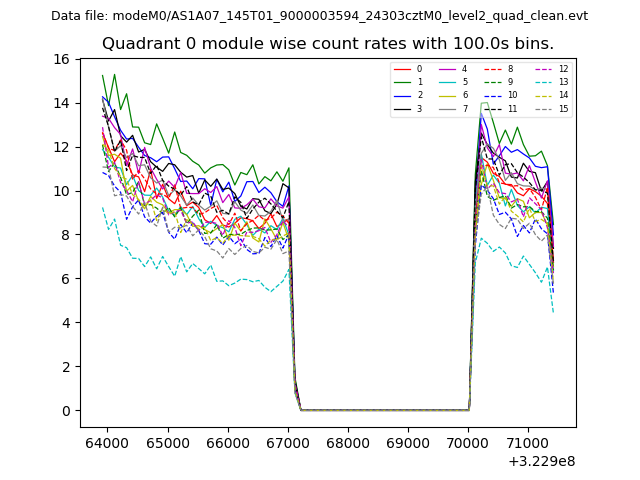 |
 |
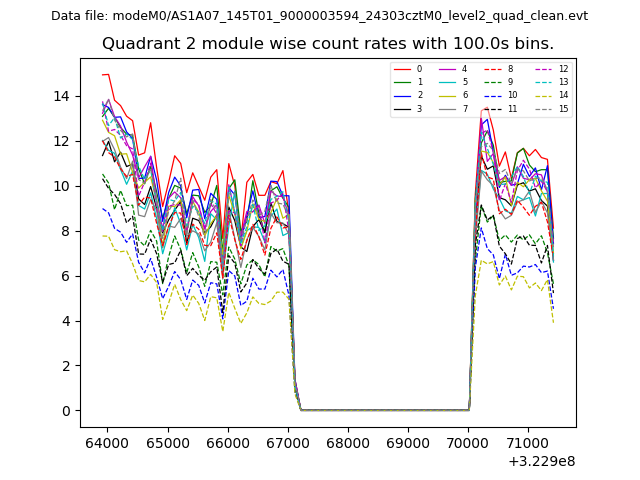
| Module-wise count rates for Quadrant B Data is divided into 100 sec bins |
 |
 |
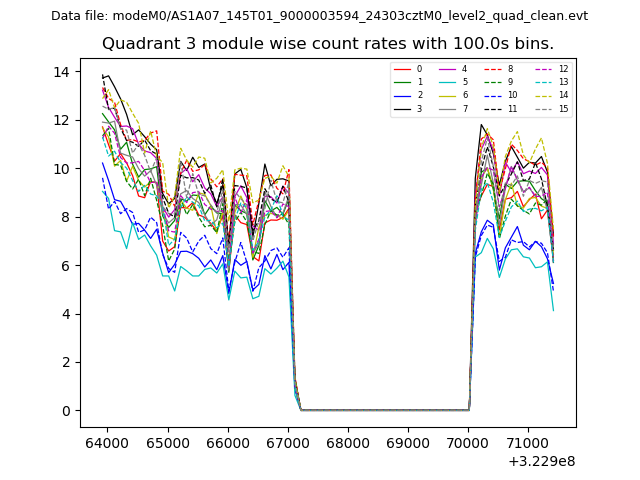
| Module-wise count rates for Quadrant C Data is divided into 100 sec bins |
 |
 |
| Module-wise count rates for Quadrant D Data is divided into 100 sec bins |
 |
 |
| Parameter | Plot |
|---|---|
| CZT HV Monitor | 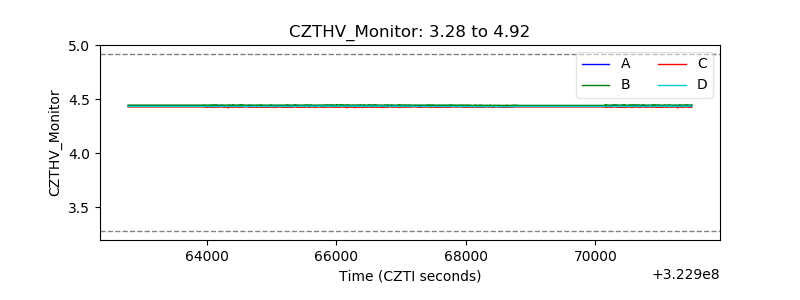 |
| D_VDD | 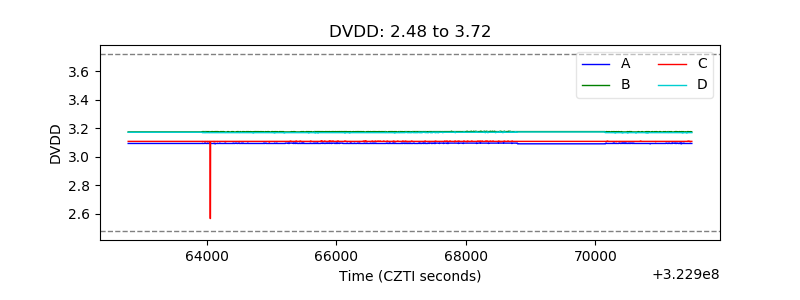 |
| Temperature 1 | 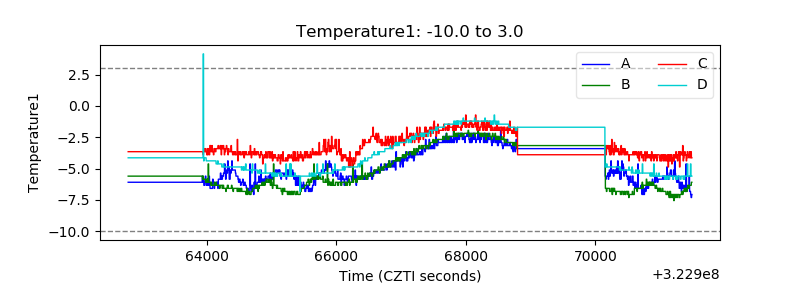 |
| Veto HV Monitor | 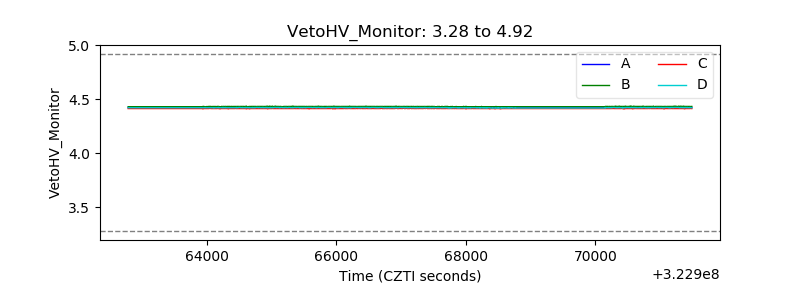 |
| Veto LLD | 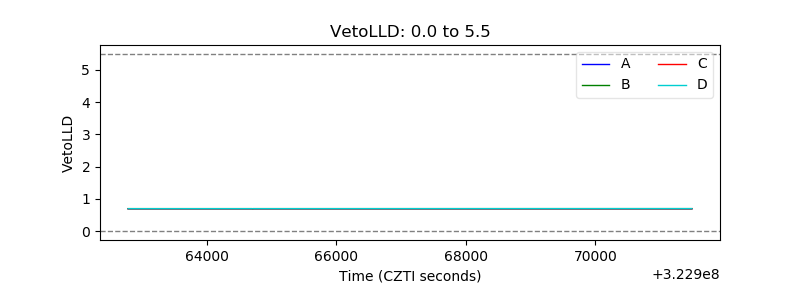 |
| Alpha Counter | 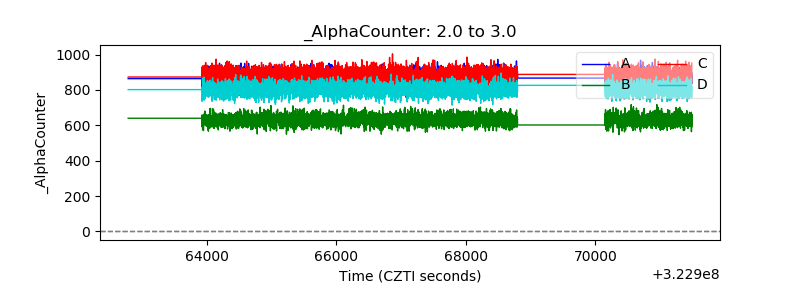 |
| _CPM_Rate | 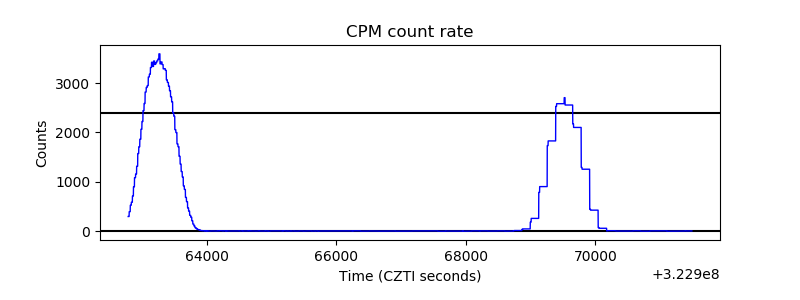 |
| CZT Counter | 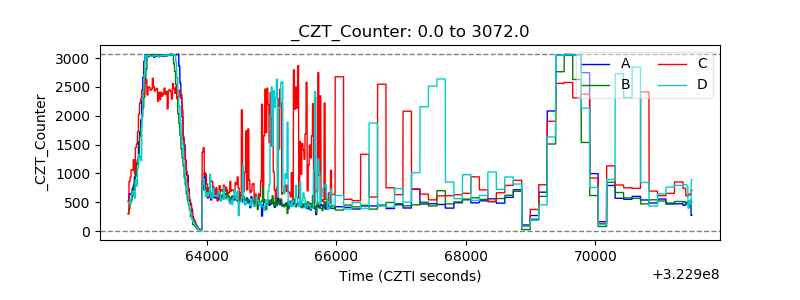 |
| +2.5 Volts monitor |  |
| +5 Volts monitor |  |
| _ROLL_ROT | 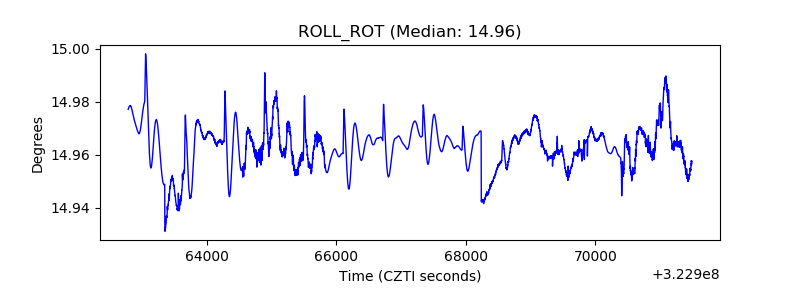 |
| _Roll_DEC | 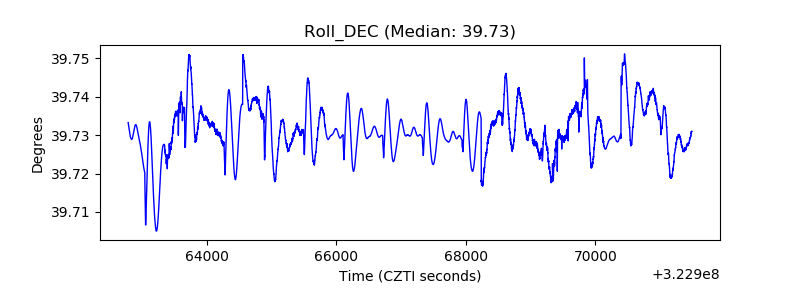 |
| _Roll_RA | 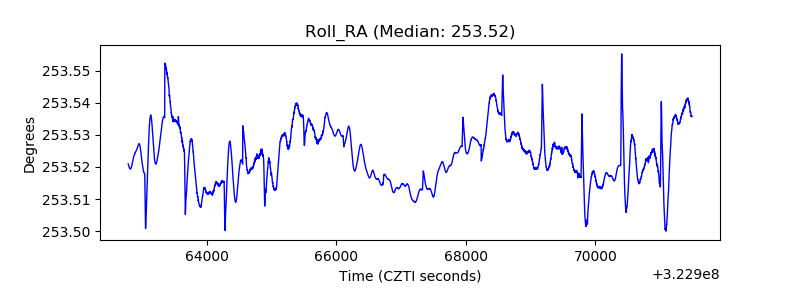 |
| Veto Counter | 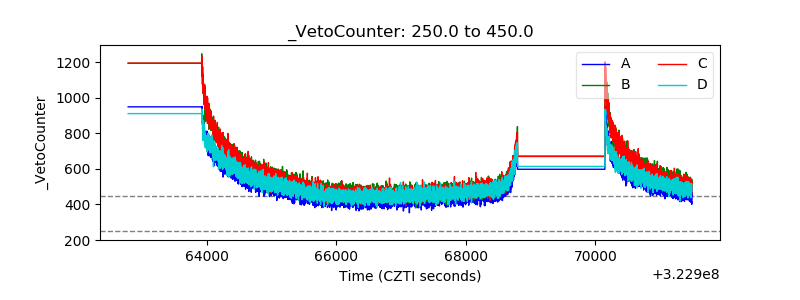 |