| Param | Original file | Final file |
|---|---|---|
| Filename | modeM0/AS1A07_145T01_9000003594_24304cztM0_level2.evt | modeM0/AS1A07_145T01_9000003594_24304cztM0_level2_quad_clean.evt |
| Size (bytes) | 613,051,200 | 100,725,120 |
| Size | 584.7 MB | 96.1 MB |
| Events in quadrant A | 3,326,436 | 663,515 |
| Events in quadrant B | 3,368,216 | 690,759 |
| Events in quadrant C | 4,376,850 | 643,238 |
| Events in quadrant D | 7,050,315 | 594,620 |
| Mode M0 | |||
|---|---|---|---|
| Quadrant | BADHDUFLAG | Total packets | Discarded packets |
| A | 0 | 13904 | 2 |
| B | 0 | 13975 | 2 |
| C | 0 | 17403 | 2 |
| D | 0 | 25441 | 2 |
| Mode M9 | |||
|---|---|---|---|
| Quadrant | BADHDUFLAG | Total packets | Discarded packets |
| A | 0 | 24 | 0 |
| B | 0 | 25 | 0 |
| C | 0 | 25 | 0 |
| D | 0 | 25 | 0 |
| Mode SS | |||
|---|---|---|---|
| Quadrant | BADHDUFLAG | Total packets | Discarded packets |
| A | 0 | 132 | 0 |
| B | 0 | 132 | 0 |
| C | 0 | 132 | 0 |
| D | 0 | 132 | 0 |
| Quadrant | Total seconds | Saturated seconds | Saturation percentage |
|---|---|---|---|
| A | 6574 | 32 | 0.486766% |
| B | 6574 | 55 | 0.836629% |
| C | 6574 | 238 | 3.620322% |
| D | 6574 | 790 | 12.017037% |
Noise dominated data is calculated using 1-second bins in cleaned event files. If a bin has >2000 counts, and if more than 50% of those come from <1% of pixels, then it is considered to be noise-dominated and hence unusable.
| Quadrant | # 1 sec bins | Bins with >0 counts | Bins with >2000 counts | High rate bins dominated by noise | Noise dominated (total time) | Noise dominated (detector-on time) | Marked lightcurve |
|---|---|---|---|---|---|---|---|
| A | 7894 | 6575 | 0 | 0 | 0.00% | 0.00% | 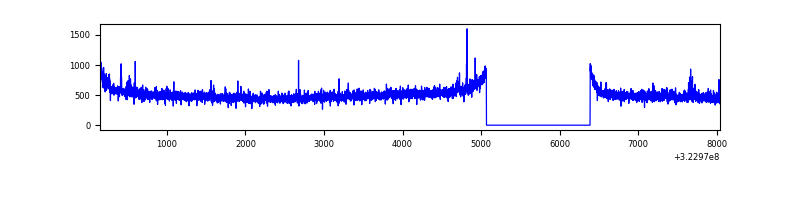 |
| B | 7894 | 6575 | 6 | 6 | 0.08% | 0.09% |  |
| C | 7894 | 6575 | 89 | 89 | 1.13% | 1.35% | 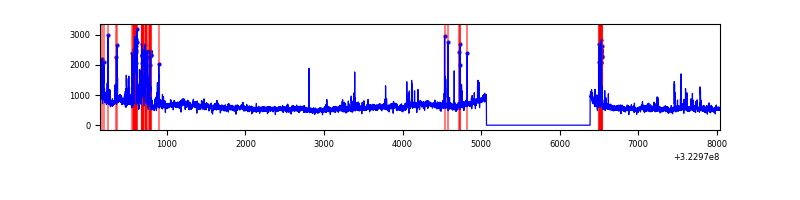 |
| D | 7894 | 6574 | 742 | 742 | 9.40% | 11.29% | 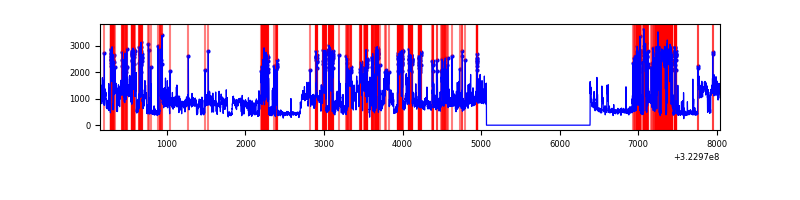 |
Top three noisy pixels from each quadrant. If the there are fewer than three noisy pixels in the level2.evt file, extra rows are filled as -1
| Pixel properties | Quadrant properties | ||||||
|---|---|---|---|---|---|---|---|
| Quadrant | DetID | PixID | Counts | Sigma | Mean | Median | Sigma |
| A | 3 | 1 | 68007 | 396.86 | 845 | 831 | 169.3 |
| A | 13 | 254 | 9457 | 50.96 | 845 | 831 | 169.3 |
| A | 0 | 226 | 7166 | 37.43 | 845 | 831 | 169.3 |
| B | 12 | 17 | 39281 | 240.92 | 849 | 828 | 159.6 |
| B | 12 | 111 | 18916 | 113.33 | 849 | 828 | 159.6 |
| B | 11 | 111 | 16454 | 97.9 | 849 | 828 | 159.6 |
| C | 7 | 247 | 614435 | 3289.63 | 805 | 811 | 186.5 |
| C | 2 | 16 | 459883 | 2461.08 | 805 | 811 | 186.5 |
| C | 14 | 238 | 131445 | 700.33 | 805 | 811 | 186.5 |
| D | 1 | 52 | 3671138 | 19495.99 | 778 | 756 | 188.3 |
| D | 8 | 195 | 235062 | 1244.56 | 778 | 756 | 188.3 |
| D | 9 | 1 | 145751 | 770.17 | 778 | 756 | 188.3 |
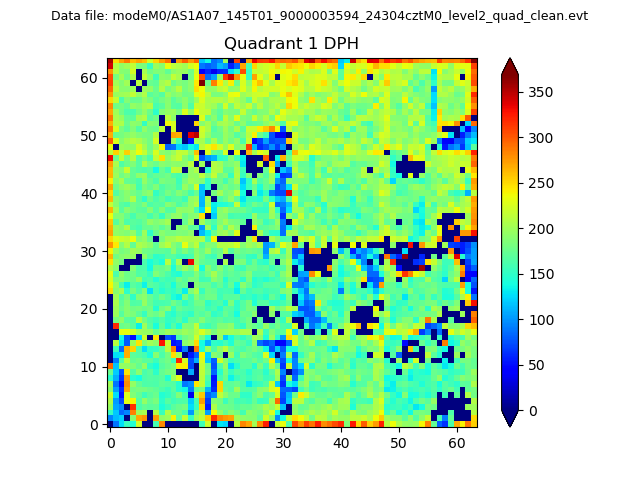
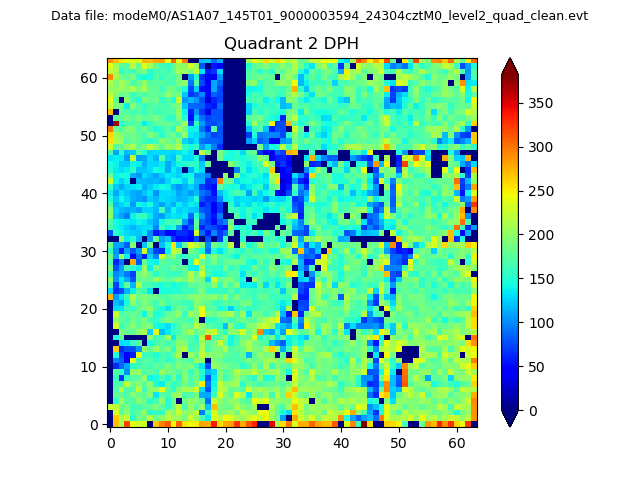
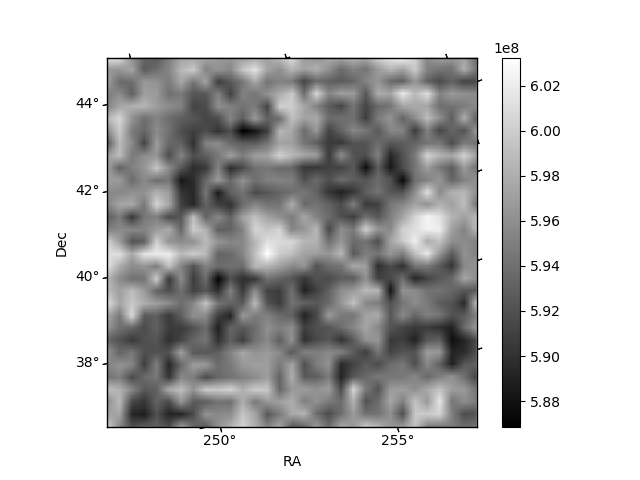
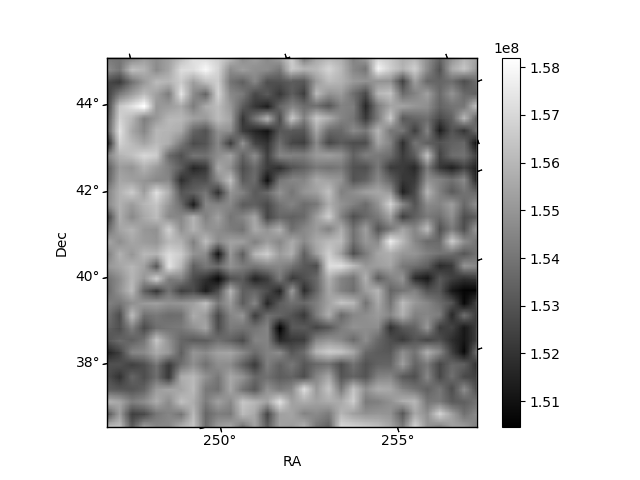
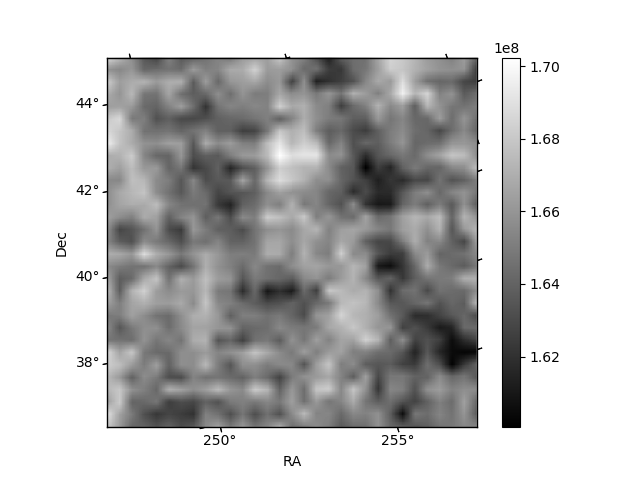
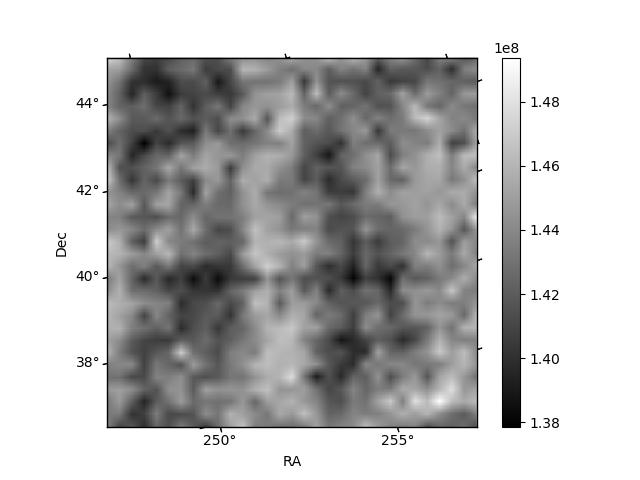
Histogram calculated using DETX and DETY for each event in the final _common_clean file
| Quadrant A | 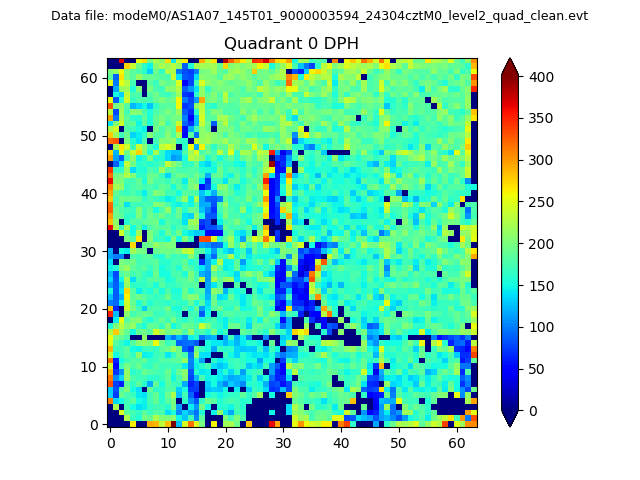 |
 |
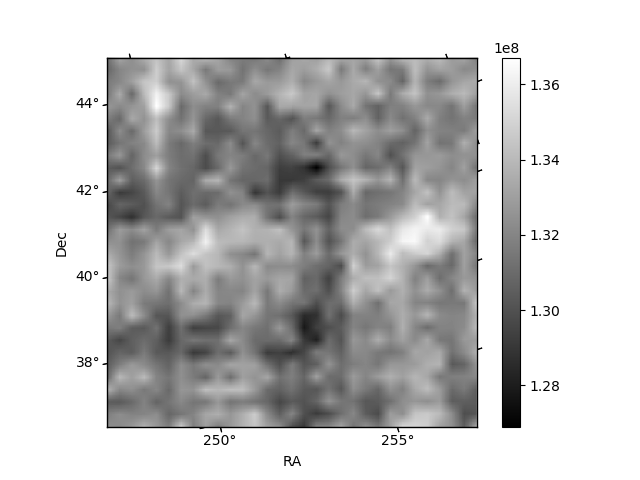
Quadrant B |
|---|---|---|---|
| Quadrant D | 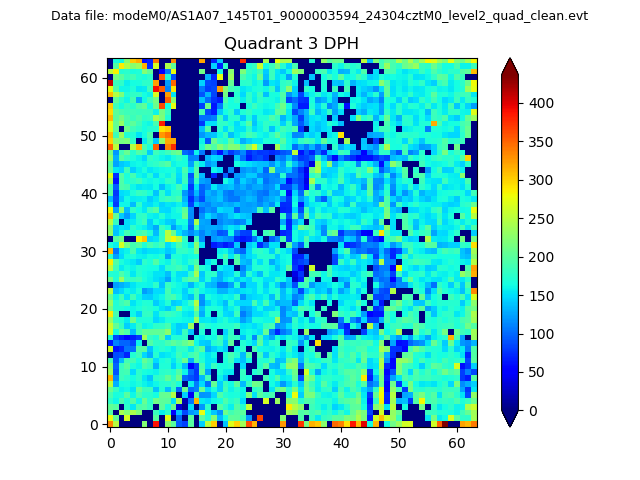 |
 |
Quadrant C |
| Plot type | Count rate plots | Images |
|---|---|---|
| Comparison with Poisson distribution Blue bars denote a histogram of data divided into 1 sec bins. Red curve is a Poisson curve with rate = median count rate of data. |
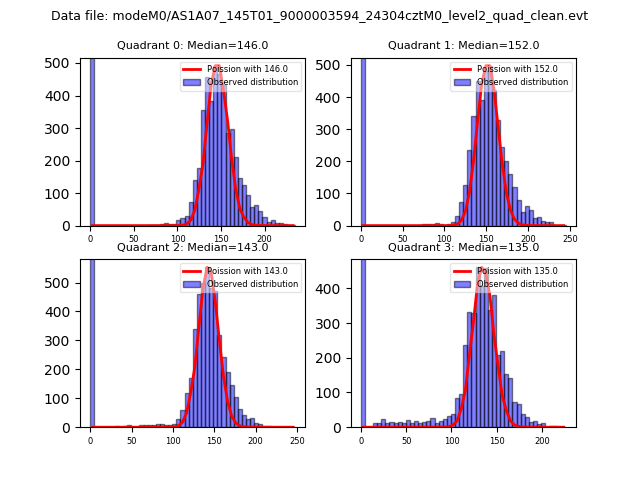 |
 |
| Quadrant-wise count rates Data is divided into 100 sec bins |
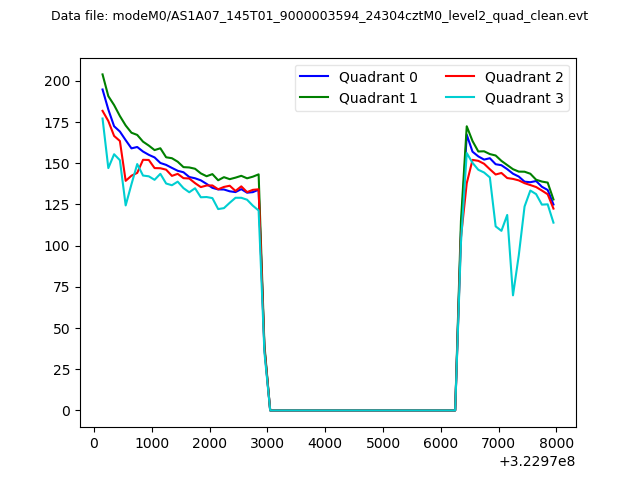 |
|
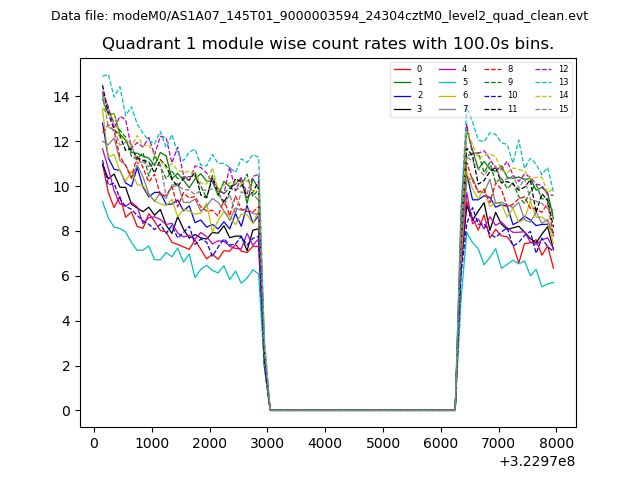
| Module-wise count rates for Quadrant A Data is divided into 100 sec bins |
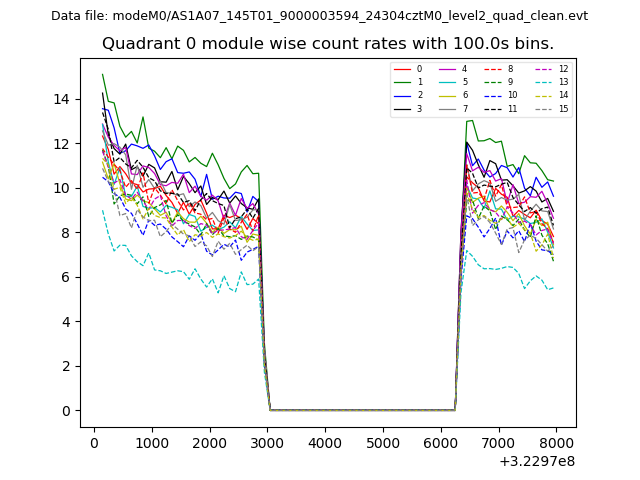 |
 |
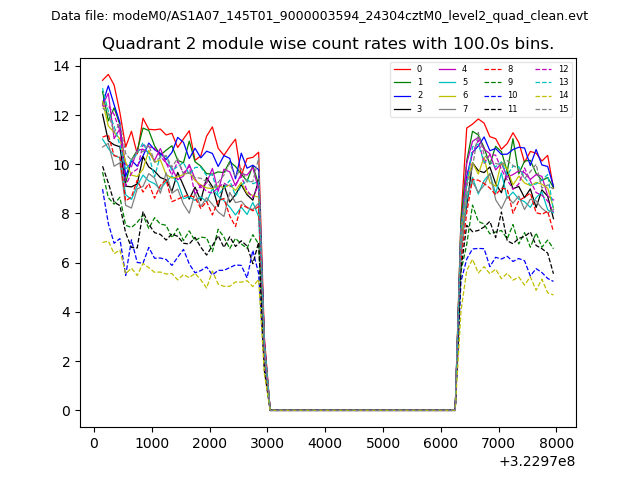
| Module-wise count rates for Quadrant B Data is divided into 100 sec bins |
 |
 |
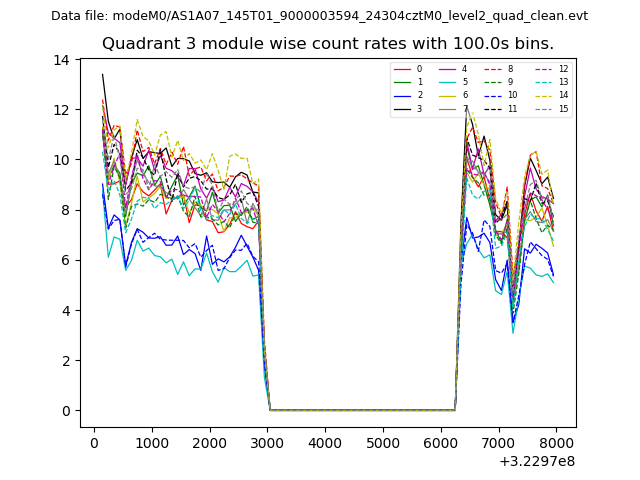
| Module-wise count rates for Quadrant C Data is divided into 100 sec bins |
 |
 |
| Module-wise count rates for Quadrant D Data is divided into 100 sec bins |
 |
 |
| Parameter | Plot |
|---|---|
| CZT HV Monitor | 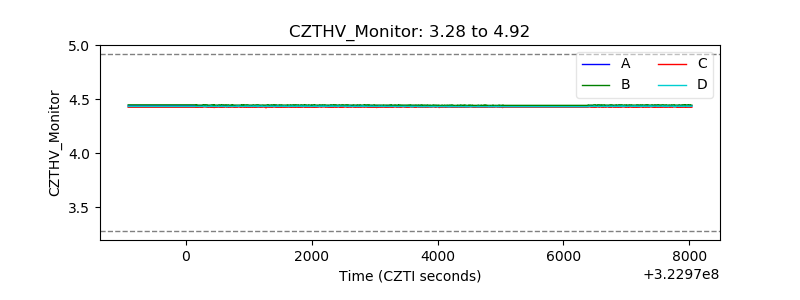 |
| D_VDD | 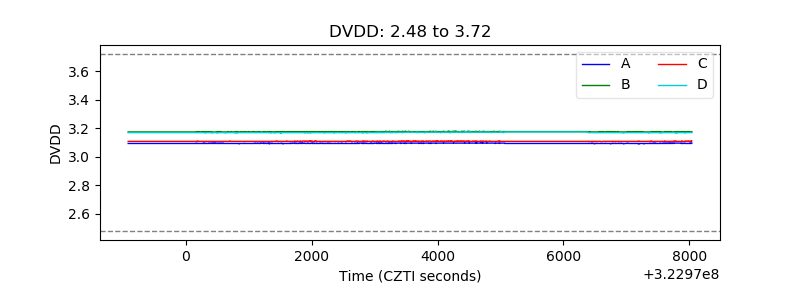 |
| Temperature 1 |  |
| Veto HV Monitor | 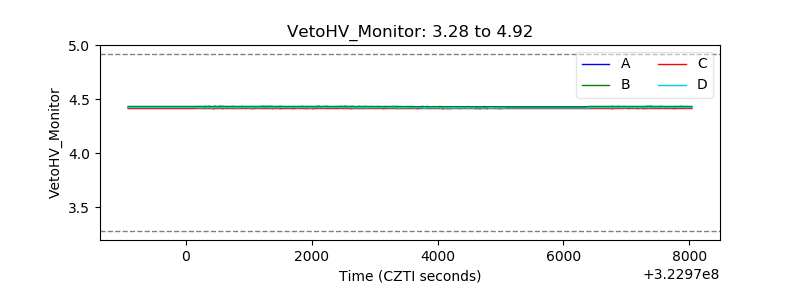 |
| Veto LLD | 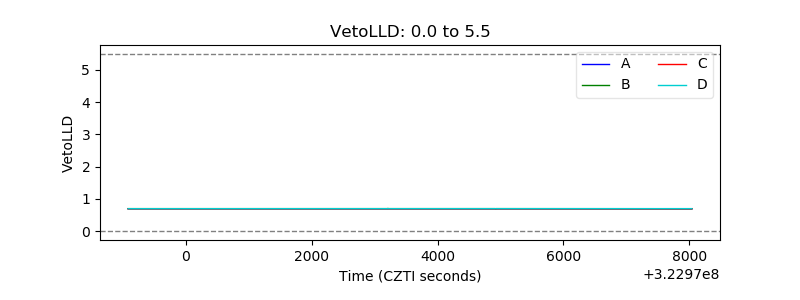 |
| Alpha Counter | 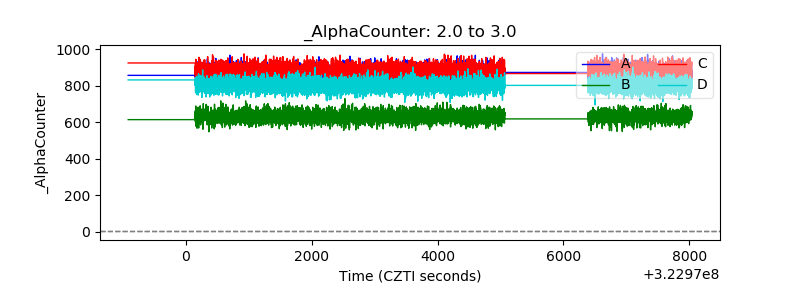 |
| _CPM_Rate | 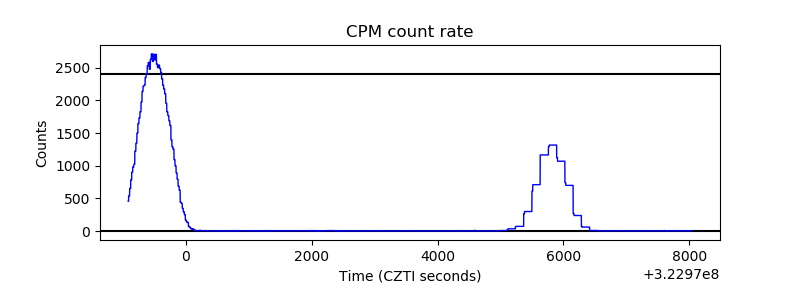 |
| CZT Counter | 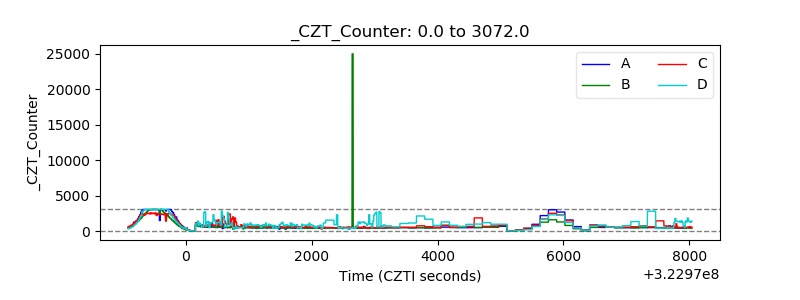 |
| +2.5 Volts monitor | 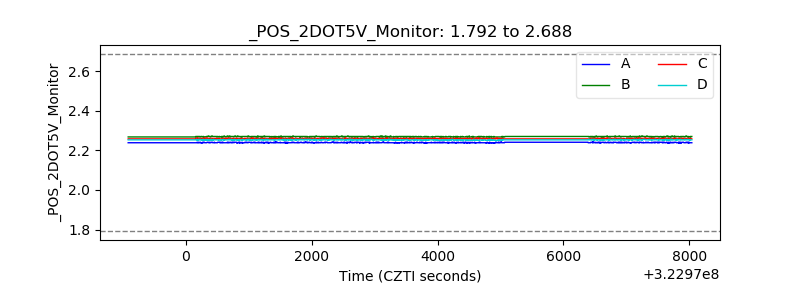 |
| +5 Volts monitor | 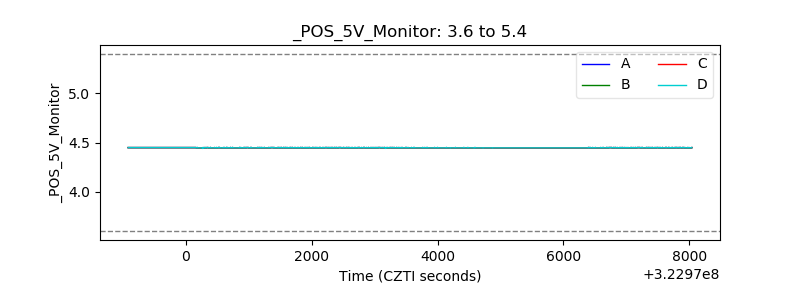 |
| _ROLL_ROT | 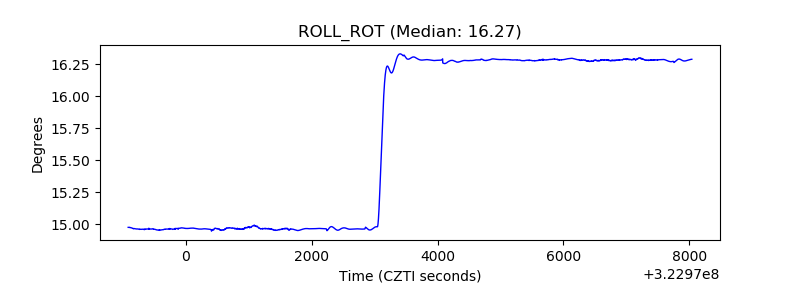 |
| _Roll_DEC | 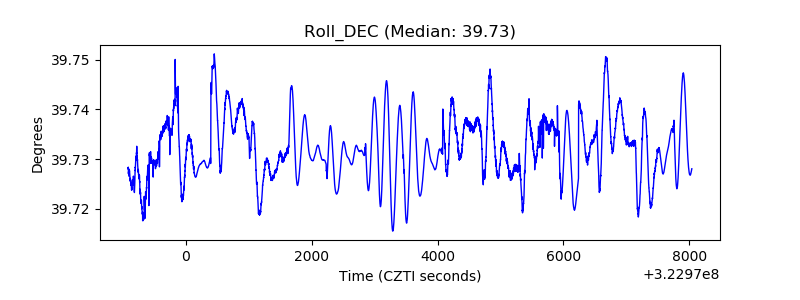 |
| _Roll_RA | 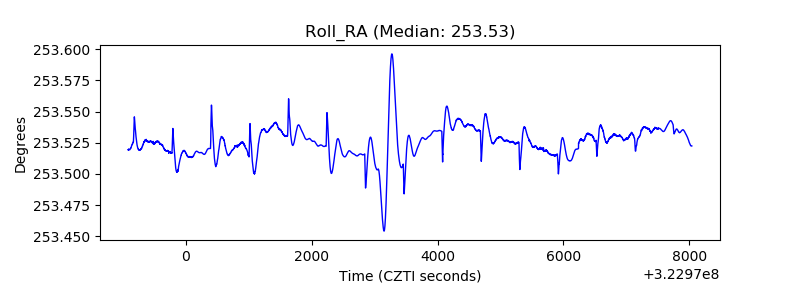 |
| Veto Counter | 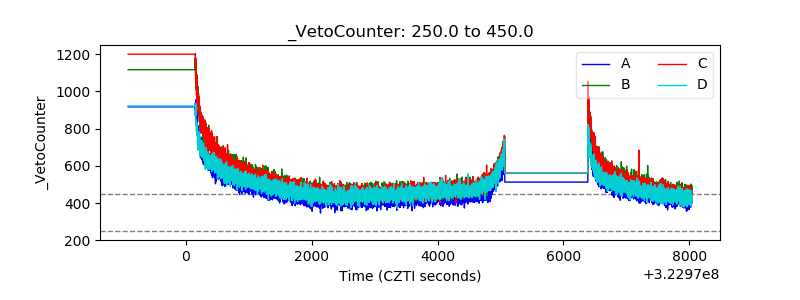 |