| Param | Original file | Final file |
|---|---|---|
| Filename | modeM0/AS1A07_145T01_9000003594_24305cztM0_level2.evt | modeM0/AS1A07_145T01_9000003594_24305cztM0_level2_quad_clean.evt |
| Size (bytes) | 552,355,200 | 85,752,000 |
| Size | 526.8 MB | 81.8 MB |
| Events in quadrant A | 3,036,843 | 555,532 |
| Events in quadrant B | 3,031,468 | 574,630 |
| Events in quadrant C | 3,763,030 | 548,246 |
| Events in quadrant D | 6,478,367 | 487,381 |
| Mode M0 | |||
|---|---|---|---|
| Quadrant | BADHDUFLAG | Total packets | Discarded packets |
| A | 0 | 12892 | 1 |
| B | 0 | 12893 | 1 |
| C | 0 | 15001 | 1 |
| D | 0 | 23522 | 2 |
| Mode M9 | |||
|---|---|---|---|
| Quadrant | BADHDUFLAG | Total packets | Discarded packets |
| A | 0 | 11 | 0 |
| B | 0 | 11 | 0 |
| C | 0 | 11 | 0 |
| D | 0 | 11 | 0 |
| Mode SS | |||
|---|---|---|---|
| Quadrant | BADHDUFLAG | Total packets | Discarded packets |
| A | 0 | 124 | 0 |
| B | 0 | 124 | 0 |
| C | 0 | 124 | 0 |
| D | 0 | 124 | 0 |
| Quadrant | Total seconds | Saturated seconds | Saturation percentage |
|---|---|---|---|
| A | 6175 | 59 | 0.955466% |
| B | 6176 | 74 | 1.198187% |
| C | 6176 | 211 | 3.416451% |
| D | 6175 | 997 | 16.145749% |
Noise dominated data is calculated using 1-second bins in cleaned event files. If a bin has >2000 counts, and if more than 50% of those come from <1% of pixels, then it is considered to be noise-dominated and hence unusable.
| Quadrant | # 1 sec bins | Bins with >0 counts | Bins with >2000 counts | High rate bins dominated by noise | Noise dominated (total time) | Noise dominated (detector-on time) | Marked lightcurve |
|---|---|---|---|---|---|---|---|
| A | 7235 | 6176 | 0 | 0 | 0.00% | 0.00% | 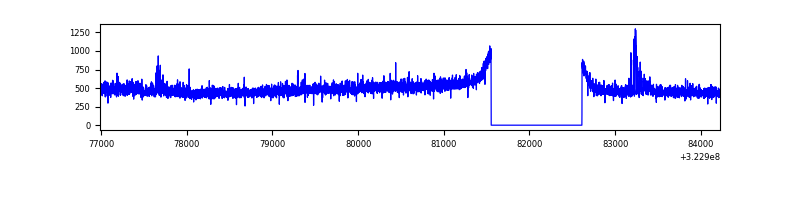 |
| B | 7236 | 6176 | 0 | 0 | 0.00% | 0.00% | 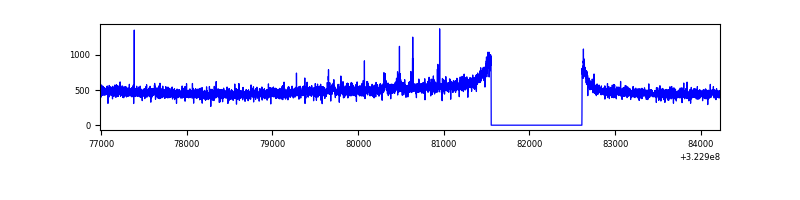 |
| C | 7236 | 6176 | 70 | 70 | 0.97% | 1.13% | 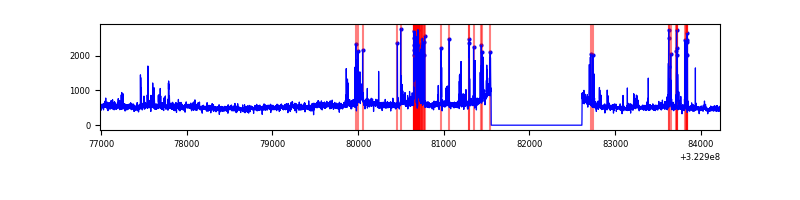 |
| D | 7235 | 6176 | 958 | 958 | 13.24% | 15.51% | 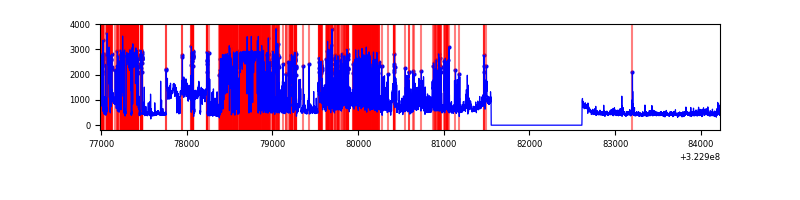 |
Top three noisy pixels from each quadrant. If the there are fewer than three noisy pixels in the level2.evt file, extra rows are filled as -1
| Pixel properties | Quadrant properties | ||||||
|---|---|---|---|---|---|---|---|
| Quadrant | DetID | PixID | Counts | Sigma | Mean | Median | Sigma |
| A | 3 | 1 | 61093 | 392.43 | 770 | 755 | 153.8 |
| A | 5 | 203 | 10142 | 61.05 | 770 | 755 | 153.8 |
| A | 13 | 254 | 8895 | 52.94 | 770 | 755 | 153.8 |
| B | 12 | 111 | 17698 | 116.63 | 767 | 748 | 145.3 |
| B | 11 | 111 | 15795 | 103.54 | 767 | 748 | 145.3 |
| B | 14 | 111 | 14040 | 91.46 | 767 | 748 | 145.3 |
| C | 2 | 16 | 438910 | 2576.75 | 731 | 736 | 170.0 |
| C | 7 | 247 | 355558 | 2086.59 | 731 | 736 | 170.0 |
| C | 14 | 238 | 116453 | 680.49 | 731 | 736 | 170.0 |
| D | 1 | 52 | 3450001 | 20193.67 | 699 | 678 | 170.8 |
| D | 8 | 195 | 249214 | 1455.03 | 699 | 678 | 170.8 |
| D | 12 | 233 | 86130 | 500.27 | 699 | 678 | 170.8 |
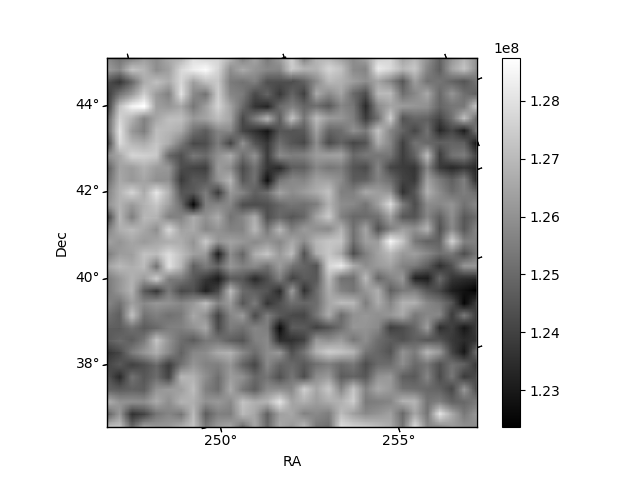
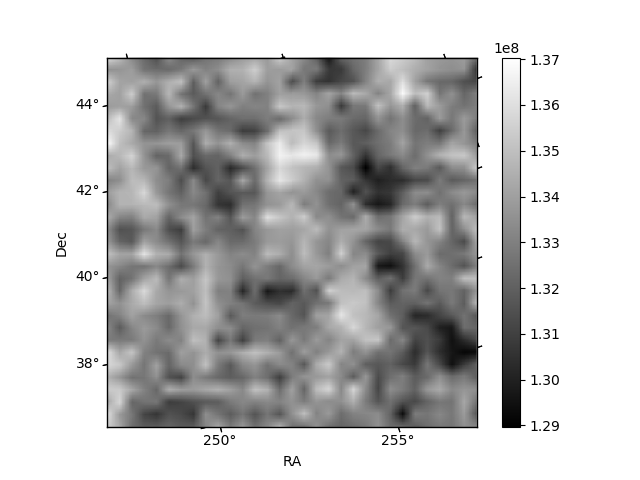
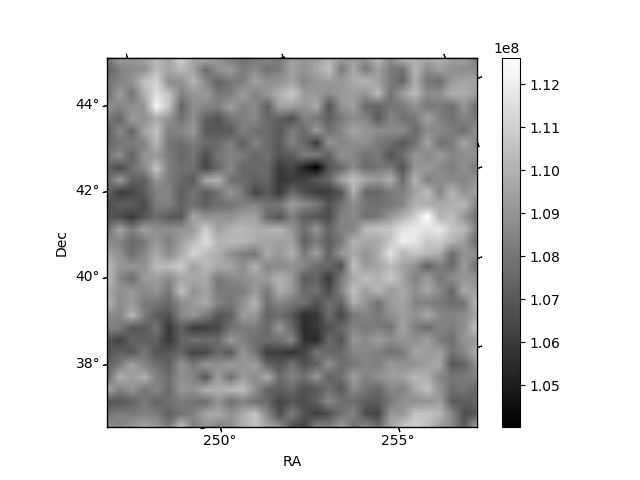
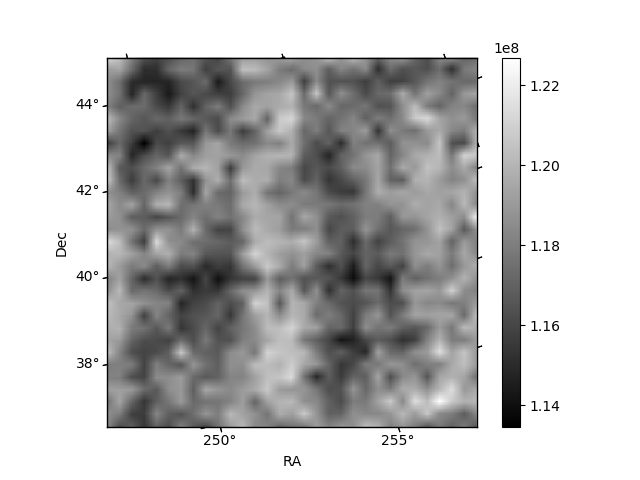
Histogram calculated using DETX and DETY for each event in the final _common_clean file
| Quadrant A | 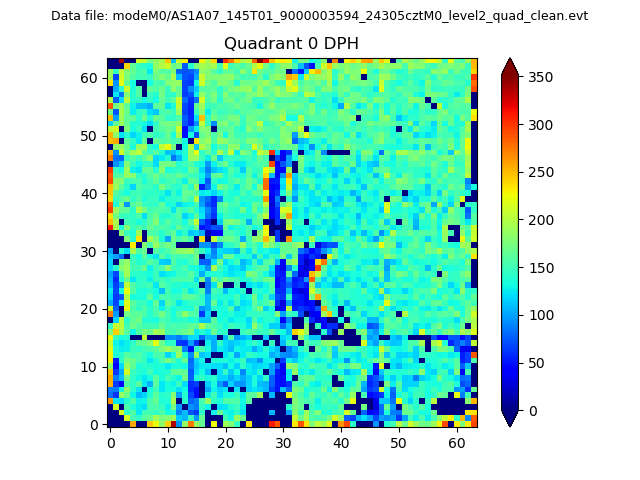 |
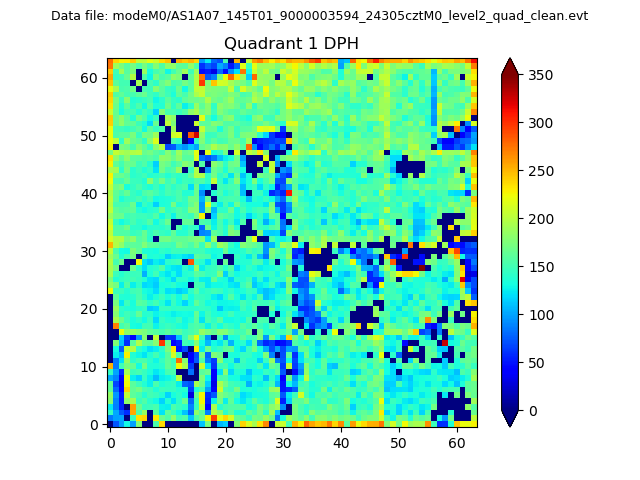 |
Quadrant B |
|---|---|---|---|
| Quadrant D | 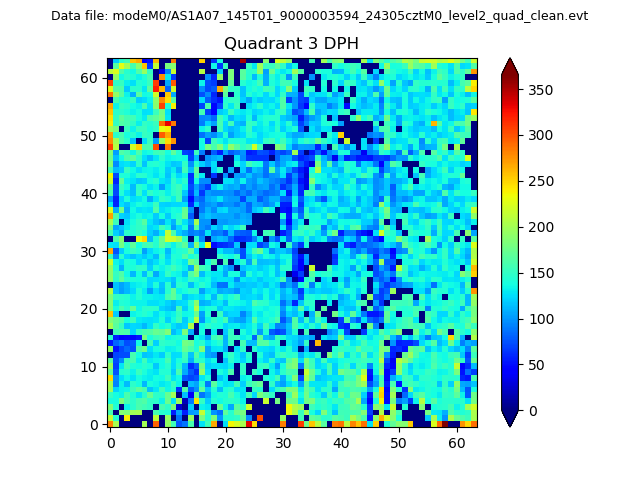 |
 |
Quadrant C |
| Plot type | Count rate plots | Images |
|---|---|---|
| Comparison with Poisson distribution Blue bars denote a histogram of data divided into 1 sec bins. Red curve is a Poisson curve with rate = median count rate of data. |
 |
 |
| Quadrant-wise count rates Data is divided into 100 sec bins |
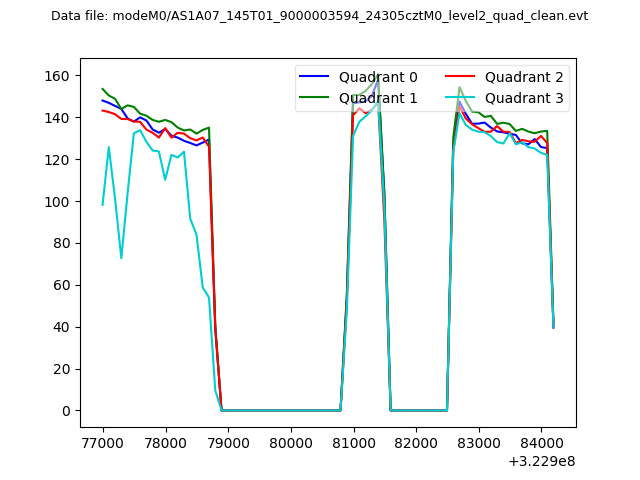 |
|
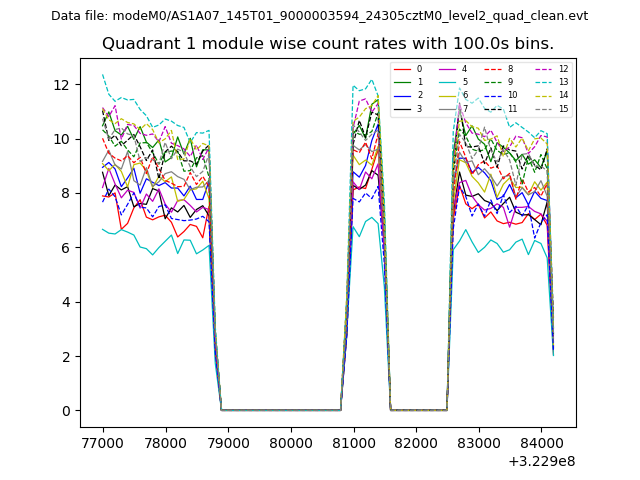
| Module-wise count rates for Quadrant A Data is divided into 100 sec bins |
 |
 |
| Module-wise count rates for Quadrant B Data is divided into 100 sec bins |
 |
 |
| Module-wise count rates for Quadrant C Data is divided into 100 sec bins |
 |
 |
| Module-wise count rates for Quadrant D Data is divided into 100 sec bins |
 |
 |
| Parameter | Plot |
|---|---|
| CZT HV Monitor |  |
| D_VDD | 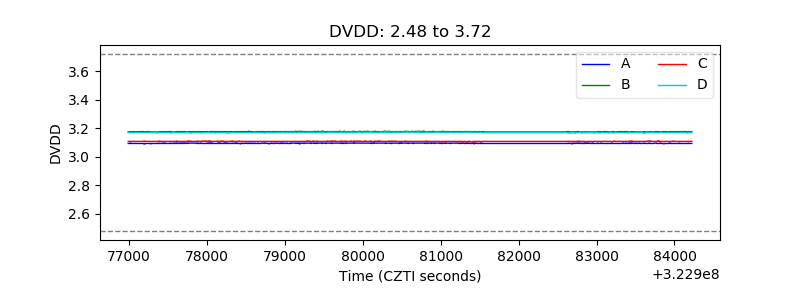 |
| Temperature 1 | 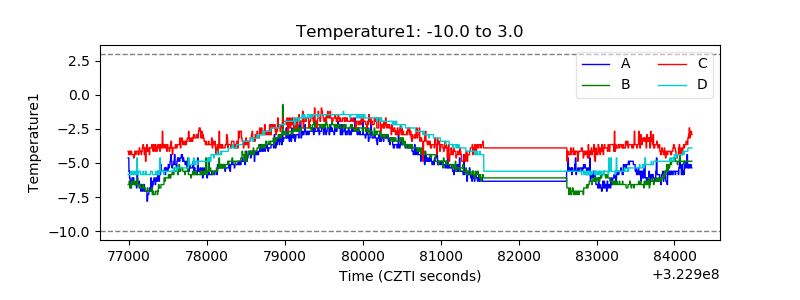 |
| Veto HV Monitor | 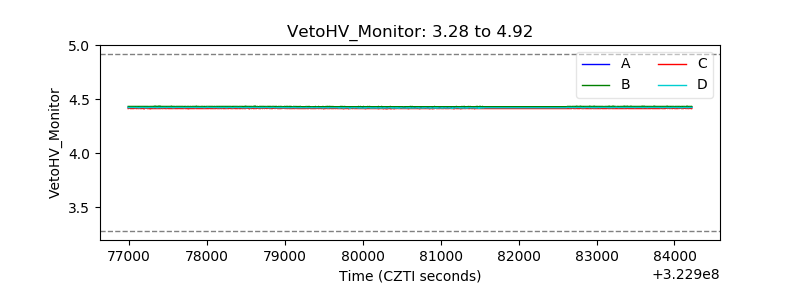 |
| Veto LLD | 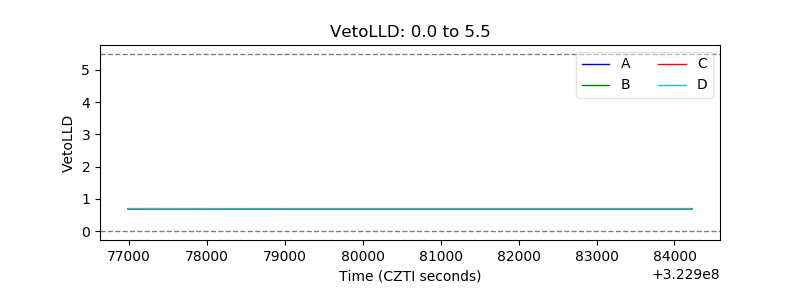 |
| Alpha Counter | 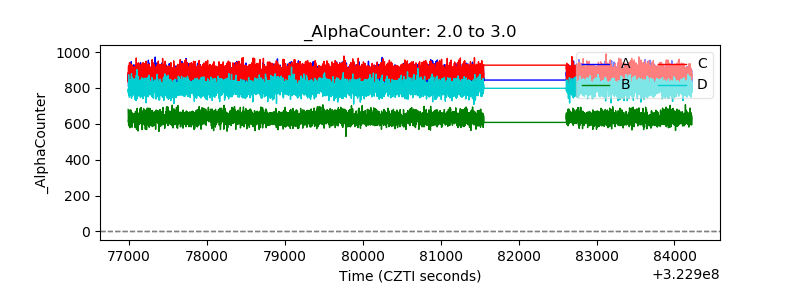 |
| _CPM_Rate | 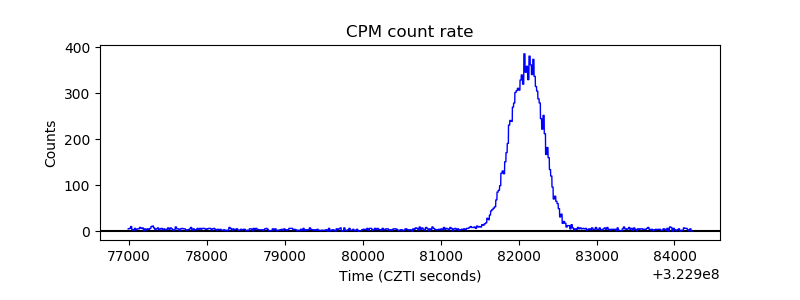 |
| CZT Counter | 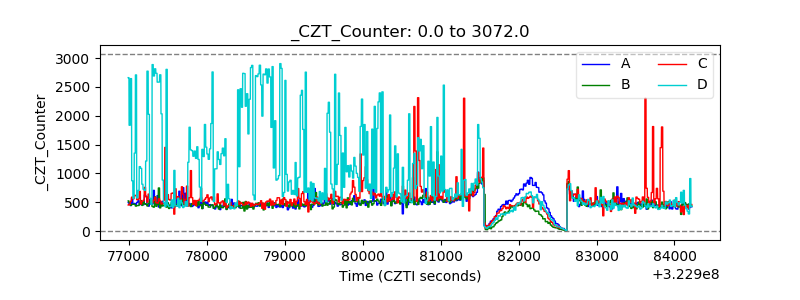 |
| +2.5 Volts monitor |  |
| +5 Volts monitor |  |
| _ROLL_ROT | 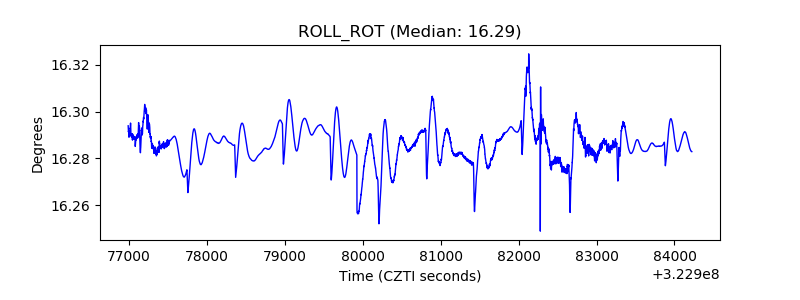 |
| _Roll_DEC | 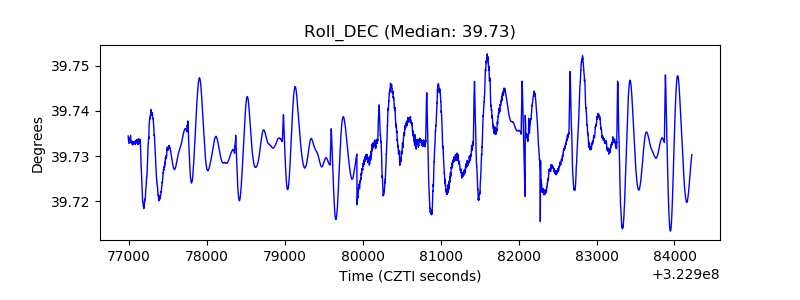 |
| _Roll_RA | 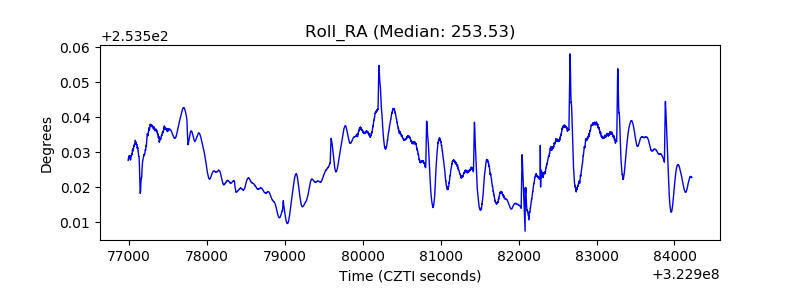 |
| Veto Counter |  |