| Param | Original file | Final file |
|---|---|---|
| Filename | modeM0/AS1A07_145T01_9000003594_24307cztM0_level2.evt | modeM0/AS1A07_145T01_9000003594_24307cztM0_level2_quad_clean.evt |
| Size (bytes) | 488,373,120 | 91,039,680 |
| Size | 465.7 MB | 86.8 MB |
| Events in quadrant A | 3,189,831 | 565,787 |
| Events in quadrant B | 3,264,175 | 584,310 |
| Events in quadrant C | 3,781,535 | 576,258 |
| Events in quadrant D | 4,091,936 | 555,894 |
| Mode M0 | |||
|---|---|---|---|
| Quadrant | BADHDUFLAG | Total packets | Discarded packets |
| A | 0 | 13941 | 1 |
| B | 0 | 13976 | 1 |
| C | 0 | 15416 | 1 |
| D | 0 | 16514 | 1 |
| Mode M9 | |||
|---|---|---|---|
| Quadrant | BADHDUFLAG | Total packets | Discarded packets |
| A | 0 | 3 | 0 |
| B | 0 | 3 | 0 |
| C | 0 | 3 | 0 |
| D | 0 | 3 | 0 |
| Mode SS | |||
|---|---|---|---|
| Quadrant | BADHDUFLAG | Total packets | Discarded packets |
| A | 0 | 138 | 0 |
| B | 0 | 138 | 0 |
| C | 0 | 138 | 0 |
| D | 0 | 138 | 0 |
| Quadrant | Total seconds | Saturated seconds | Saturation percentage |
|---|---|---|---|
| A | 6814 | 117 | 1.717053% |
| B | 6814 | 129 | 1.893161% |
| C | 6814 | 130 | 1.907837% |
| D | 6814 | 142 | 2.083945% |
Noise dominated data is calculated using 1-second bins in cleaned event files. If a bin has >2000 counts, and if more than 50% of those come from <1% of pixels, then it is considered to be noise-dominated and hence unusable.
| Quadrant | # 1 sec bins | Bins with >0 counts | Bins with >2000 counts | High rate bins dominated by noise | Noise dominated (total time) | Noise dominated (detector-on time) | Marked lightcurve |
|---|---|---|---|---|---|---|---|
| A | 7099 | 6814 | 0 | 0 | 0.00% | 0.00% | 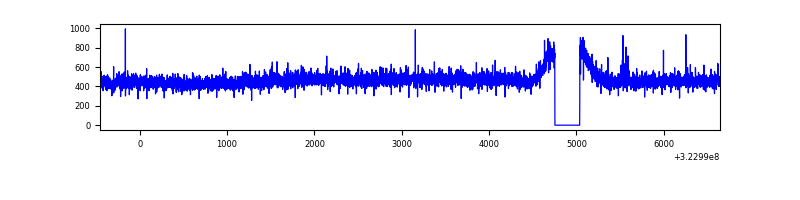 |
| B | 7099 | 6814 | 0 | 0 | 0.00% | 0.00% | 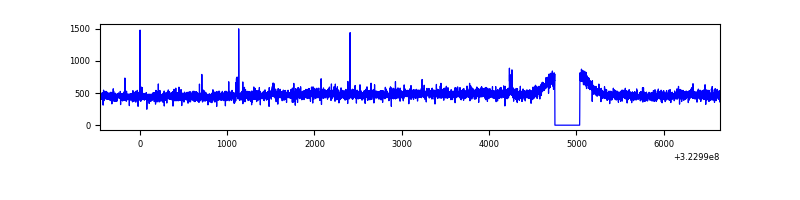 |
| C | 7099 | 6814 | 6 | 6 | 0.08% | 0.09% | 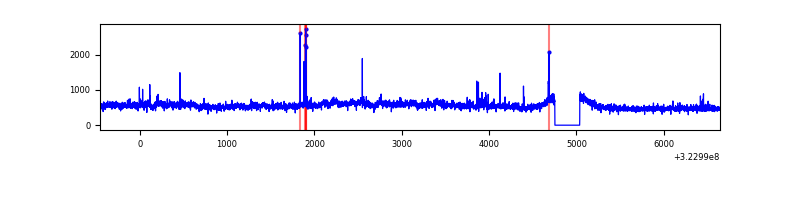 |
| D | 7099 | 6814 | 75 | 75 | 1.06% | 1.10% | 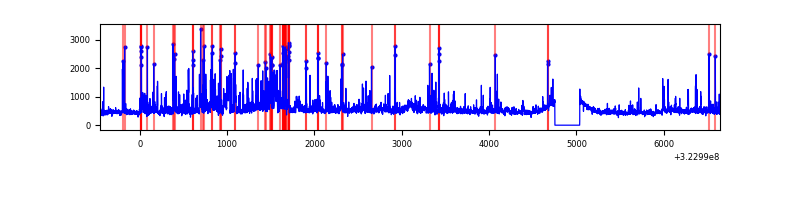 |
Top three noisy pixels from each quadrant. If the there are fewer than three noisy pixels in the level2.evt file, extra rows are filled as -1
| Pixel properties | Quadrant properties | ||||||
|---|---|---|---|---|---|---|---|
| Quadrant | DetID | PixID | Counts | Sigma | Mean | Median | Sigma |
| A | 13 | 254 | 10651 | 58.81 | 824 | 804 | 167.4 |
| A | 3 | 137 | 7770 | 41.6 | 824 | 804 | 167.4 |
| A | 0 | 226 | 7039 | 37.24 | 824 | 804 | 167.4 |
| B | 12 | 111 | 19672 | 119.5 | 824 | 803 | 157.9 |
| B | 11 | 111 | 17275 | 104.32 | 824 | 803 | 157.9 |
| B | 14 | 111 | 15673 | 94.17 | 824 | 803 | 157.9 |
| C | 7 | 247 | 468357 | 2527.21 | 793 | 799 | 185.0 |
| C | 14 | 238 | 126226 | 677.95 | 793 | 799 | 185.0 |
| C | 2 | 16 | 73362 | 392.21 | 793 | 799 | 185.0 |
| D | 1 | 52 | 828017 | 4226.25 | 801 | 775 | 195.7 |
| D | 12 | 233 | 197124 | 1003.12 | 801 | 775 | 195.7 |
| D | 2 | 234 | 26315 | 130.48 | 801 | 775 | 195.7 |
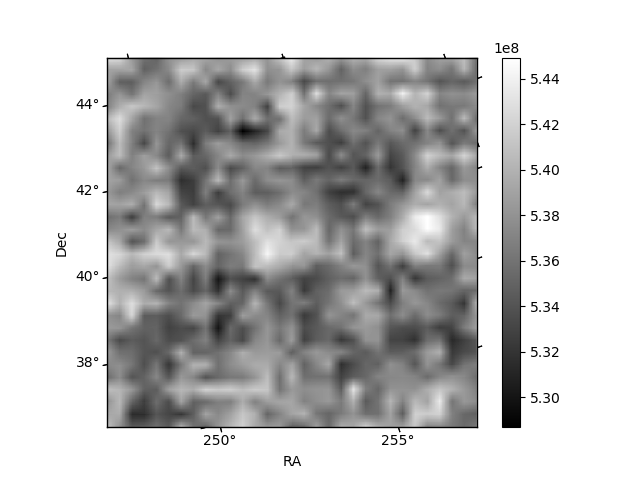
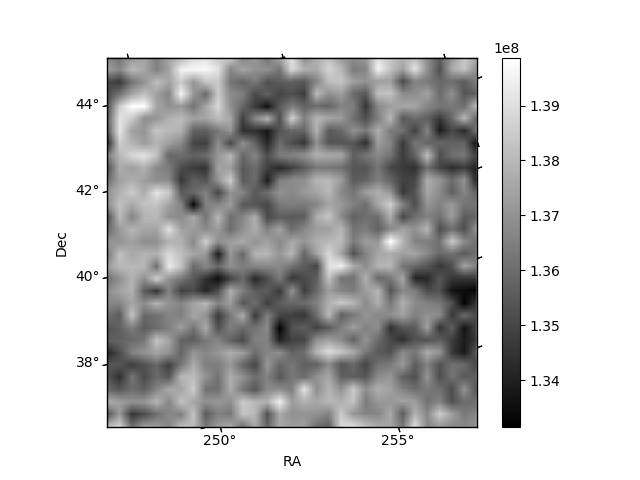
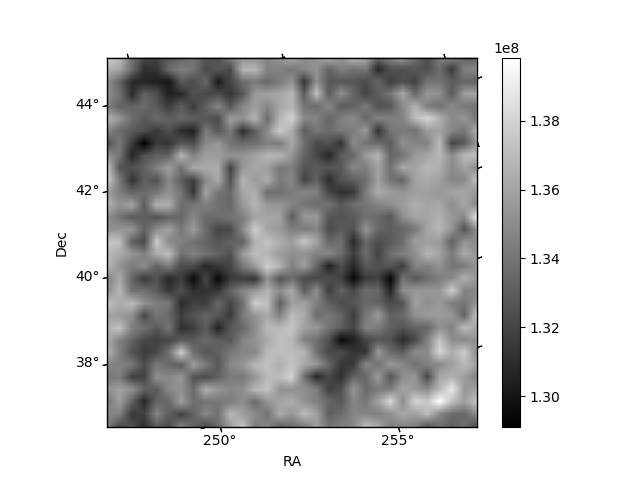
Histogram calculated using DETX and DETY for each event in the final _common_clean file
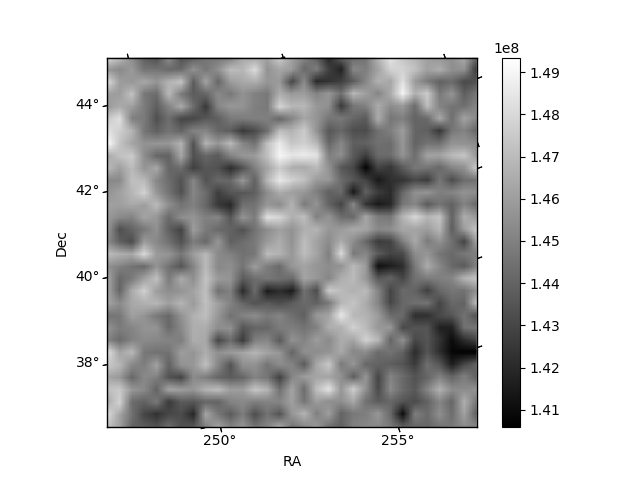
| Quadrant A | 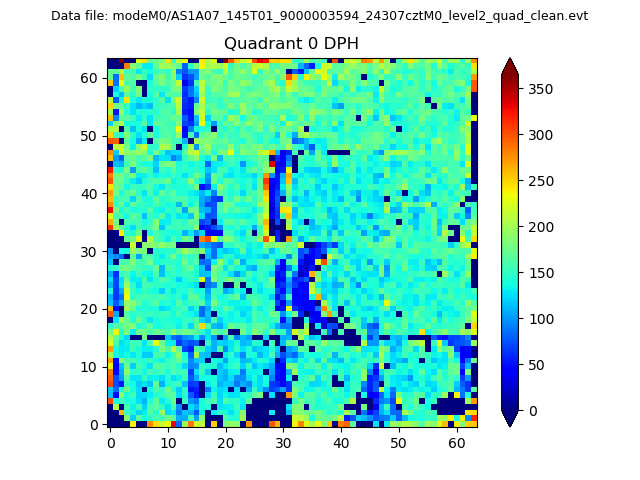 |
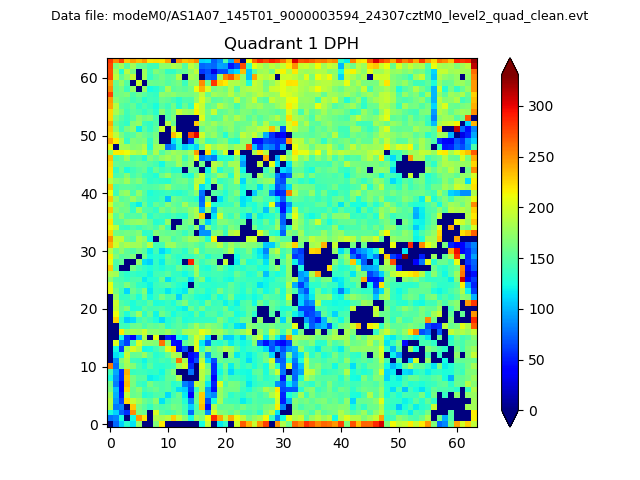 |
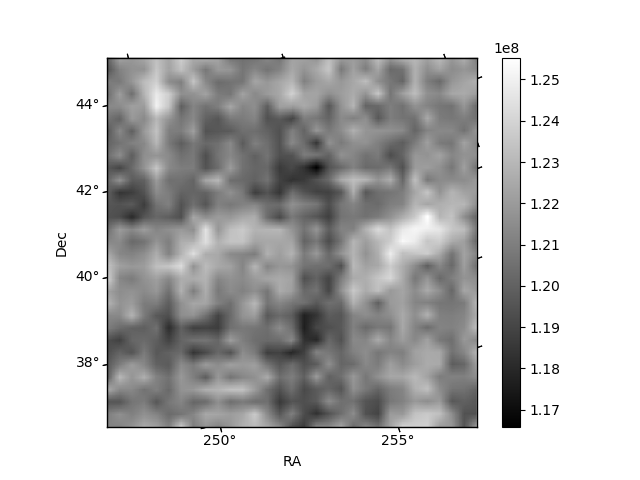
Quadrant B |
|---|---|---|---|
| Quadrant D | 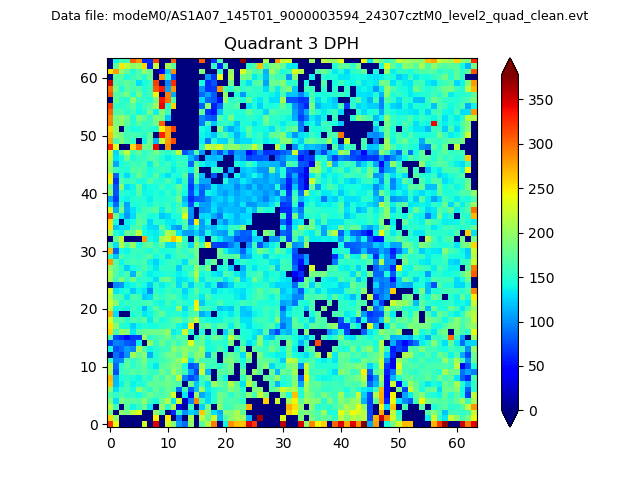 |
 |
Quadrant C |
| Plot type | Count rate plots | Images |
|---|---|---|
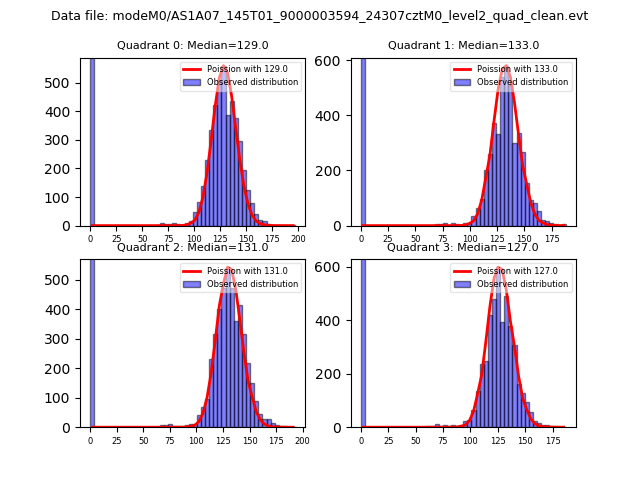
| Comparison with Poisson distribution Blue bars denote a histogram of data divided into 1 sec bins. Red curve is a Poisson curve with rate = median count rate of data. |
 |
 |
| Quadrant-wise count rates Data is divided into 100 sec bins |
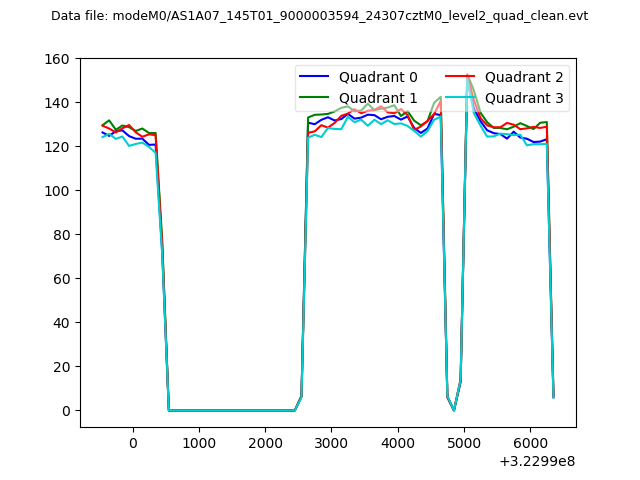 |
|
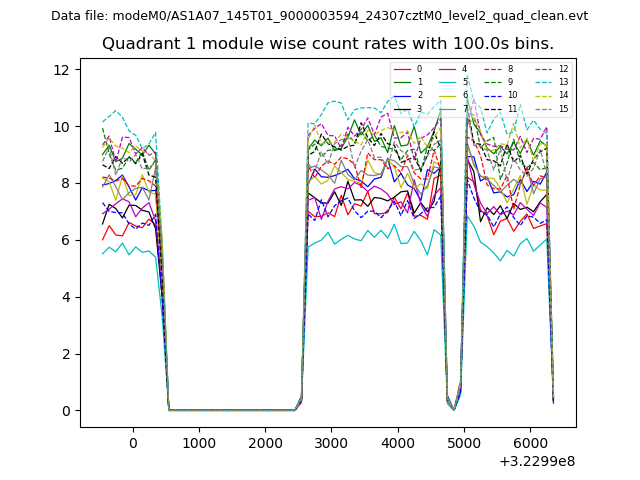
| Module-wise count rates for Quadrant A Data is divided into 100 sec bins |
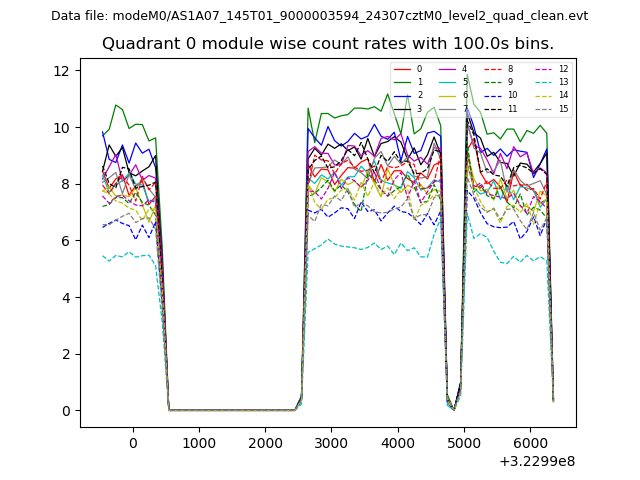 |
 |
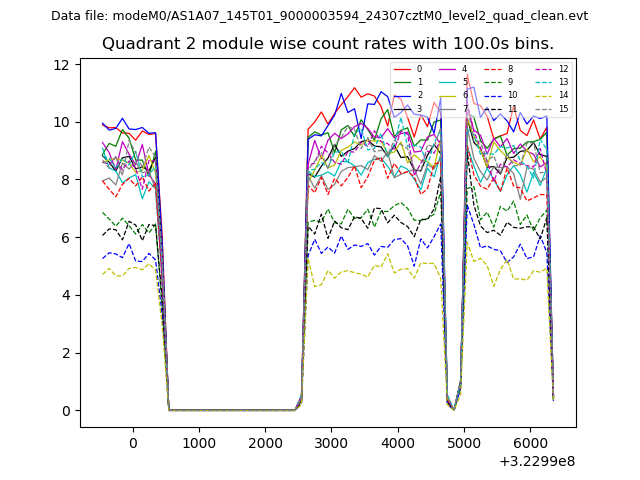
| Module-wise count rates for Quadrant B Data is divided into 100 sec bins |
 |
 |
| Module-wise count rates for Quadrant C Data is divided into 100 sec bins |
 |
 |
| Module-wise count rates for Quadrant D Data is divided into 100 sec bins |
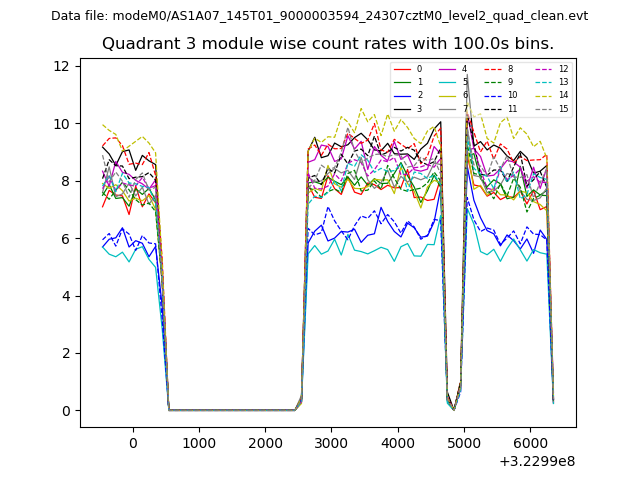 |
 |
| Parameter | Plot |
|---|---|
| CZT HV Monitor | 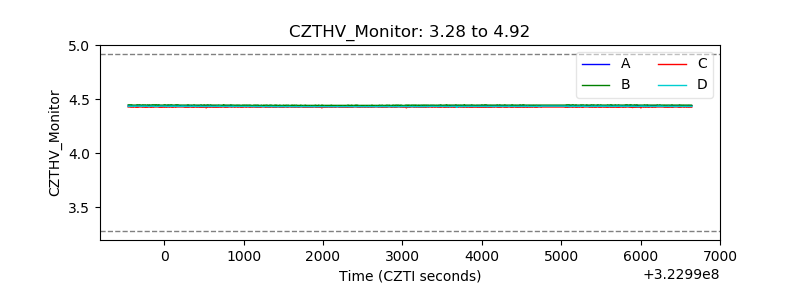 |
| D_VDD | 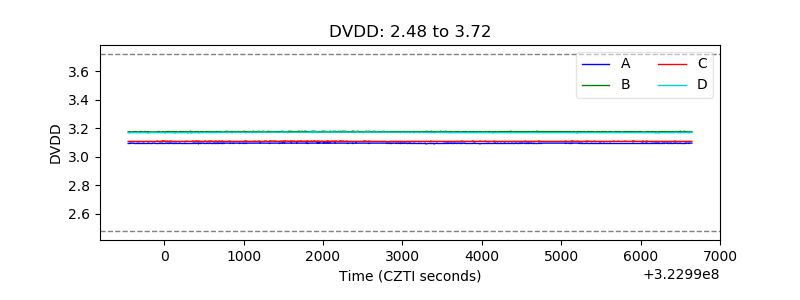 |
| Temperature 1 | 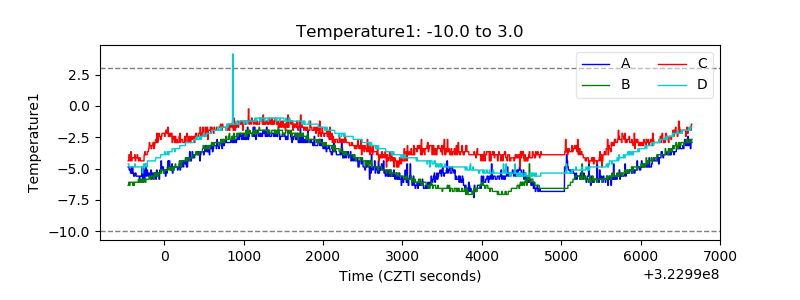 |
| Veto HV Monitor | 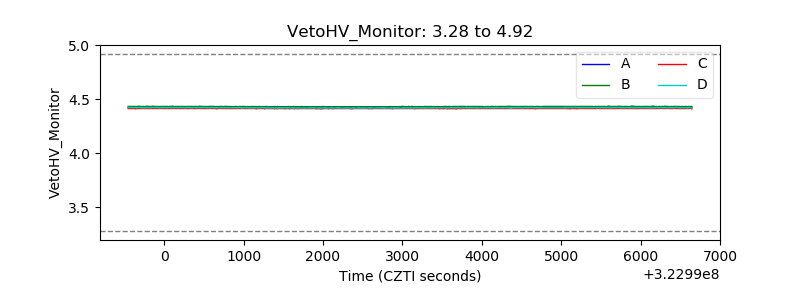 |
| Veto LLD | 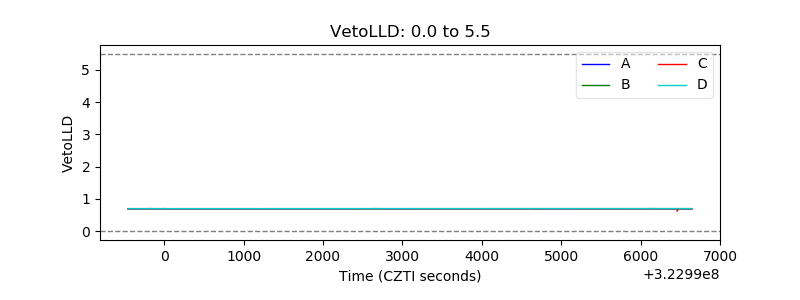 |
| Alpha Counter | 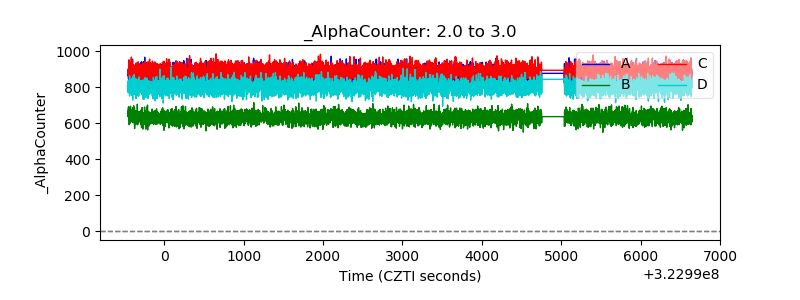 |
| _CPM_Rate | 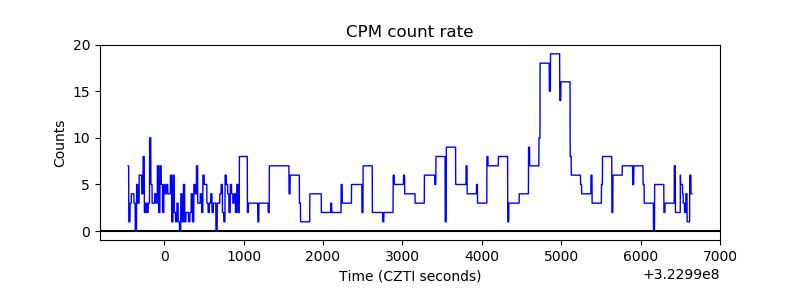 |
| CZT Counter | 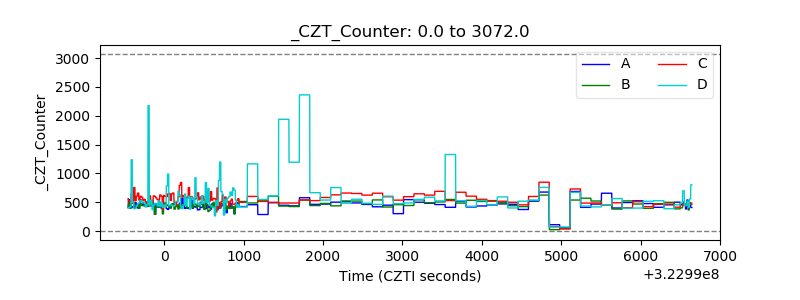 |
| +2.5 Volts monitor | 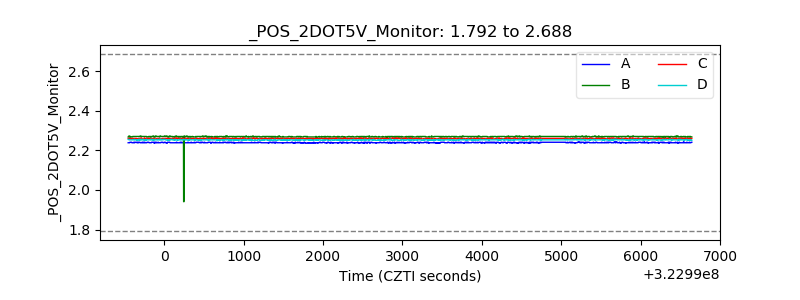 |
| +5 Volts monitor | 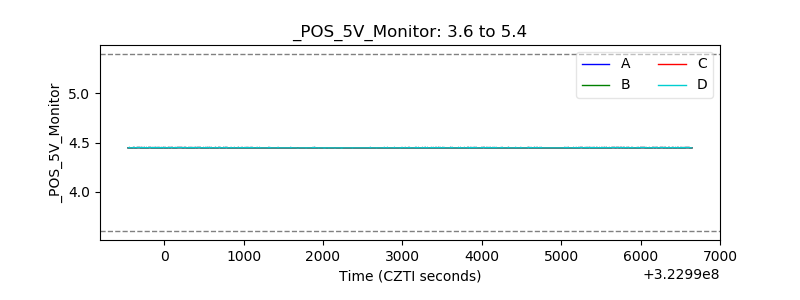 |
| _ROLL_ROT | 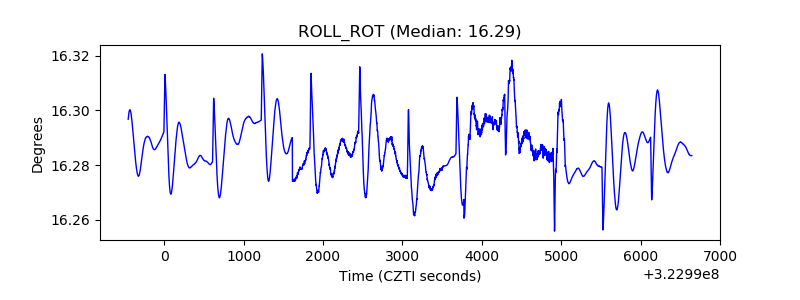 |
| _Roll_DEC |  |
| _Roll_RA | 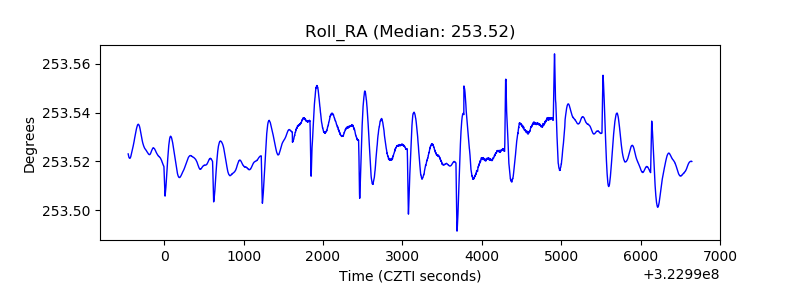 |
| Veto Counter | 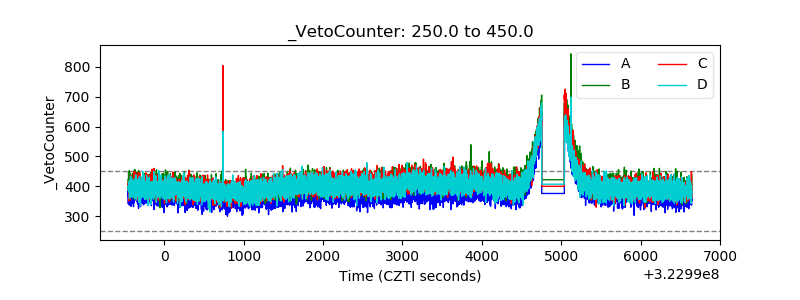 |