| Param | Original file | Final file |
|---|---|---|
| Filename | modeM0/AS1A07_145T01_9000003594_24312cztM0_level2.evt | modeM0/AS1A07_145T01_9000003594_24312cztM0_level2_quad_clean.evt |
| Size (bytes) | 1,744,617,600 | 286,280,640 |
| Size | 1.6 GB | 273.0 MB |
| Events in quadrant A | 11,143,059 | 1,771,997 |
| Events in quadrant B | 11,459,103 | 1,804,030 |
| Events in quadrant C | 15,070,926 | 1,761,957 |
| Events in quadrant D | 13,600,759 | 1,739,592 |
| Mode M0 | |||
|---|---|---|---|
| Quadrant | BADHDUFLAG | Total packets | Discarded packets |
| A | 0 | 48234 | 4 |
| B | 0 | 48649 | 4 |
| C | 0 | 61659 | 5 |
| D | 0 | 55618 | 4 |
| Mode M9 | |||
|---|---|---|---|
| Quadrant | BADHDUFLAG | Total packets | Discarded packets |
| A | 0 | 21 | 0 |
| B | 0 | 21 | 0 |
| C | 0 | 21 | 0 |
| D | 0 | 21 | 0 |
| Mode SS | |||
|---|---|---|---|
| Quadrant | BADHDUFLAG | Total packets | Discarded packets |
| A | 0 | 472 | 0 |
| B | 0 | 472 | 0 |
| C | 0 | 472 | 0 |
| D | 0 | 472 | 0 |
| Quadrant | Total seconds | Saturated seconds | Saturation percentage |
|---|---|---|---|
| A | 23140 | 392 | 1.694036% |
| B | 23141 | 549 | 2.372413% |
| C | 23140 | 669 | 2.891098% |
| D | 23140 | 846 | 3.656007% |
Noise dominated data is calculated using 1-second bins in cleaned event files. If a bin has >2000 counts, and if more than 50% of those come from <1% of pixels, then it is considered to be noise-dominated and hence unusable.
| Quadrant | # 1 sec bins | Bins with >0 counts | Bins with >2000 counts | High rate bins dominated by noise | Noise dominated (total time) | Noise dominated (detector-on time) | Marked lightcurve |
|---|---|---|---|---|---|---|---|
| A | 31867 | 23142 | 3 | 3 | 0.01% | 0.01% | 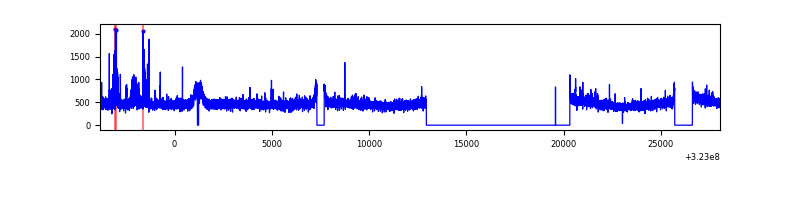 |
| B | 31868 | 23143 | 109 | 109 | 0.34% | 0.47% | 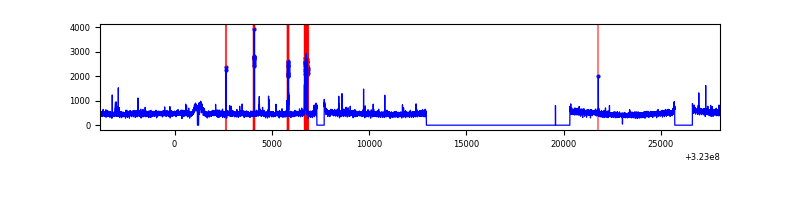 |
| C | 31868 | 23142 | 19 | 19 | 0.06% | 0.08% | 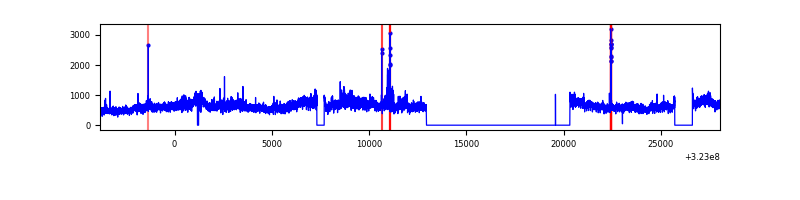 |
| D | 31868 | 23142 | 428 | 428 | 1.34% | 1.85% | 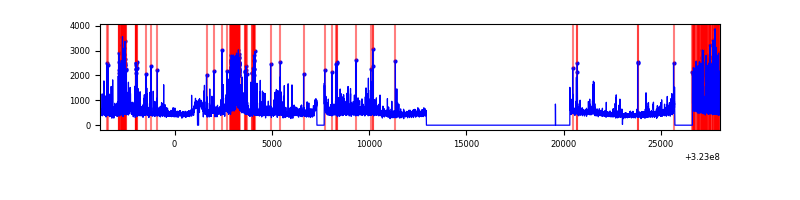 |
Top three noisy pixels from each quadrant. If the there are fewer than three noisy pixels in the level2.evt file, extra rows are filled as -1
| Pixel properties | Quadrant properties | ||||||
|---|---|---|---|---|---|---|---|
| Quadrant | DetID | PixID | Counts | Sigma | Mean | Median | Sigma |
| A | 3 | 1 | 248594 | 430.79 | 2823 | 2757 | 570.7 |
| A | 13 | 254 | 36790 | 59.64 | 2823 | 2757 | 570.7 |
| A | 3 | 137 | 26287 | 41.23 | 2823 | 2757 | 570.7 |
| B | 5 | 32 | 352150 | 650.53 | 2811 | 2740 | 537.1 |
| B | 12 | 111 | 66153 | 118.06 | 2811 | 2740 | 537.1 |
| B | 11 | 111 | 59393 | 105.48 | 2811 | 2740 | 537.1 |
| C | 7 | 247 | 3432362 | 5430.26 | 2721 | 2746 | 631.6 |
| C | 14 | 238 | 427917 | 673.19 | 2721 | 2746 | 631.6 |
| C | 2 | 16 | 421225 | 662.6 | 2721 | 2746 | 631.6 |
| D | 1 | 52 | 1926855 | 2894.58 | 2742 | 2655 | 664.8 |
| D | 12 | 233 | 982844 | 1474.5 | 2742 | 2655 | 664.8 |
| D | 8 | 195 | 189163 | 280.56 | 2742 | 2655 | 664.8 |
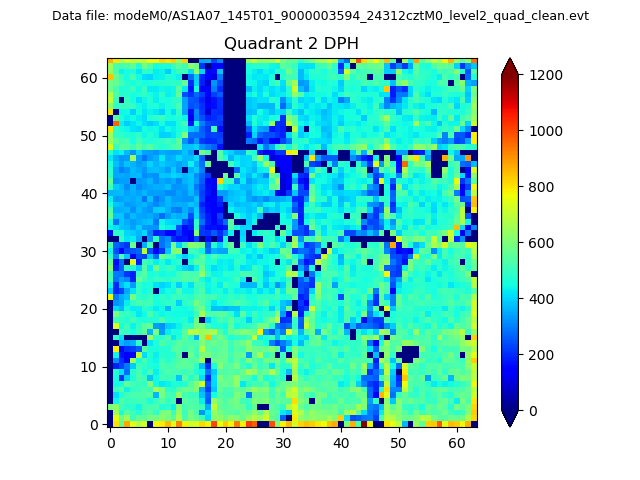
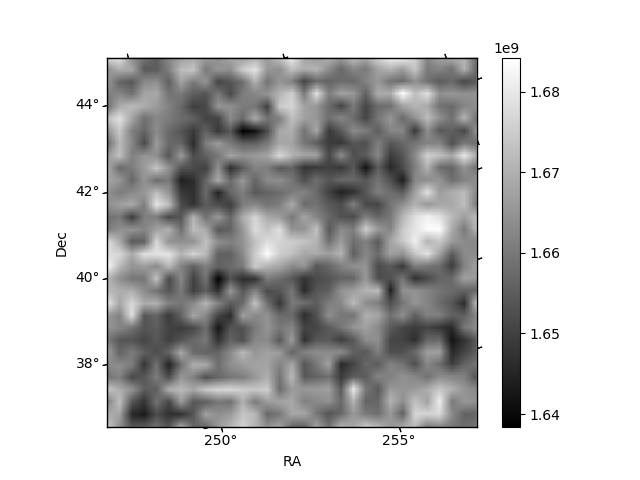
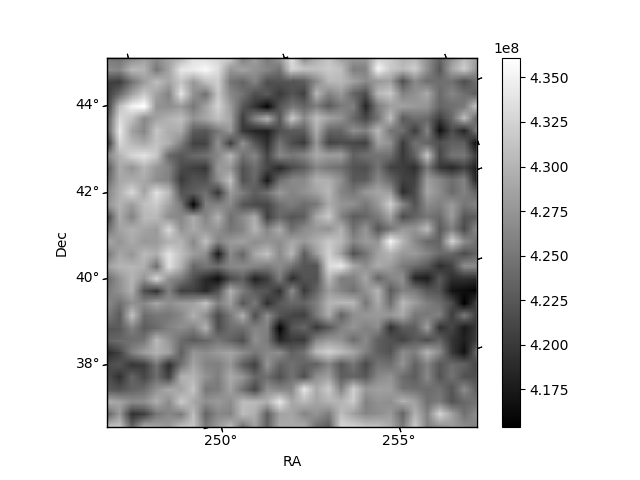
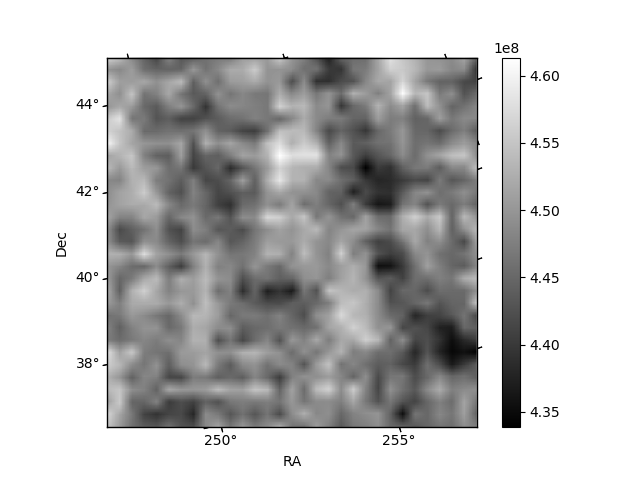
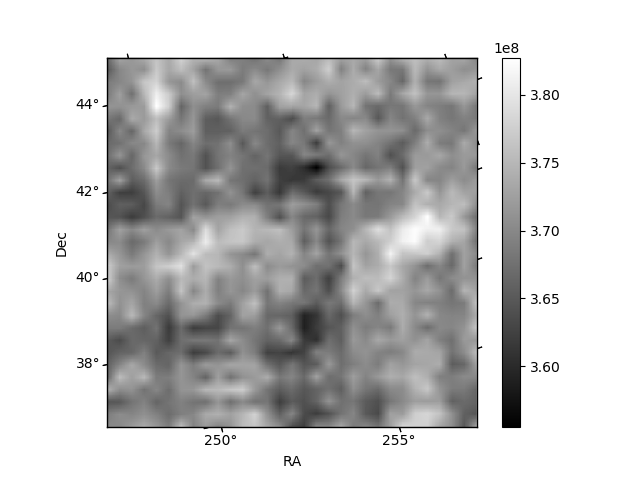
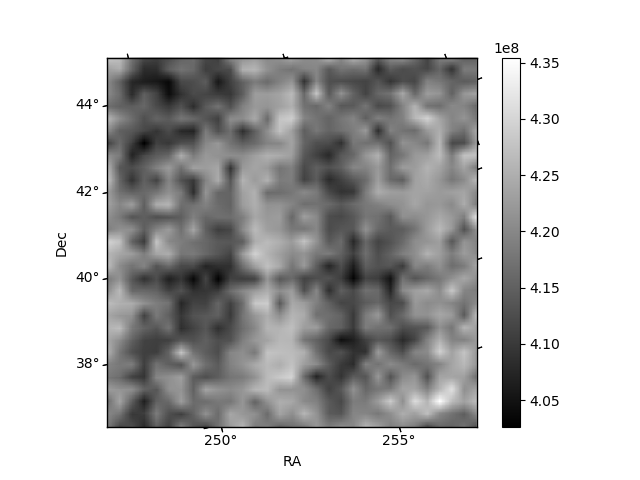
Histogram calculated using DETX and DETY for each event in the final _common_clean file
| Quadrant A | 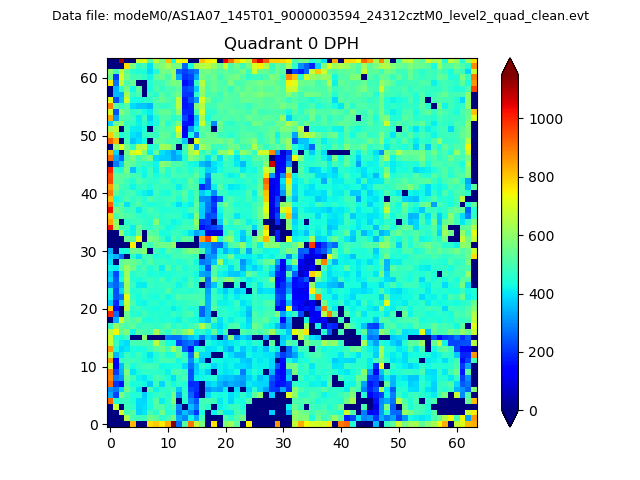 |
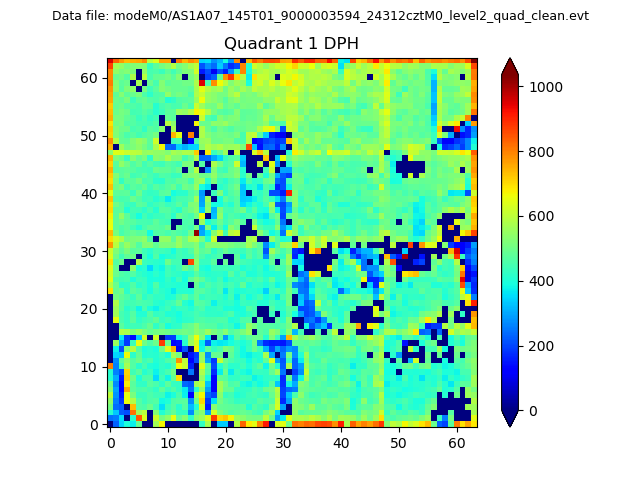 |
Quadrant B |
|---|---|---|---|
| Quadrant D | 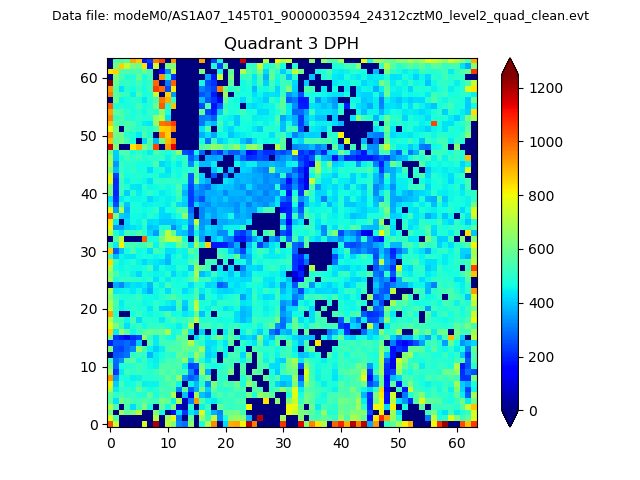 |
 |
Quadrant C |
| Plot type | Count rate plots | Images |
|---|---|---|
| Comparison with Poisson distribution Blue bars denote a histogram of data divided into 1 sec bins. Red curve is a Poisson curve with rate = median count rate of data. |
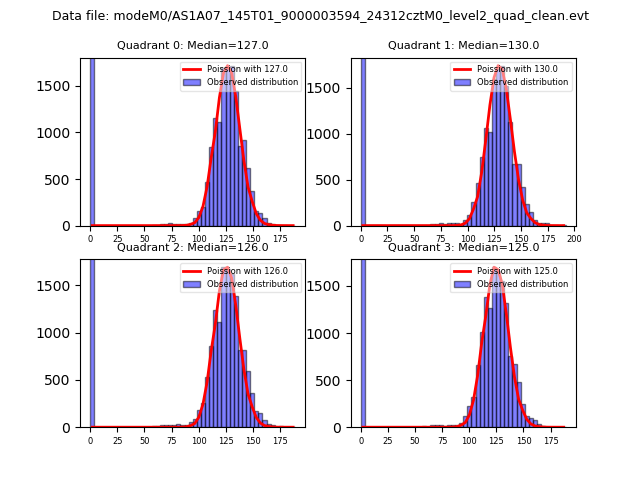 |
 |
| Quadrant-wise count rates Data is divided into 100 sec bins |
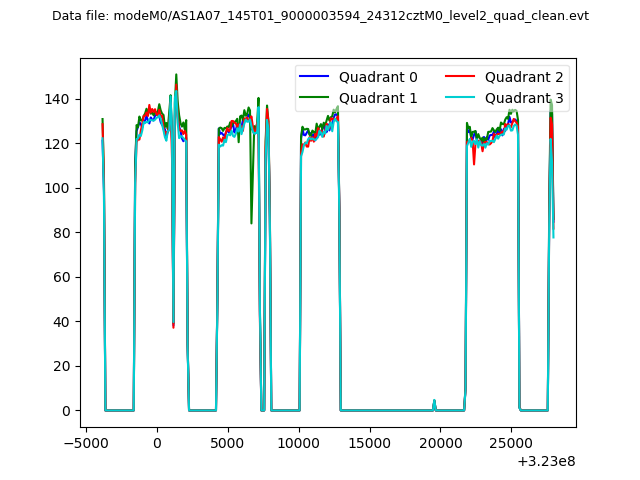 |
|
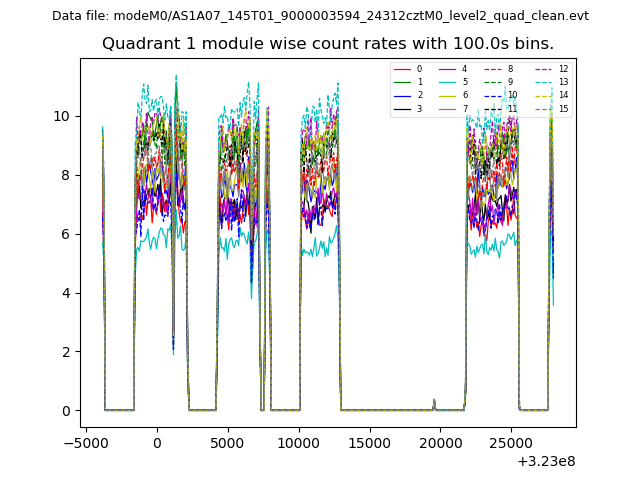
| Module-wise count rates for Quadrant A Data is divided into 100 sec bins |
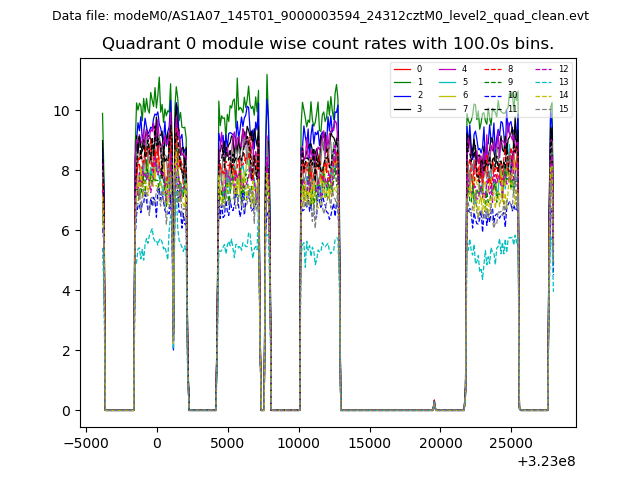 |
 |
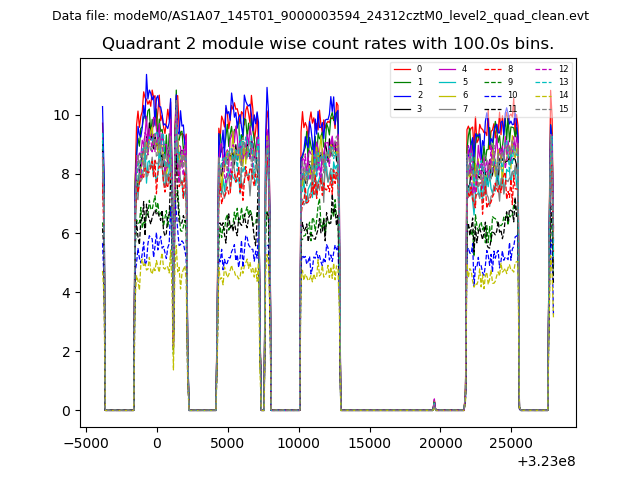
| Module-wise count rates for Quadrant B Data is divided into 100 sec bins |
 |
 |
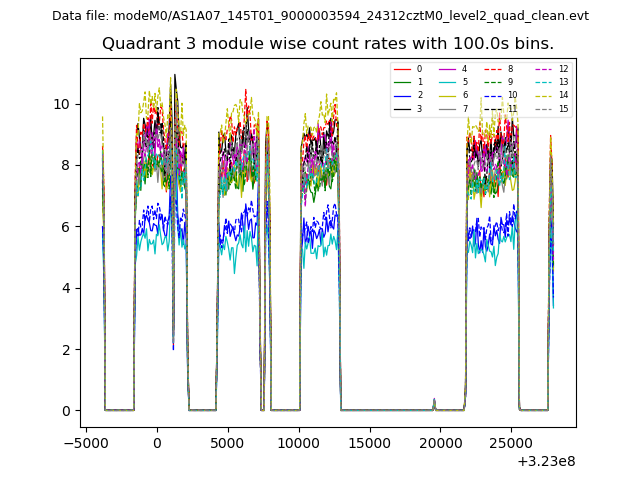
| Module-wise count rates for Quadrant C Data is divided into 100 sec bins |
 |
 |
| Module-wise count rates for Quadrant D Data is divided into 100 sec bins |
 |
 |
| Parameter | Plot |
|---|---|
| CZT HV Monitor | 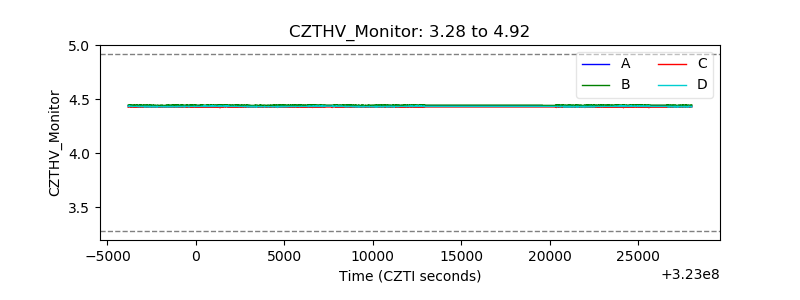 |
| D_VDD | 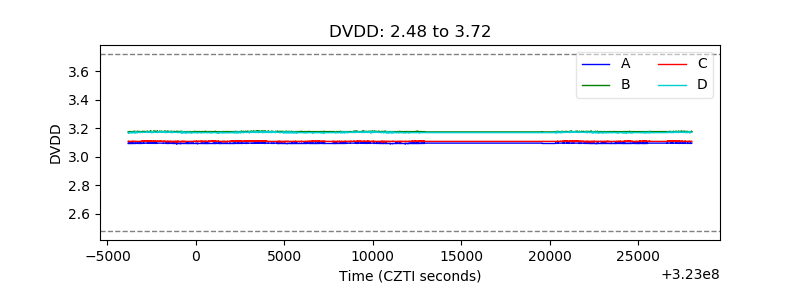 |
| Temperature 1 | 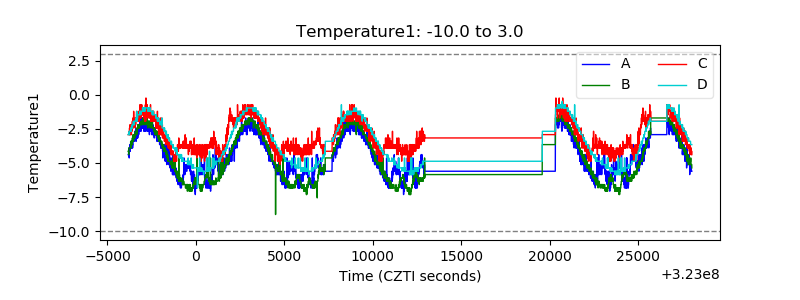 |
| Veto HV Monitor | 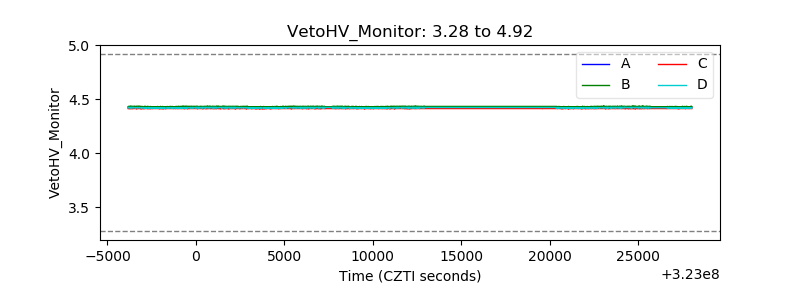 |
| Veto LLD | 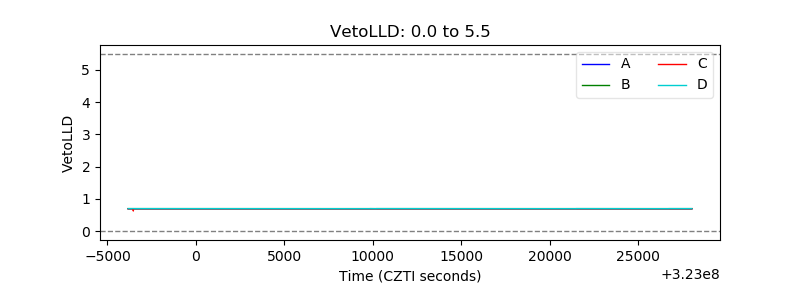 |
| Alpha Counter | 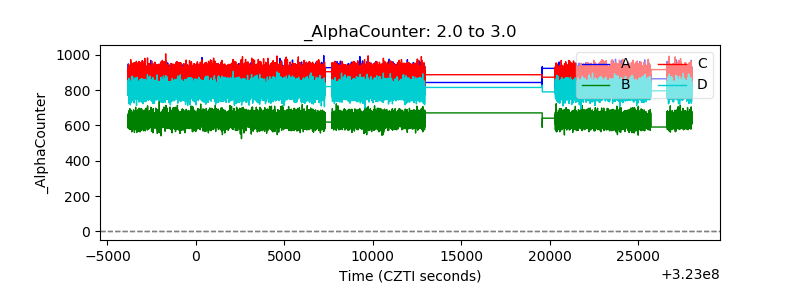 |
| _CPM_Rate | 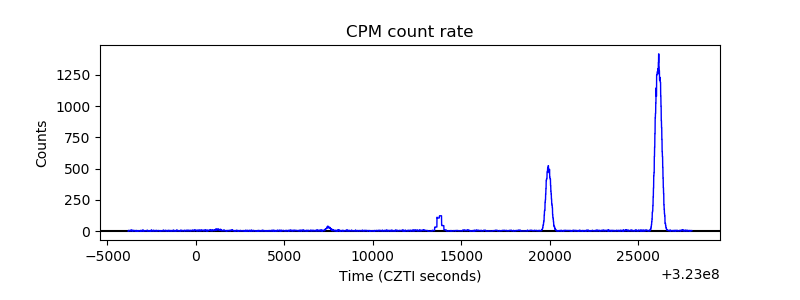 |
| CZT Counter | 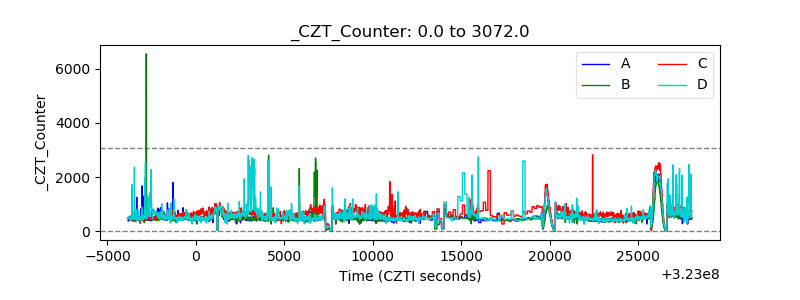 |
| +2.5 Volts monitor |  |
| +5 Volts monitor |  |
| _ROLL_ROT | 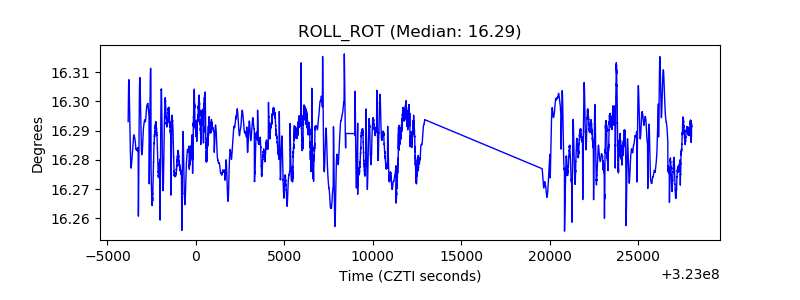 |
| _Roll_DEC | 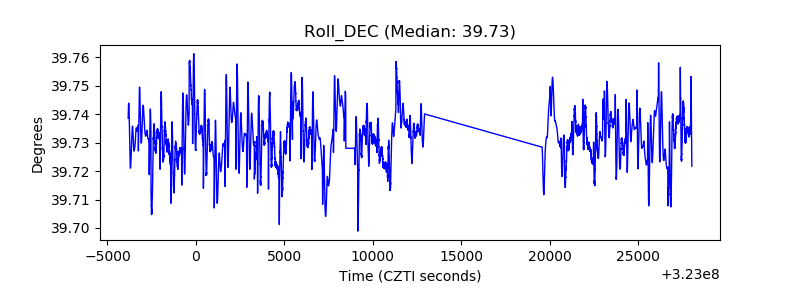 |
| _Roll_RA | 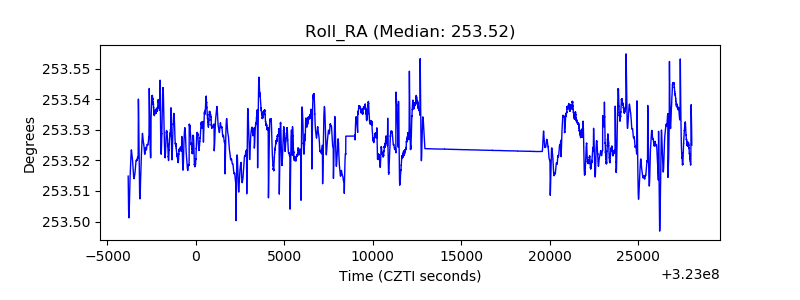 |
| Veto Counter | 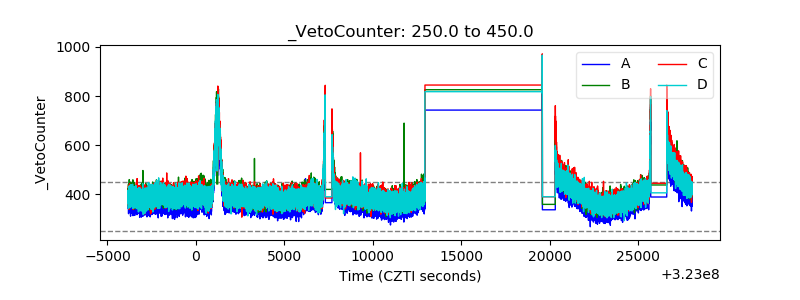 |