| Param | Original file | Final file |
|---|---|---|
| Filename | modeM0/AS1A07_145T01_9000003594_24315cztM0_level2.evt | modeM0/AS1A07_145T01_9000003594_24315cztM0_level2_quad_clean.evt |
| Size (bytes) | 546,468,480 | 100,529,280 |
| Size | 521.2 MB | 95.9 MB |
| Events in quadrant A | 3,266,618 | 647,613 |
| Events in quadrant B | 3,345,077 | 672,599 |
| Events in quadrant C | 5,418,070 | 641,985 |
| Events in quadrant D | 4,080,547 | 629,883 |
| Mode M0 | |||
|---|---|---|---|
| Quadrant | BADHDUFLAG | Total packets | Discarded packets |
| A | 0 | 14033 | 2 |
| B | 0 | 14229 | 2 |
| C | 0 | 20824 | 2 |
| D | 0 | 16568 | 2 |
| Mode M9 | |||
|---|---|---|---|
| Quadrant | BADHDUFLAG | Total packets | Discarded packets |
| A | 0 | 22 | 0 |
| B | 0 | 22 | 0 |
| C | 0 | 22 | 0 |
| D | 0 | 22 | 0 |
| Mode SS | |||
|---|---|---|---|
| Quadrant | BADHDUFLAG | Total packets | Discarded packets |
| A | 0 | 134 | 0 |
| B | 0 | 134 | 0 |
| C | 0 | 134 | 0 |
| D | 0 | 134 | 0 |
| Quadrant | Total seconds | Saturated seconds | Saturation percentage |
|---|---|---|---|
| A | 6485 | 57 | 0.878951% |
| B | 6485 | 71 | 1.094834% |
| C | 6485 | 415 | 6.399383% |
| D | 6486 | 189 | 2.913969% |
Noise dominated data is calculated using 1-second bins in cleaned event files. If a bin has >2000 counts, and if more than 50% of those come from <1% of pixels, then it is considered to be noise-dominated and hence unusable.
| Quadrant | # 1 sec bins | Bins with >0 counts | Bins with >2000 counts | High rate bins dominated by noise | Noise dominated (total time) | Noise dominated (detector-on time) | Marked lightcurve |
|---|---|---|---|---|---|---|---|
| A | 8735 | 6485 | 0 | 0 | 0.00% | 0.00% | 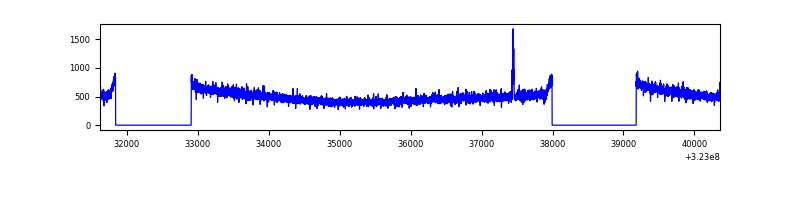 |
| B | 8735 | 6485 | 0 | 0 | 0.00% | 0.00% | 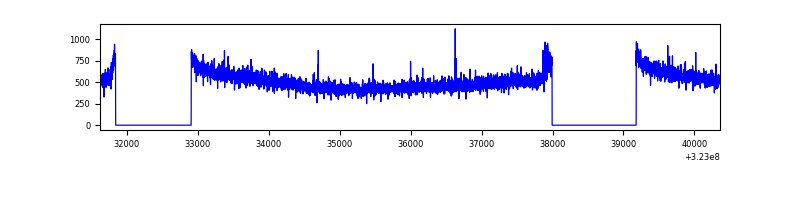 |
| C | 8735 | 6485 | 142 | 142 | 1.63% | 2.19% | 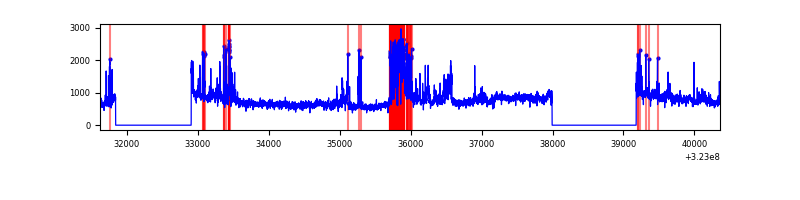 |
| D | 8736 | 6486 | 95 | 95 | 1.09% | 1.46% | 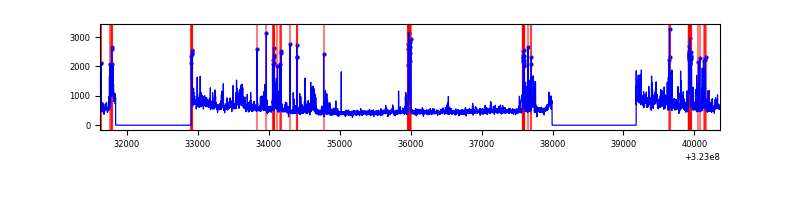 |
Top three noisy pixels from each quadrant. If the there are fewer than three noisy pixels in the level2.evt file, extra rows are filled as -1
| Pixel properties | Quadrant properties | ||||||
|---|---|---|---|---|---|---|---|
| Quadrant | DetID | PixID | Counts | Sigma | Mean | Median | Sigma |
| A | 3 | 1 | 24709 | 142.66 | 840 | 823 | 167.4 |
| A | 13 | 254 | 9527 | 51.98 | 840 | 823 | 167.4 |
| A | 3 | 137 | 7496 | 39.85 | 840 | 823 | 167.4 |
| B | 12 | 111 | 19025 | 112.9 | 849 | 830 | 161.2 |
| B | 11 | 111 | 16909 | 99.77 | 849 | 830 | 161.2 |
| B | 14 | 111 | 15234 | 89.37 | 849 | 830 | 161.2 |
| C | 7 | 247 | 1296254 | 6855.96 | 816 | 824 | 188.9 |
| C | 2 | 16 | 798754 | 4222.98 | 816 | 824 | 188.9 |
| C | 14 | 238 | 128933 | 678.01 | 816 | 824 | 188.9 |
| D | 1 | 52 | 474087 | 2356.61 | 826 | 801 | 200.8 |
| D | 12 | 218 | 330743 | 1642.86 | 826 | 801 | 200.8 |
| D | 12 | 233 | 57316 | 281.4 | 826 | 801 | 200.8 |
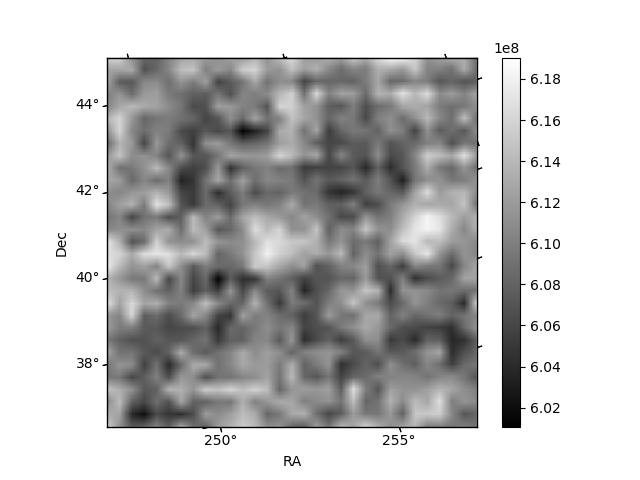
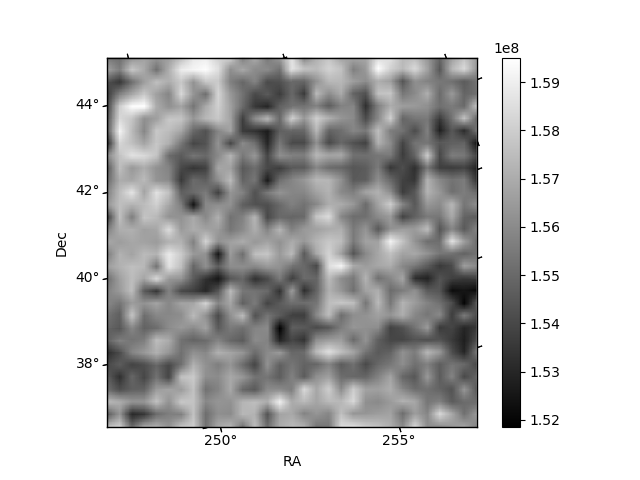
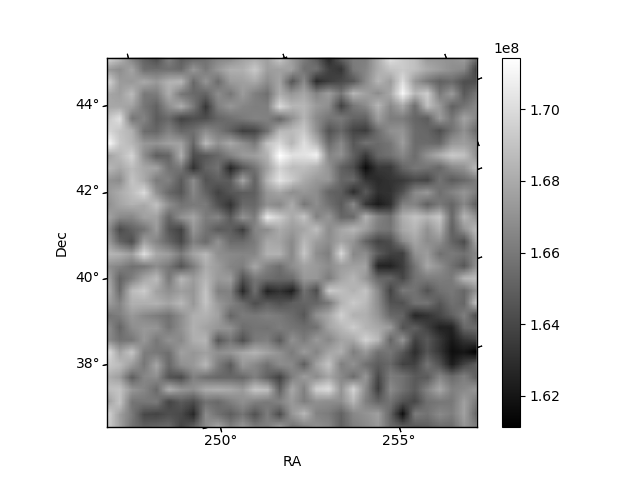
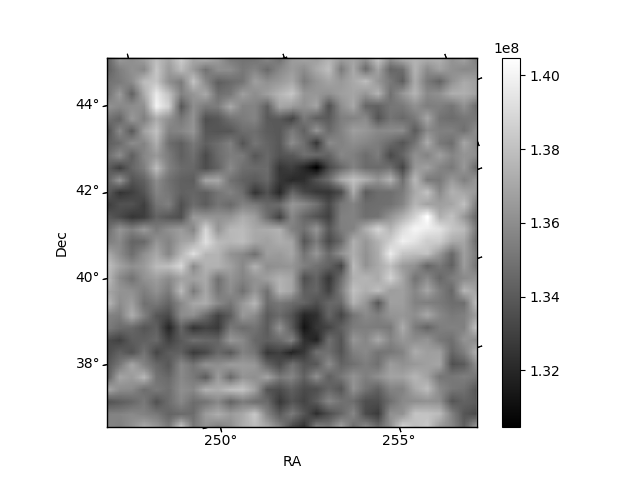
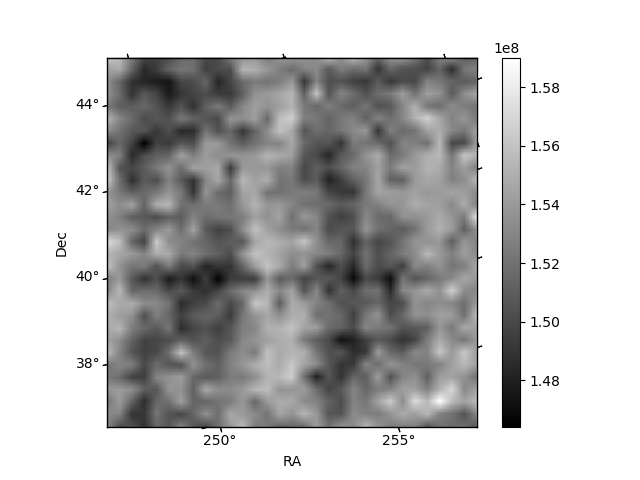
Histogram calculated using DETX and DETY for each event in the final _common_clean file
| Quadrant A | 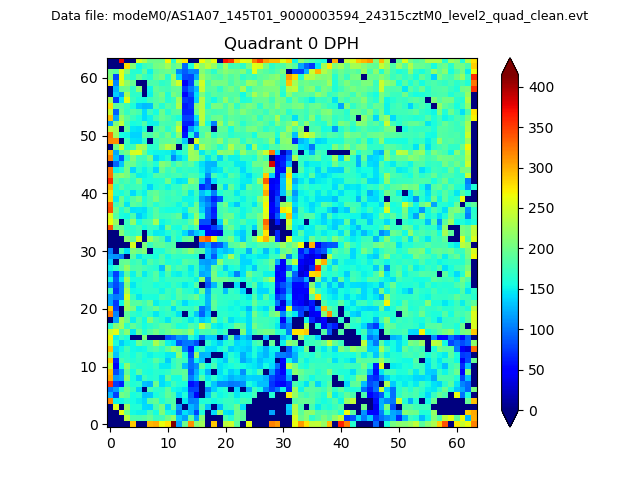 |
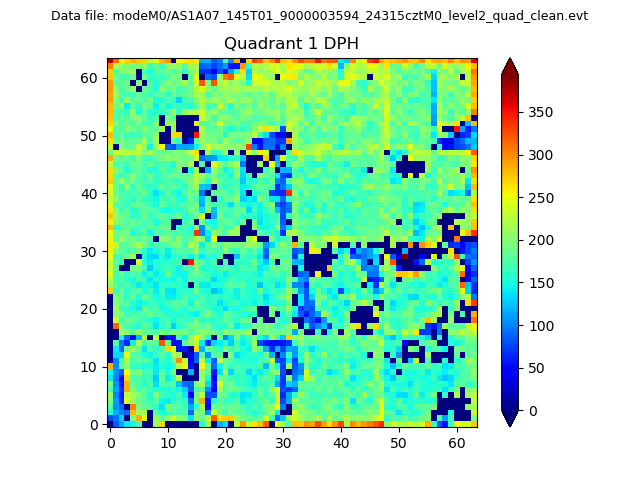 |
Quadrant B |
|---|---|---|---|
| Quadrant D | 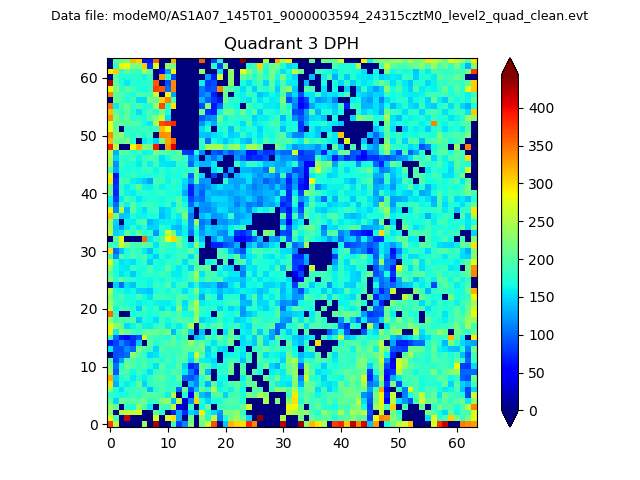 |
 |
Quadrant C |
| Plot type | Count rate plots | Images |
|---|---|---|
| Comparison with Poisson distribution Blue bars denote a histogram of data divided into 1 sec bins. Red curve is a Poisson curve with rate = median count rate of data. |
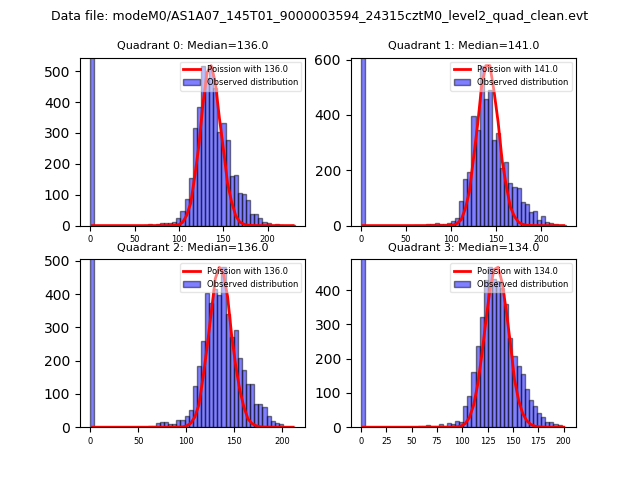 |
 |
| Quadrant-wise count rates Data is divided into 100 sec bins |
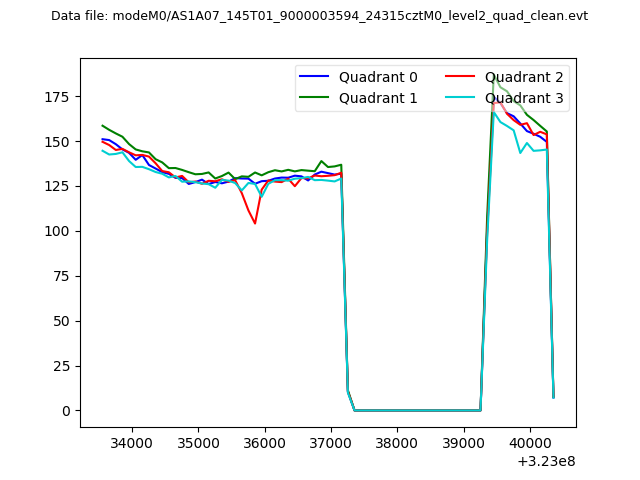 |
|
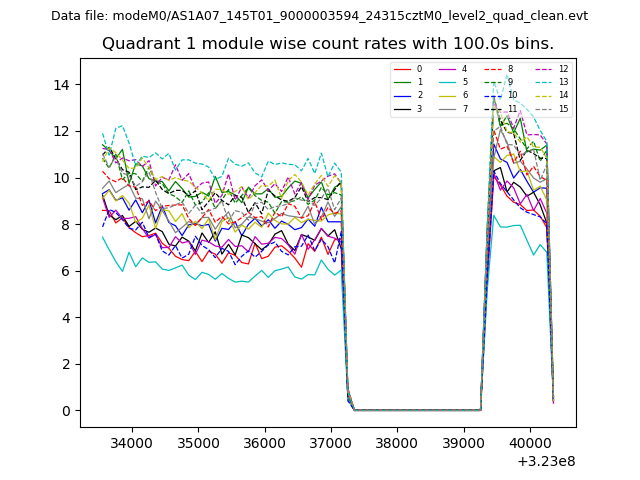
| Module-wise count rates for Quadrant A Data is divided into 100 sec bins |
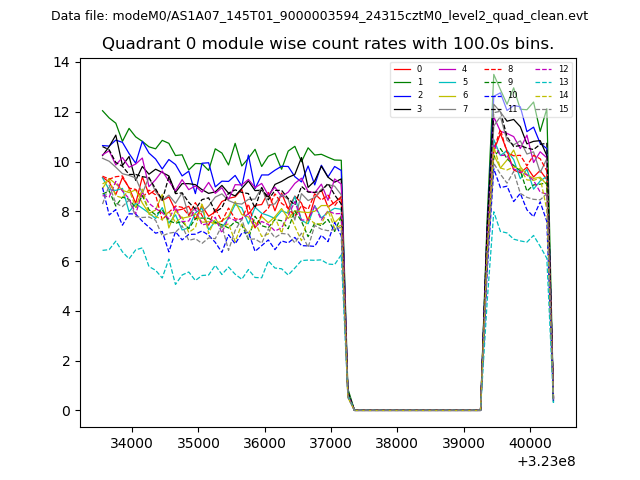 |
 |
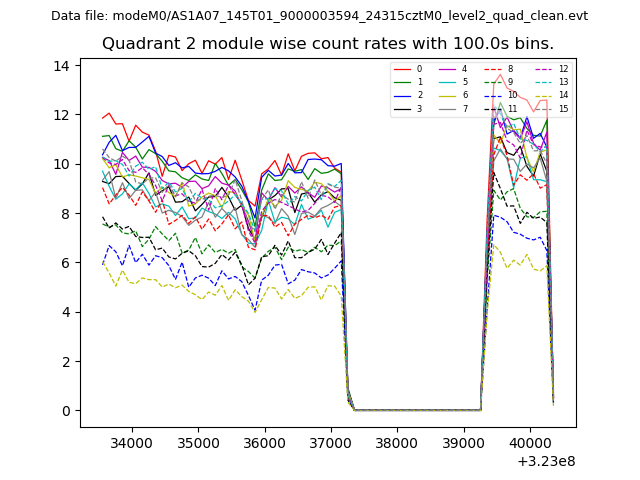
| Module-wise count rates for Quadrant B Data is divided into 100 sec bins |
 |
 |
| Module-wise count rates for Quadrant C Data is divided into 100 sec bins |
 |
 |
| Module-wise count rates for Quadrant D Data is divided into 100 sec bins |
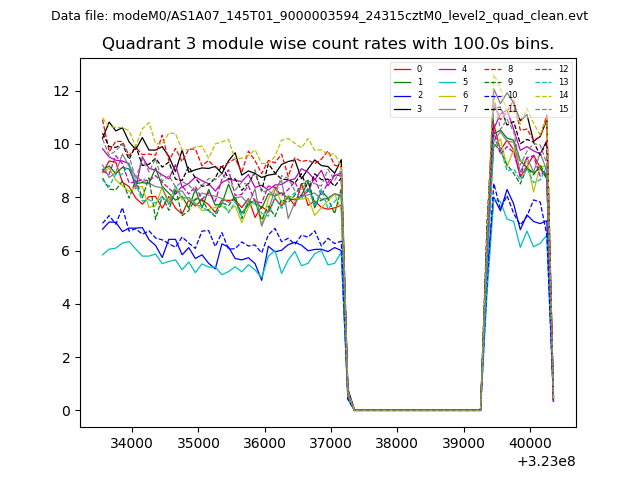 |
 |
| Parameter | Plot |
|---|---|
| CZT HV Monitor | 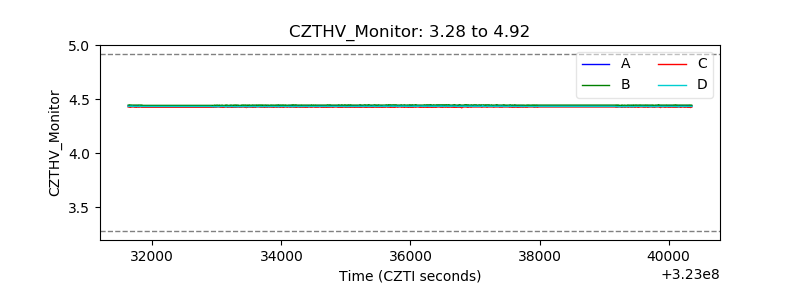 |
| D_VDD | 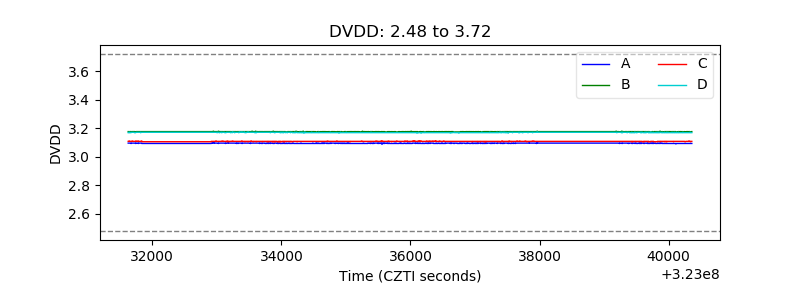 |
| Temperature 1 | 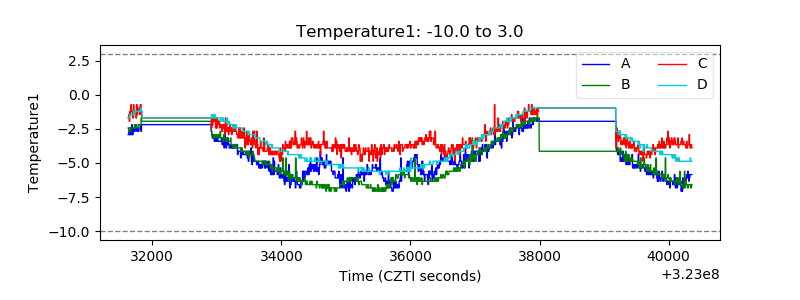 |
| Veto HV Monitor | 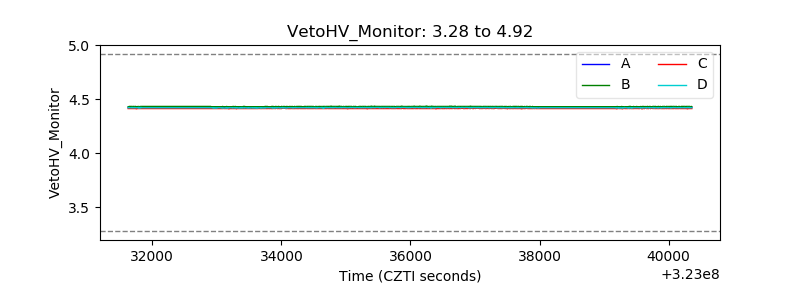 |
| Veto LLD | 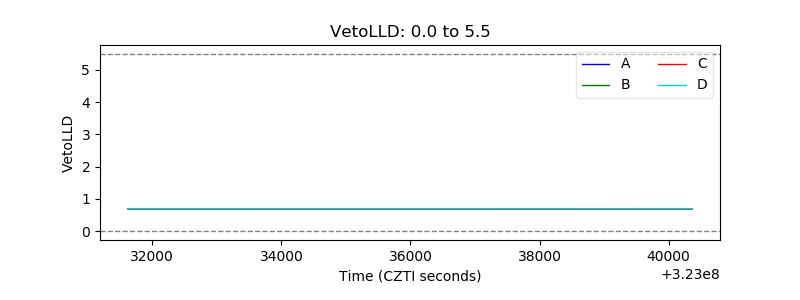 |
| Alpha Counter | 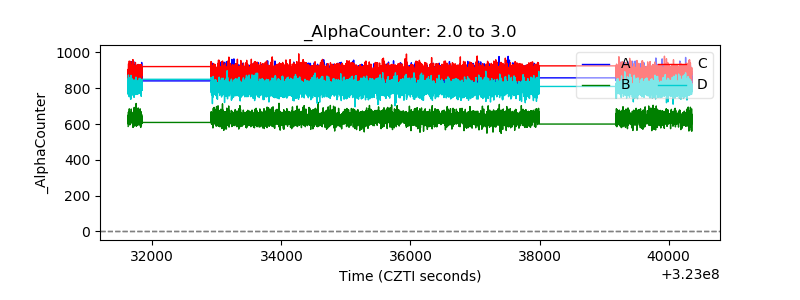 |
| _CPM_Rate | 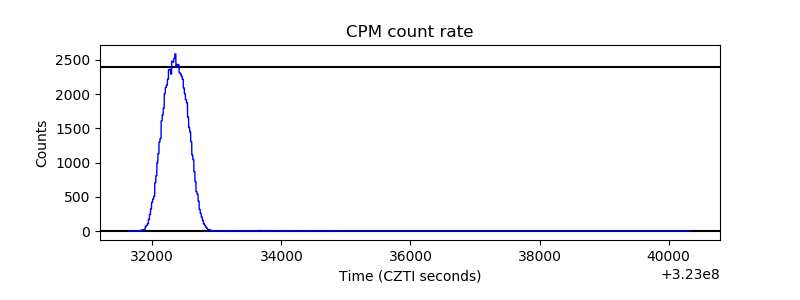 |
| CZT Counter | 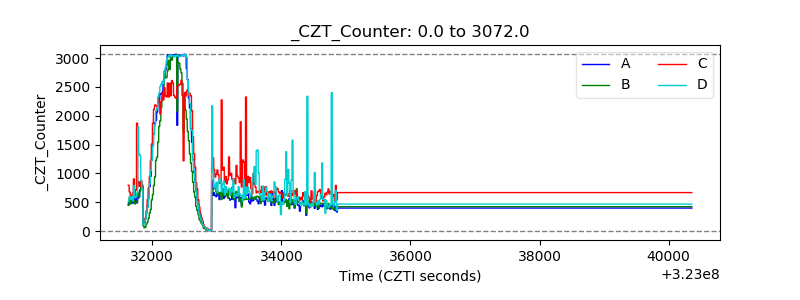 |
| +2.5 Volts monitor |  |
| +5 Volts monitor | 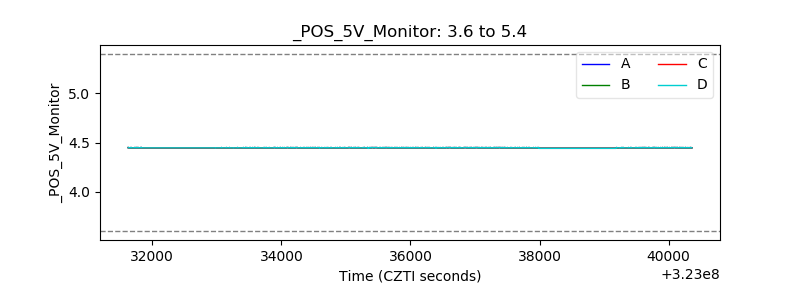 |
| _ROLL_ROT | 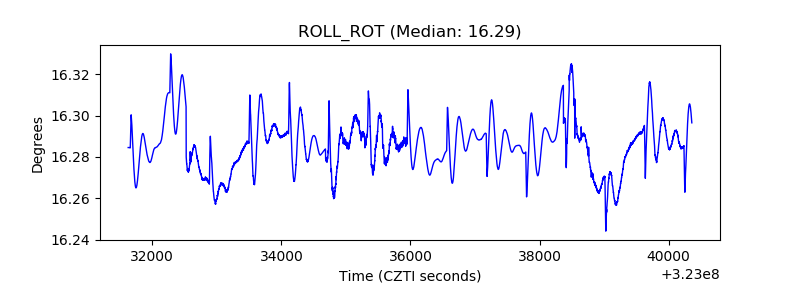 |
| _Roll_DEC | 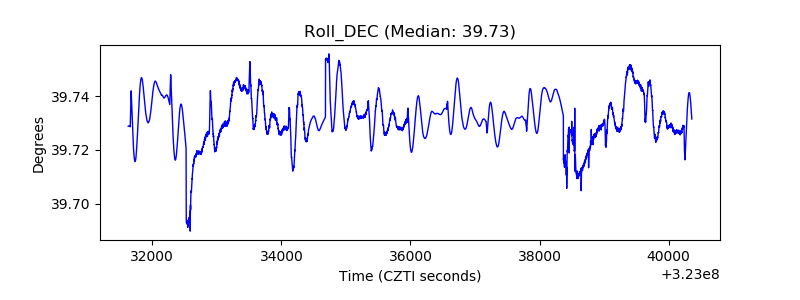 |
| _Roll_RA | 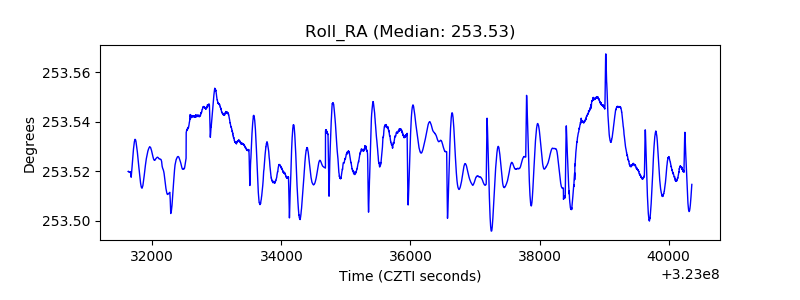 |
| Veto Counter | 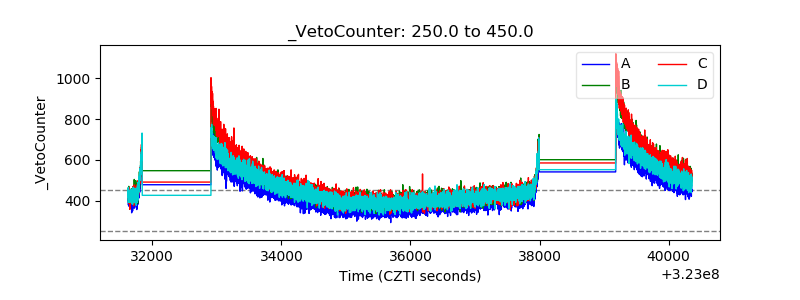 |