| Param | Original file | Final file |
|---|---|---|
| Filename | modeM0/AS1A07_145T01_9000003594_24316cztM0_level2.evt | modeM0/AS1A07_145T01_9000003594_24316cztM0_level2_quad_clean.evt |
| Size (bytes) | 580,740,480 | 113,008,320 |
| Size | 553.8 MB | 107.8 MB |
| Events in quadrant A | 3,383,130 | 748,023 |
| Events in quadrant B | 3,646,109 | 780,888 |
| Events in quadrant C | 5,598,305 | 737,342 |
| Events in quadrant D | 4,515,388 | 698,181 |
| Mode M0 | |||
|---|---|---|---|
| Quadrant | BADHDUFLAG | Total packets | Discarded packets |
| A | 0 | 14222 | 2 |
| B | 0 | 15070 | 2 |
| C | 0 | 21615 | 2 |
| D | 0 | 17731 | 2 |
| Mode M9 | |||
|---|---|---|---|
| Quadrant | BADHDUFLAG | Total packets | Discarded packets |
| A | 0 | 24 | 0 |
| B | 0 | 24 | 0 |
| C | 0 | 24 | 0 |
| D | 0 | 24 | 0 |
| Mode SS | |||
|---|---|---|---|
| Quadrant | BADHDUFLAG | Total packets | Discarded packets |
| A | 0 | 136 | 0 |
| B | 0 | 136 | 0 |
| C | 0 | 136 | 0 |
| D | 0 | 136 | 0 |
| Quadrant | Total seconds | Saturated seconds | Saturation percentage |
|---|---|---|---|
| A | 6567 | 64 | 0.974570% |
| B | 6567 | 126 | 1.918684% |
| C | 6568 | 359 | 5.465895% |
| D | 6568 | 372 | 5.663825% |
Noise dominated data is calculated using 1-second bins in cleaned event files. If a bin has >2000 counts, and if more than 50% of those come from <1% of pixels, then it is considered to be noise-dominated and hence unusable.
| Quadrant | # 1 sec bins | Bins with >0 counts | Bins with >2000 counts | High rate bins dominated by noise | Noise dominated (total time) | Noise dominated (detector-on time) | Marked lightcurve |
|---|---|---|---|---|---|---|---|
| A | 9022 | 6567 | 0 | 0 | 0.00% | 0.00% | 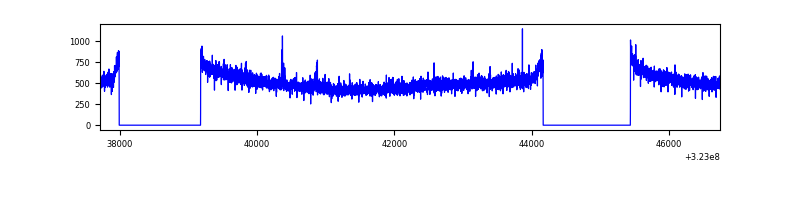 |
| B | 9022 | 6567 | 23 | 23 | 0.25% | 0.35% | 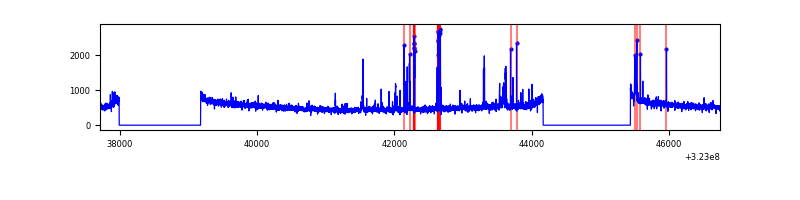 |
| C | 9023 | 6568 | 49 | 49 | 0.54% | 0.75% | 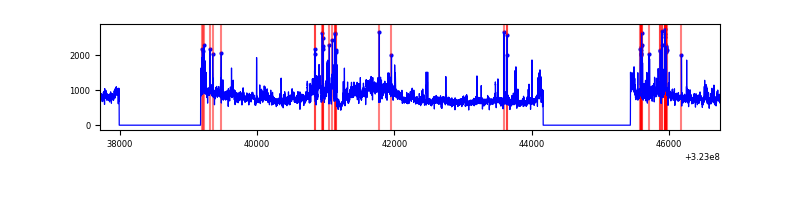 |
| D | 9023 | 6568 | 245 | 245 | 2.72% | 3.73% | 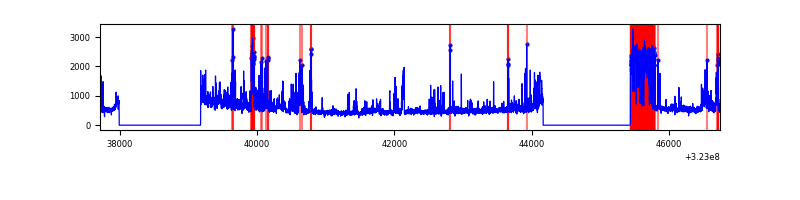 |
Top three noisy pixels from each quadrant. If the there are fewer than three noisy pixels in the level2.evt file, extra rows are filled as -1
| Pixel properties | Quadrant properties | ||||||
|---|---|---|---|---|---|---|---|
| Quadrant | DetID | PixID | Counts | Sigma | Mean | Median | Sigma |
| A | 10 | 255 | 34720 | 196.0 | 868 | 851 | 172.8 |
| A | 13 | 254 | 10324 | 54.82 | 868 | 851 | 172.8 |
| A | 3 | 137 | 7539 | 38.7 | 868 | 851 | 172.8 |
| B | 0 | 219 | 208346 | 1263.87 | 874 | 853 | 164.2 |
| B | 12 | 111 | 19493 | 113.54 | 874 | 853 | 164.2 |
| B | 11 | 111 | 17116 | 99.06 | 874 | 853 | 164.2 |
| C | 7 | 247 | 1348614 | 6929.77 | 843 | 852 | 194.5 |
| C | 2 | 16 | 825138 | 4238.22 | 843 | 852 | 194.5 |
| C | 14 | 238 | 134326 | 686.28 | 843 | 852 | 194.5 |
| D | 1 | 52 | 664869 | 3311.56 | 831 | 809 | 200.5 |
| D | 12 | 218 | 529176 | 2634.88 | 831 | 809 | 200.5 |
| D | 12 | 233 | 66570 | 327.94 | 831 | 809 | 200.5 |
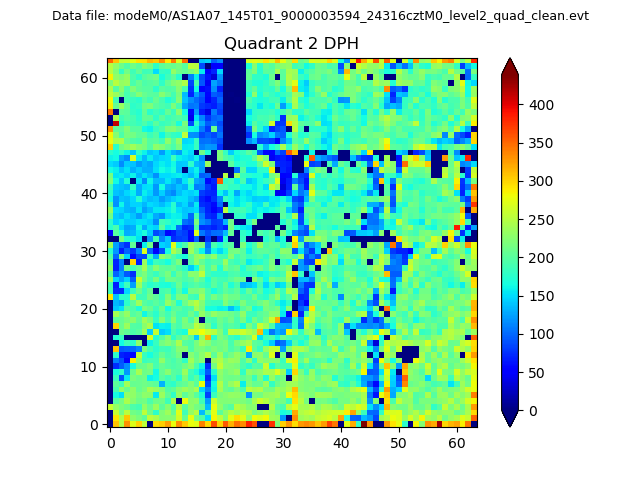
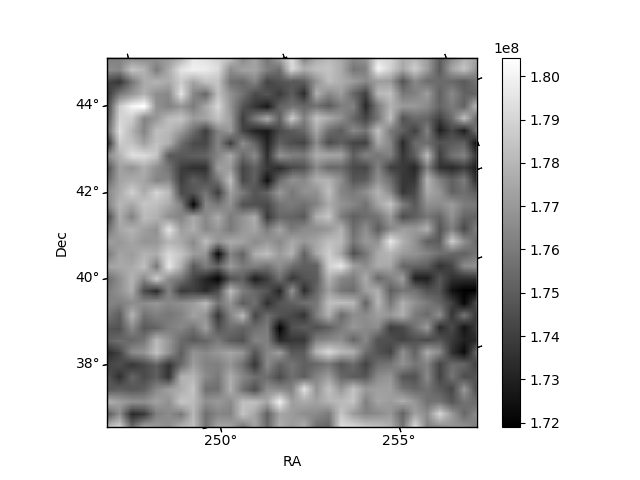
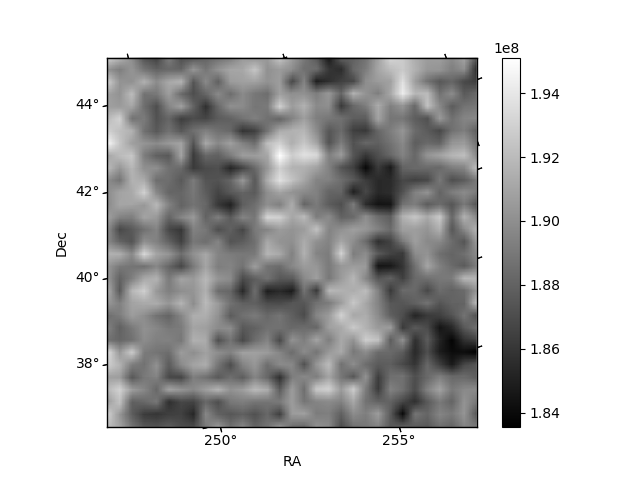
Histogram calculated using DETX and DETY for each event in the final _common_clean file
| Quadrant A | 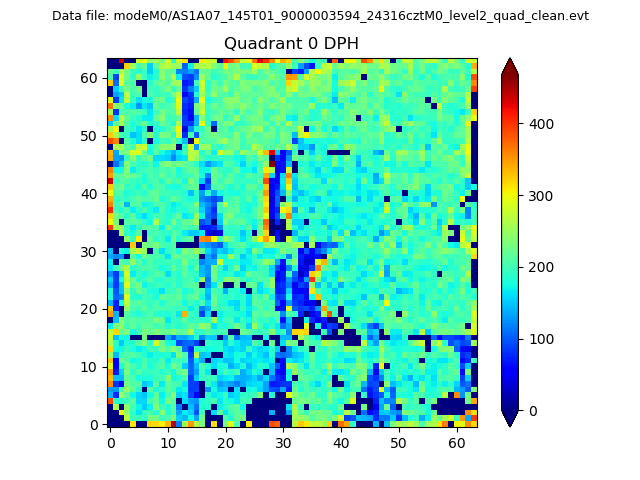 |
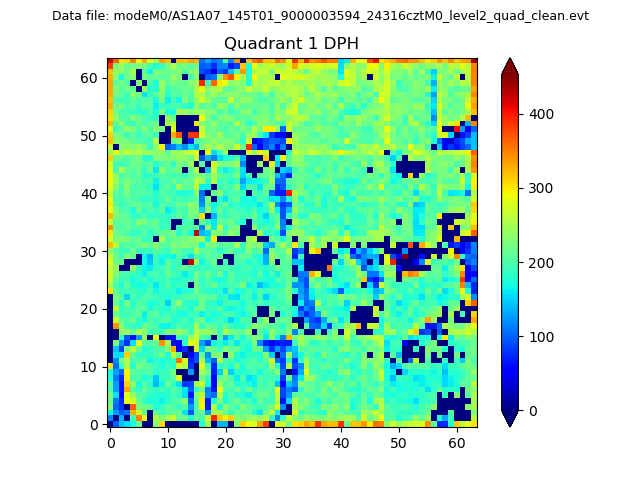 |
Quadrant B |
|---|---|---|---|
| Quadrant D | 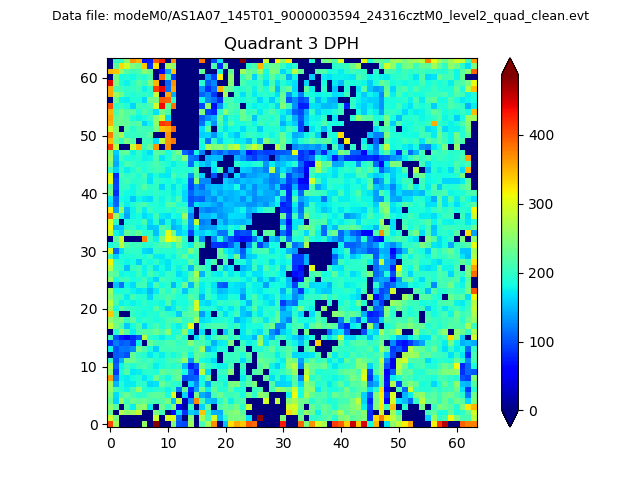 |
 |
Quadrant C |
| Plot type | Count rate plots | Images |
|---|---|---|
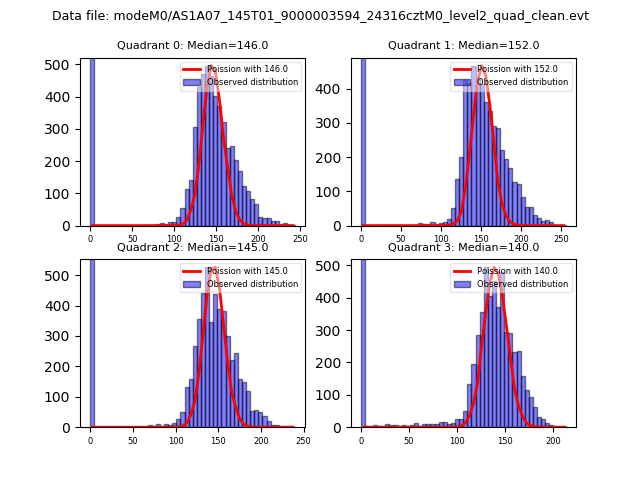
| Comparison with Poisson distribution Blue bars denote a histogram of data divided into 1 sec bins. Red curve is a Poisson curve with rate = median count rate of data. |
 |
 |
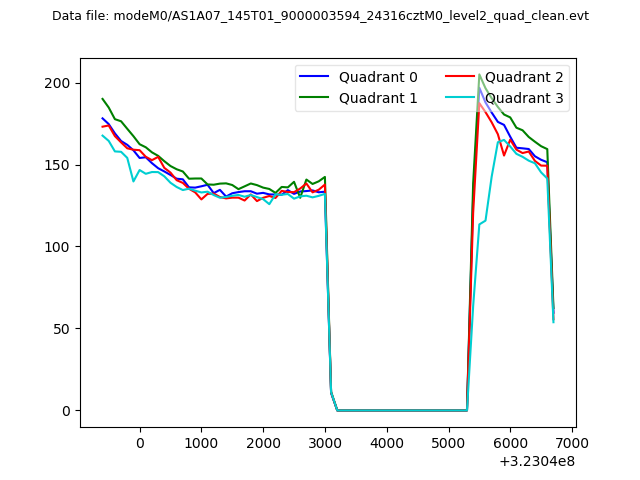
| Quadrant-wise count rates Data is divided into 100 sec bins |
 |
|
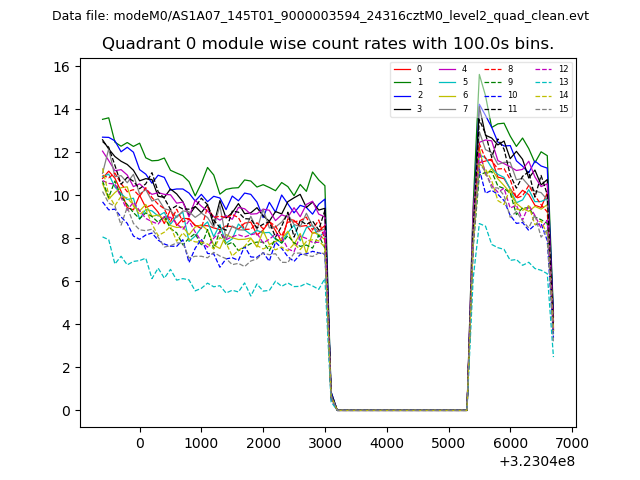
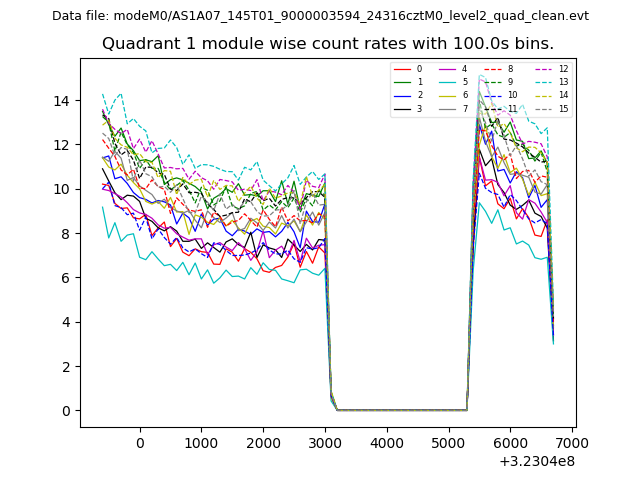
| Module-wise count rates for Quadrant A Data is divided into 100 sec bins |
 |
 |
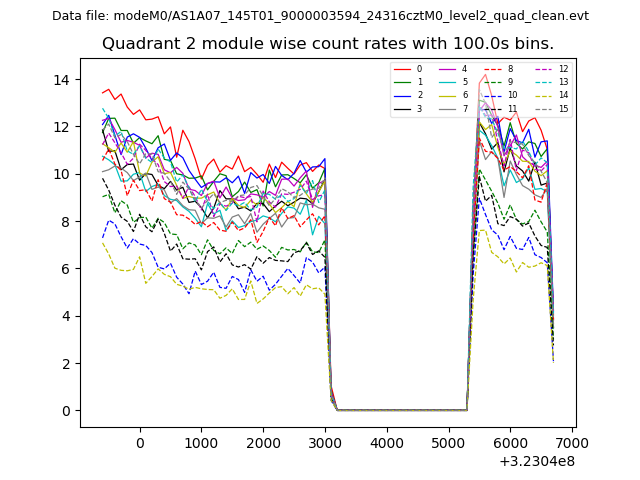
| Module-wise count rates for Quadrant B Data is divided into 100 sec bins |
 |
 |
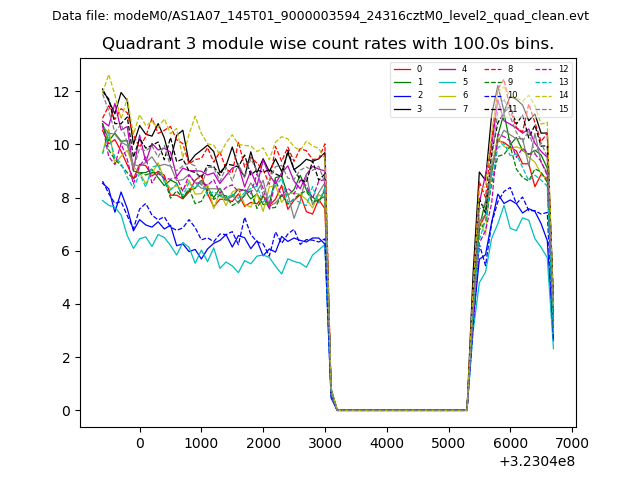
| Module-wise count rates for Quadrant C Data is divided into 100 sec bins |
 |
 |
| Module-wise count rates for Quadrant D Data is divided into 100 sec bins |
 |
 |
| Parameter | Plot |
|---|---|
| CZT HV Monitor | 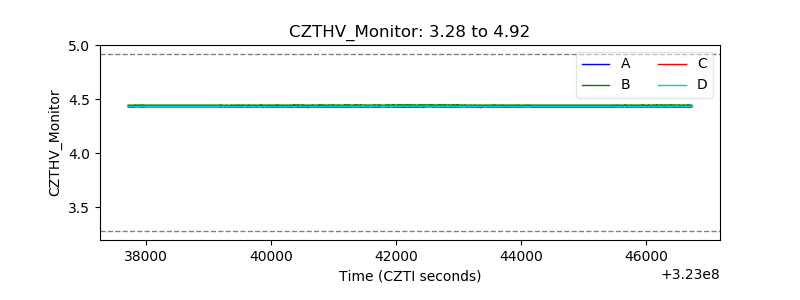 |
| D_VDD | 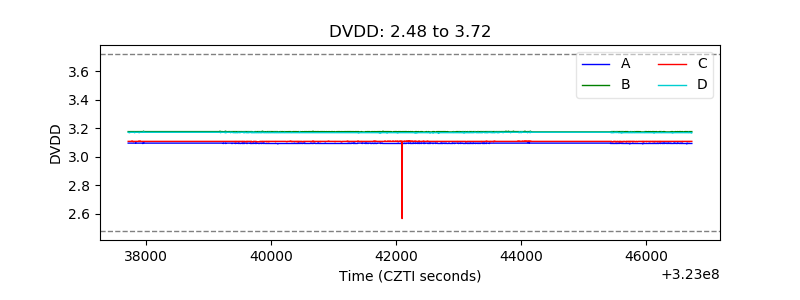 |
| Temperature 1 | 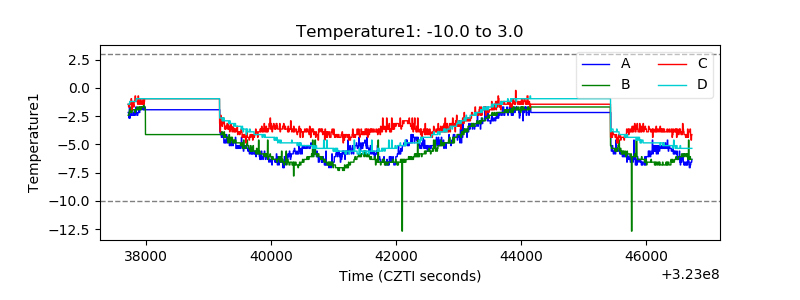 |
| Veto HV Monitor | 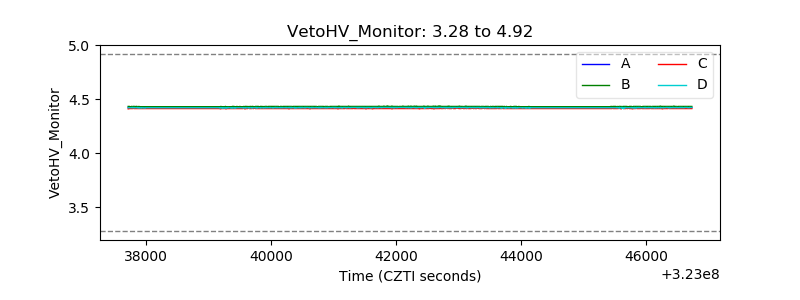 |
| Veto LLD | 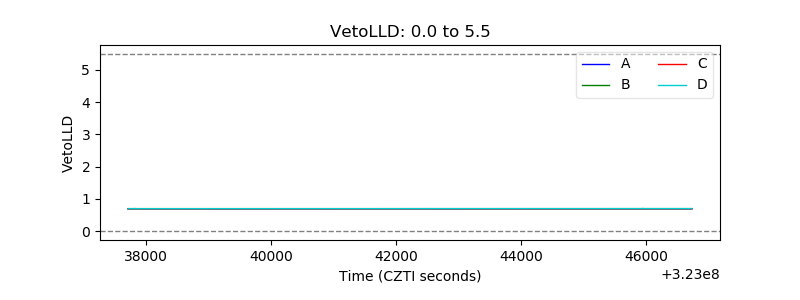 |
| Alpha Counter | 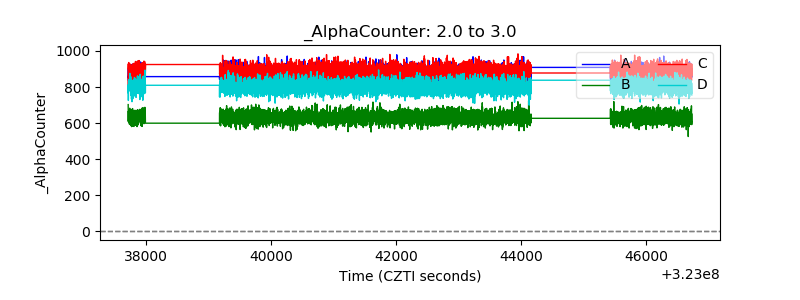 |
| _CPM_Rate | 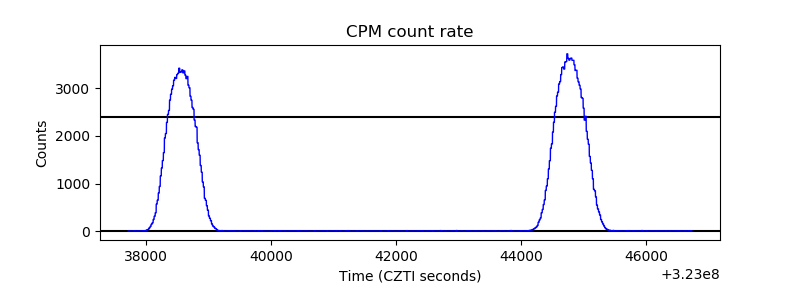 |
| CZT Counter |  |
| +2.5 Volts monitor |  |
| +5 Volts monitor | 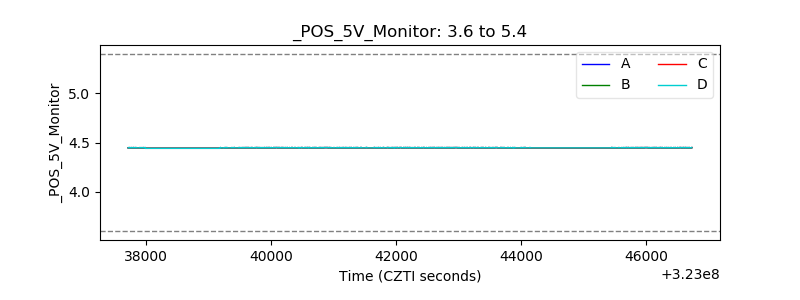 |
| _ROLL_ROT | 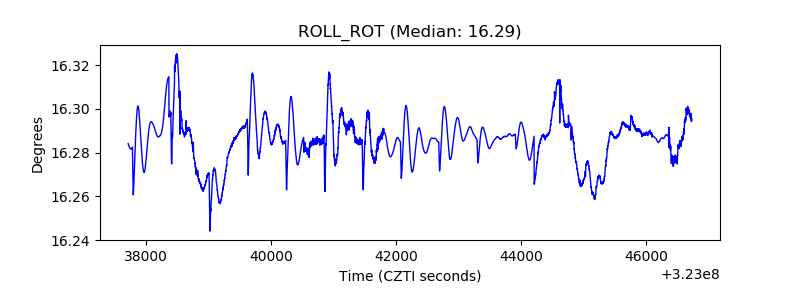 |
| _Roll_DEC | 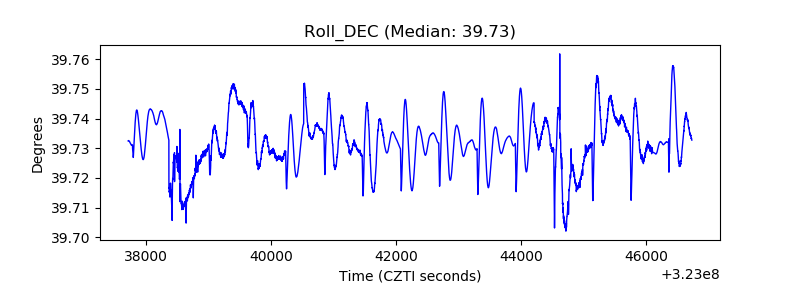 |
| _Roll_RA | 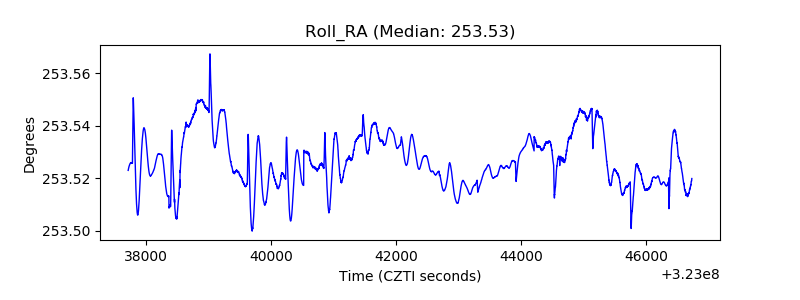 |
| Veto Counter |  |