| Param | Original file | Final file |
|---|---|---|
| Filename | modeM0/AS1A07_145T01_9000003594_24318cztM0_level2.evt | modeM0/AS1A07_145T01_9000003594_24318cztM0_level2_quad_clean.evt |
| Size (bytes) | 512,182,080 | 100,454,400 |
| Size | 488.5 MB | 95.8 MB |
| Events in quadrant A | 3,105,140 | 660,025 |
| Events in quadrant B | 3,208,212 | 690,359 |
| Events in quadrant C | 4,694,403 | 645,349 |
| Events in quadrant D | 4,087,480 | 617,745 |
| Mode M0 | |||
|---|---|---|---|
| Quadrant | BADHDUFLAG | Total packets | Discarded packets |
| A | 0 | 13032 | 2 |
| B | 0 | 13189 | 2 |
| C | 0 | 18741 | 2 |
| D | 0 | 16216 | 2 |
| Mode M9 | |||
|---|---|---|---|
| Quadrant | BADHDUFLAG | Total packets | Discarded packets |
| A | 0 | 24 | 0 |
| B | 0 | 25 | 0 |
| C | 0 | 25 | 0 |
| D | 0 | 25 | 0 |
| Mode SS | |||
|---|---|---|---|
| Quadrant | BADHDUFLAG | Total packets | Discarded packets |
| A | 0 | 124 | 0 |
| B | 0 | 124 | 0 |
| C | 0 | 124 | 0 |
| D | 0 | 124 | 0 |
| Quadrant | Total seconds | Saturated seconds | Saturation percentage |
|---|---|---|---|
| A | 6145 | 28 | 0.455655% |
| B | 6145 | 34 | 0.553295% |
| C | 6145 | 207 | 3.368592% |
| D | 6145 | 212 | 3.449959% |
Noise dominated data is calculated using 1-second bins in cleaned event files. If a bin has >2000 counts, and if more than 50% of those come from <1% of pixels, then it is considered to be noise-dominated and hence unusable.
| Quadrant | # 1 sec bins | Bins with >0 counts | Bins with >2000 counts | High rate bins dominated by noise | Noise dominated (total time) | Noise dominated (detector-on time) | Marked lightcurve |
|---|---|---|---|---|---|---|---|
| A | 7525 | 6146 | 0 | 0 | 0.00% | 0.00% | 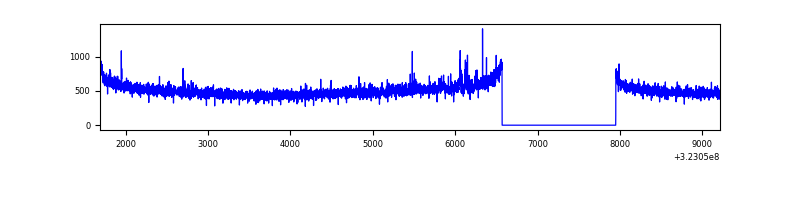 |
| B | 7525 | 6146 | 2 | 2 | 0.03% | 0.03% | 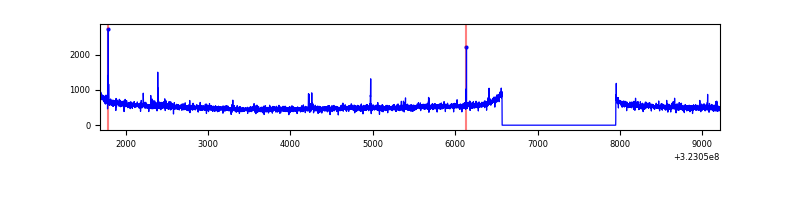 |
| C | 7525 | 6145 | 27 | 27 | 0.36% | 0.44% | 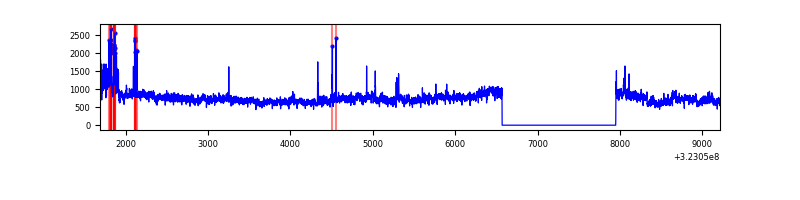 |
| D | 7525 | 6145 | 181 | 181 | 2.41% | 2.95% | 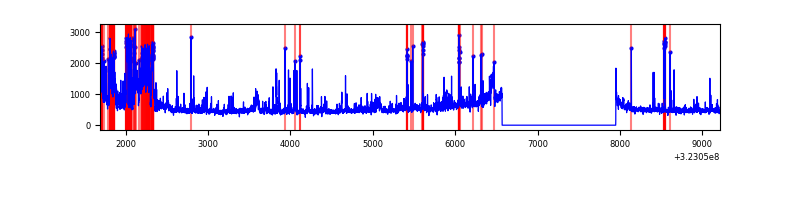 |
Top three noisy pixels from each quadrant. If the there are fewer than three noisy pixels in the level2.evt file, extra rows are filled as -1
| Pixel properties | Quadrant properties | ||||||
|---|---|---|---|---|---|---|---|
| Quadrant | DetID | PixID | Counts | Sigma | Mean | Median | Sigma |
| A | 3 | 1 | 37997 | 235.58 | 796 | 781 | 158.0 |
| A | 13 | 254 | 10032 | 58.56 | 796 | 781 | 158.0 |
| A | 0 | 226 | 6810 | 38.16 | 796 | 781 | 158.0 |
| B | 0 | 230 | 21530 | 137.12 | 805 | 787 | 151.3 |
| B | 0 | 219 | 19137 | 121.3 | 805 | 787 | 151.3 |
| B | 12 | 111 | 17741 | 112.08 | 805 | 787 | 151.3 |
| C | 7 | 247 | 1341022 | 7567.84 | 767 | 772 | 177.1 |
| C | 2 | 16 | 225914 | 1271.28 | 767 | 772 | 177.1 |
| C | 14 | 238 | 125474 | 704.14 | 767 | 772 | 177.1 |
| D | 12 | 218 | 811228 | 4433.23 | 760 | 740 | 182.8 |
| D | 1 | 52 | 321568 | 1754.87 | 760 | 740 | 182.8 |
| D | 12 | 233 | 66151 | 357.79 | 760 | 740 | 182.8 |
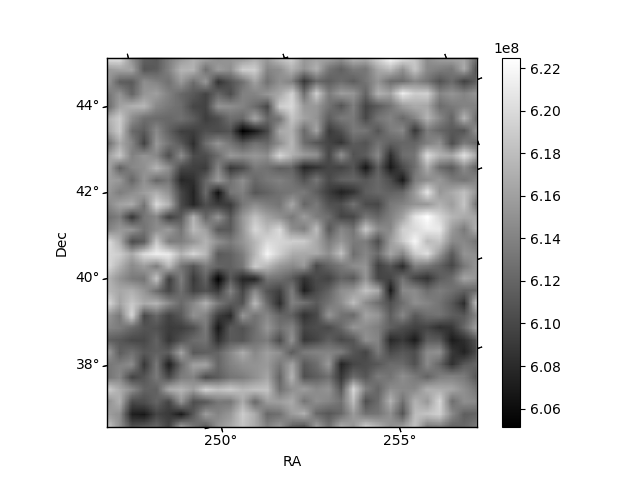
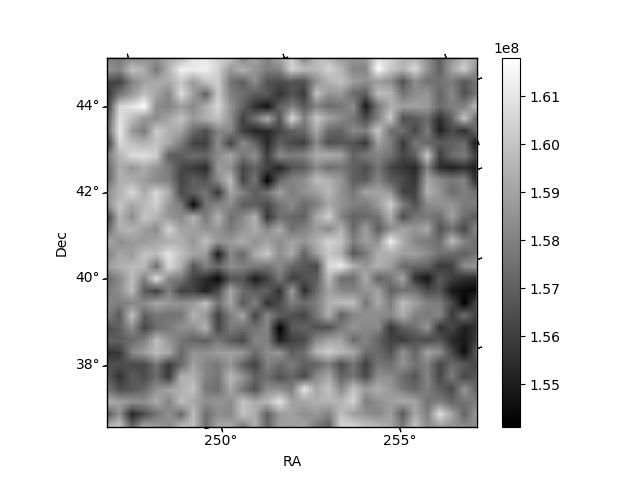
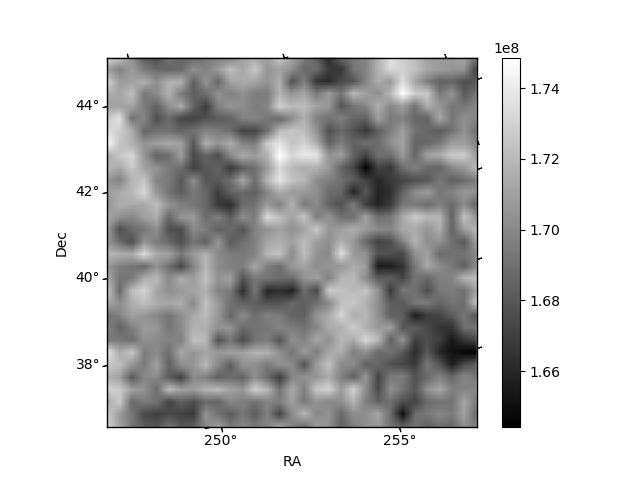
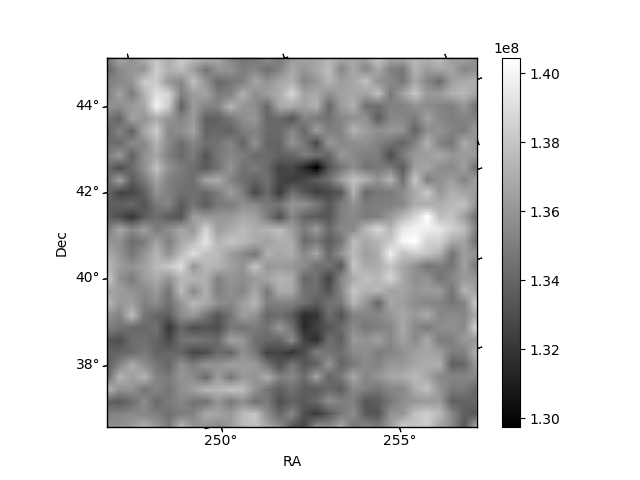
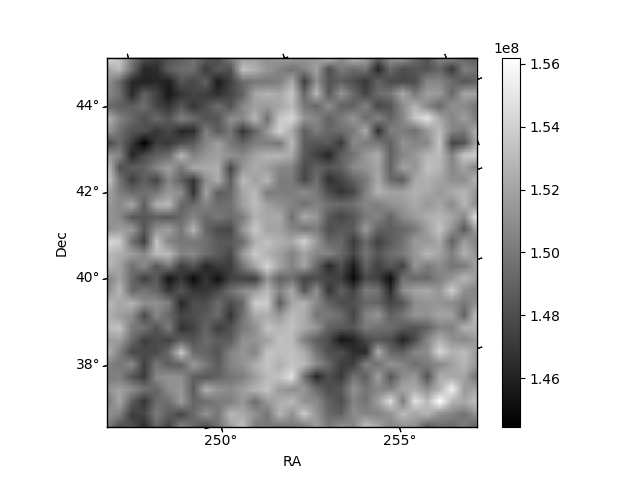
Histogram calculated using DETX and DETY for each event in the final _common_clean file
| Quadrant A | 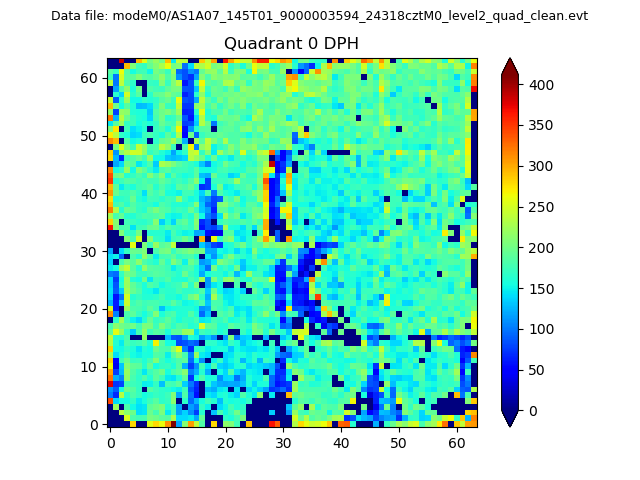 |
 |
Quadrant B |
|---|---|---|---|
| Quadrant D | 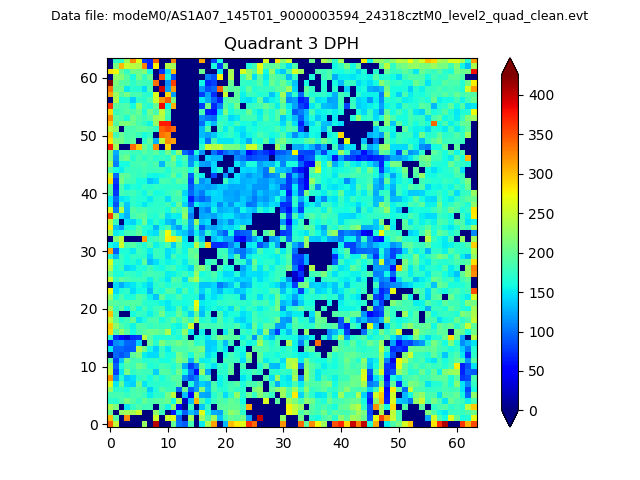 |
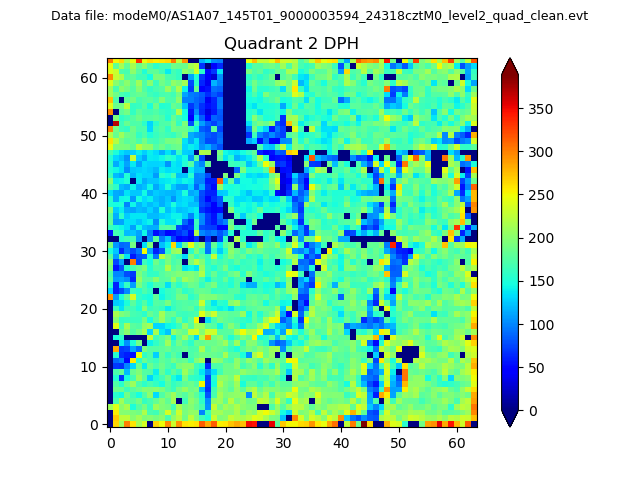 |
Quadrant C |
| Plot type | Count rate plots | Images |
|---|---|---|
| Comparison with Poisson distribution Blue bars denote a histogram of data divided into 1 sec bins. Red curve is a Poisson curve with rate = median count rate of data. |
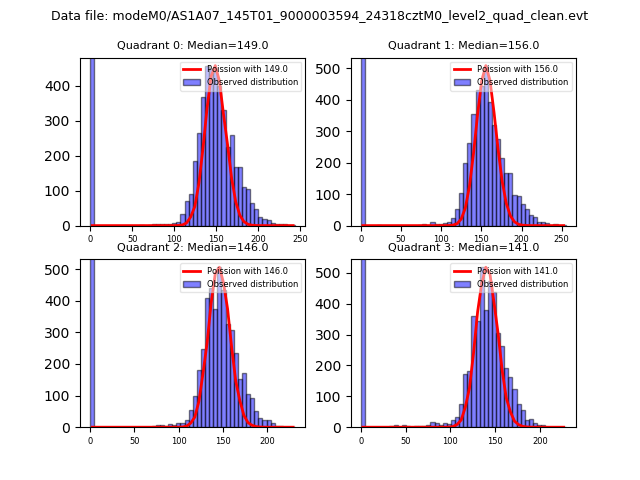 |
 |
| Quadrant-wise count rates Data is divided into 100 sec bins |
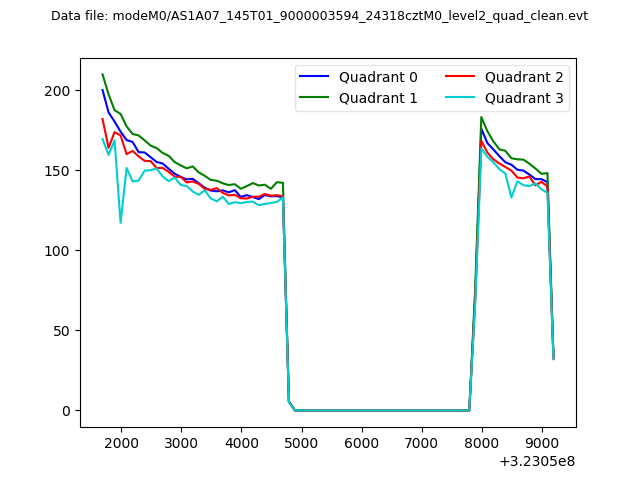 |
|
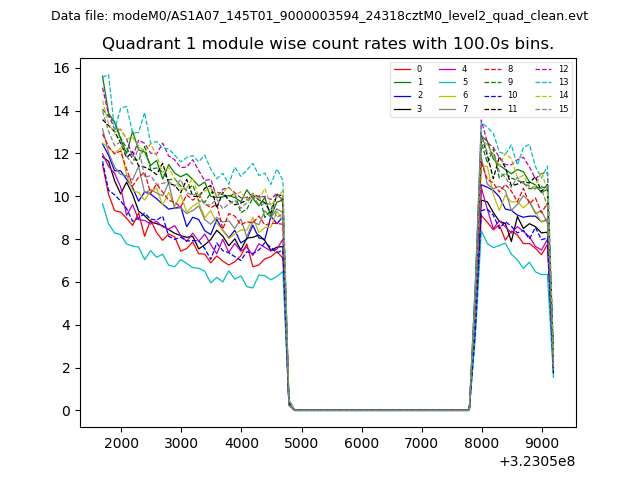
| Module-wise count rates for Quadrant A Data is divided into 100 sec bins |
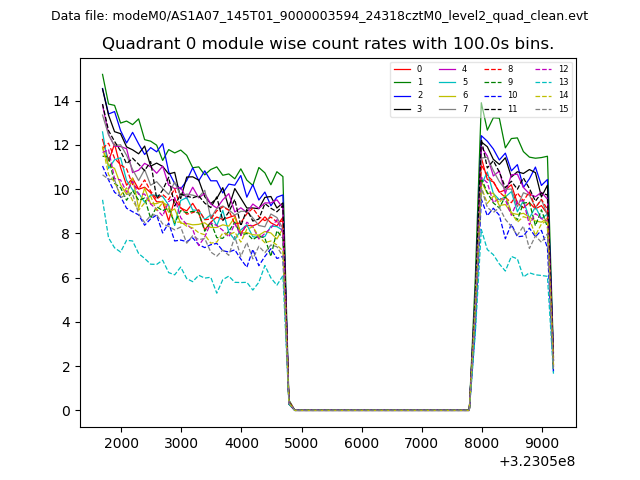 |
 |
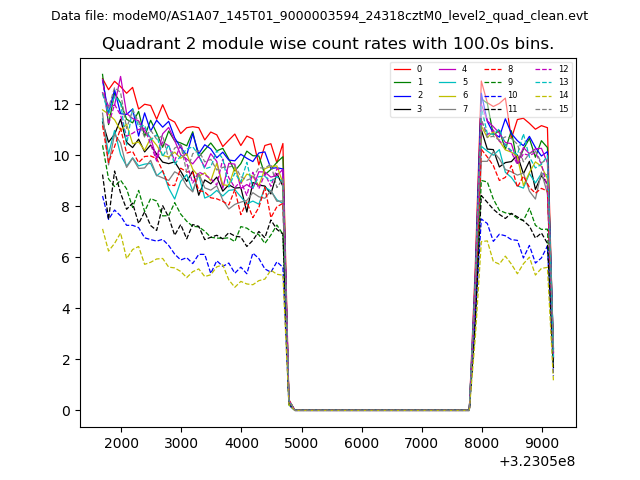
| Module-wise count rates for Quadrant B Data is divided into 100 sec bins |
 |
 |
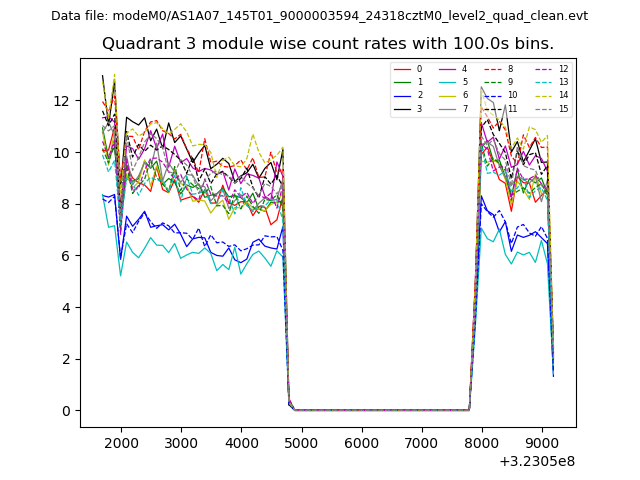
| Module-wise count rates for Quadrant C Data is divided into 100 sec bins |
 |
 |
| Module-wise count rates for Quadrant D Data is divided into 100 sec bins |
 |
 |
| Parameter | Plot |
|---|---|
| CZT HV Monitor | 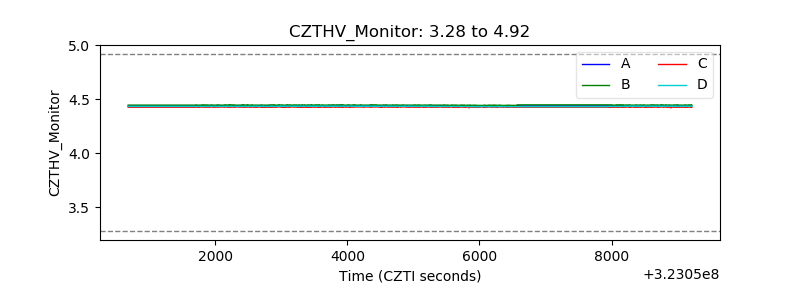 |
| D_VDD | 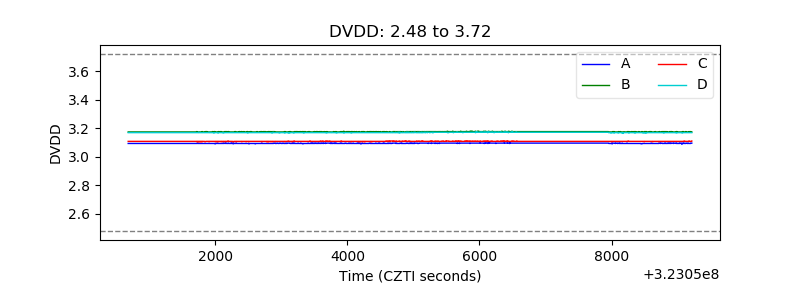 |
| Temperature 1 | 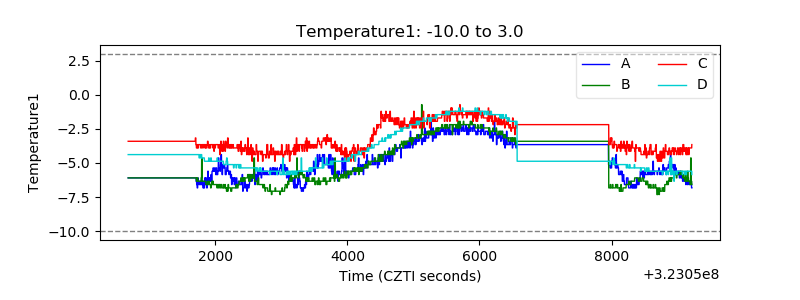 |
| Veto HV Monitor | 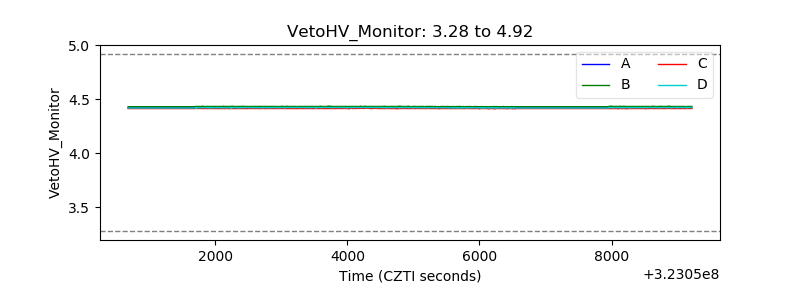 |
| Veto LLD | 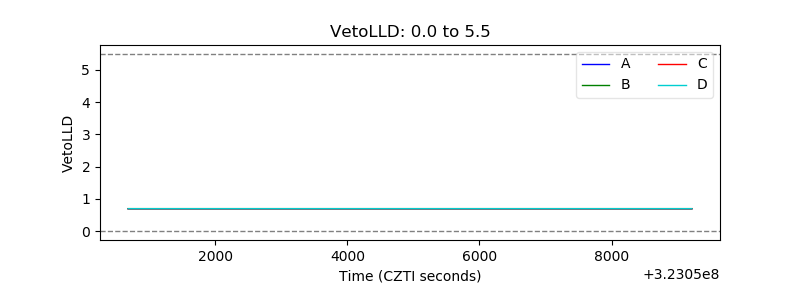 |
| Alpha Counter | 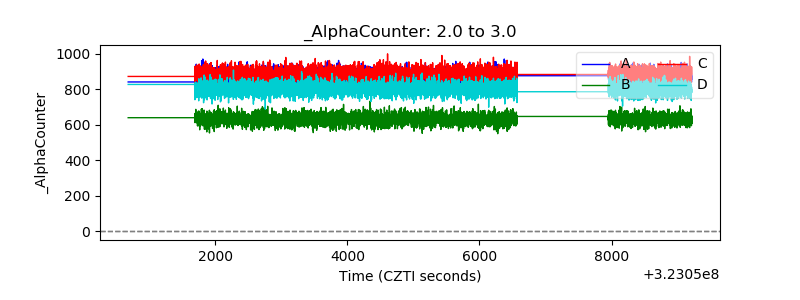 |
| _CPM_Rate |  |
| CZT Counter | 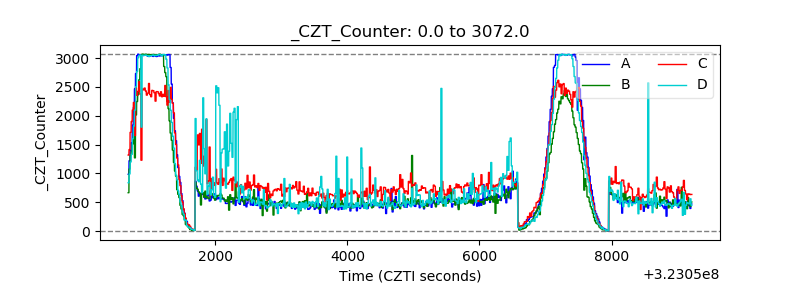 |
| +2.5 Volts monitor | 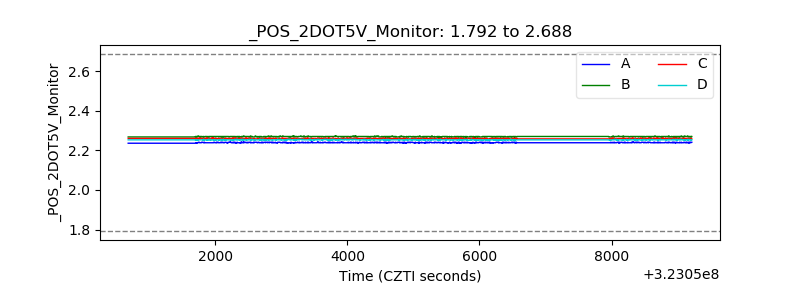 |
| +5 Volts monitor |  |
| _ROLL_ROT |  |
| _Roll_DEC |  |
| _Roll_RA | 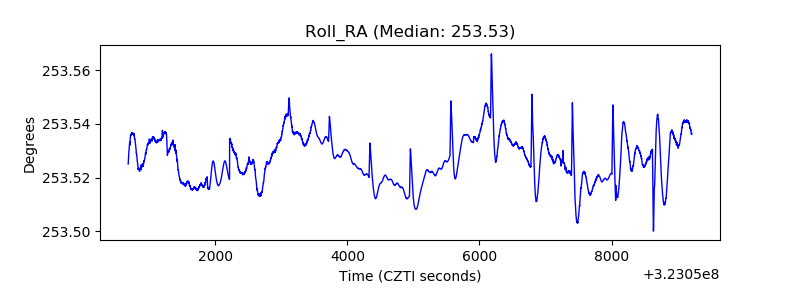 |
| Veto Counter | 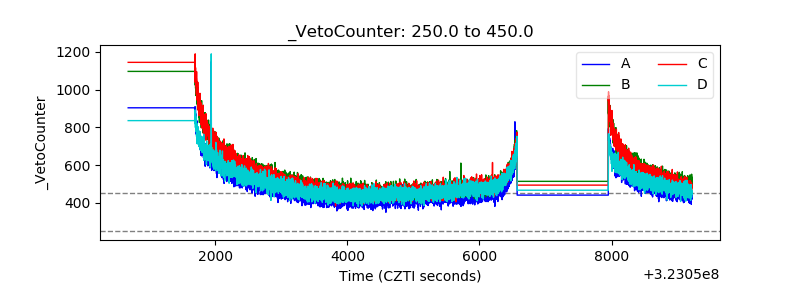 |