| Param | Original file | Final file |
|---|---|---|
| Filename | modeM0/AS1A07_145T01_9000003594_24319cztM0_level2.evt | modeM0/AS1A07_145T01_9000003594_24319cztM0_level2_quad_clean.evt |
| Size (bytes) | 518,742,720 | 98,498,880 |
| Size | 494.7 MB | 93.9 MB |
| Events in quadrant A | 3,210,375 | 636,460 |
| Events in quadrant B | 3,309,509 | 657,419 |
| Events in quadrant C | 5,287,833 | 620,039 |
| Events in quadrant D | 3,454,368 | 608,410 |
| Mode M0 | |||
|---|---|---|---|
| Quadrant | BADHDUFLAG | Total packets | Discarded packets |
| A | 0 | 13691 | 2 |
| B | 0 | 13888 | 2 |
| C | 0 | 20521 | 2 |
| D | 0 | 14726 | 2 |
| Mode M9 | |||
|---|---|---|---|
| Quadrant | BADHDUFLAG | Total packets | Discarded packets |
| A | 0 | 18 | 0 |
| B | 0 | 19 | 0 |
| C | 0 | 19 | 0 |
| D | 0 | 19 | 0 |
| Mode SS | |||
|---|---|---|---|
| Quadrant | BADHDUFLAG | Total packets | Discarded packets |
| A | 0 | 136 | 0 |
| B | 0 | 136 | 0 |
| C | 0 | 136 | 0 |
| D | 0 | 136 | 0 |
| Quadrant | Total seconds | Saturated seconds | Saturation percentage |
|---|---|---|---|
| A | 6602 | 20 | 0.302939% |
| B | 6602 | 41 | 0.621024% |
| C | 6602 | 282 | 4.271433% |
| D | 6602 | 39 | 0.590730% |
Noise dominated data is calculated using 1-second bins in cleaned event files. If a bin has >2000 counts, and if more than 50% of those come from <1% of pixels, then it is considered to be noise-dominated and hence unusable.
| Quadrant | # 1 sec bins | Bins with >0 counts | Bins with >2000 counts | High rate bins dominated by noise | Noise dominated (total time) | Noise dominated (detector-on time) | Marked lightcurve |
|---|---|---|---|---|---|---|---|
| A | 7862 | 6603 | 0 | 0 | 0.00% | 0.00% | 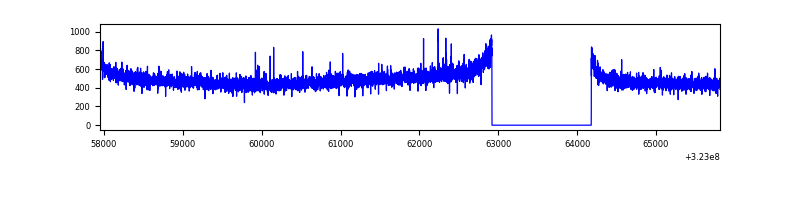 |
| B | 7862 | 6603 | 5 | 5 | 0.06% | 0.08% | 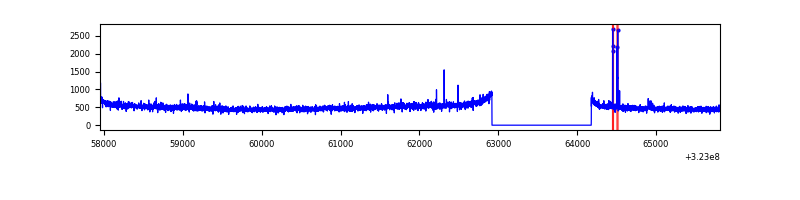 |
| C | 7862 | 6602 | 96 | 96 | 1.22% | 1.45% | 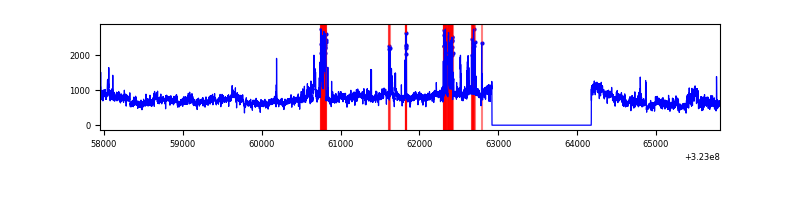 |
| D | 7862 | 6603 | 27 | 27 | 0.34% | 0.41% | 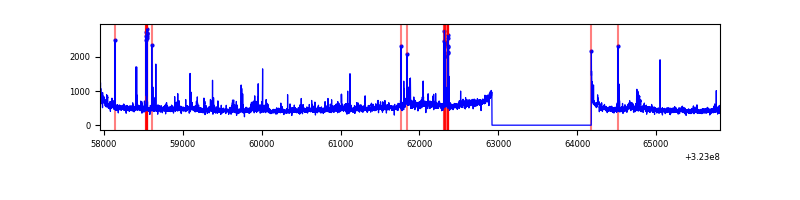 |
Top three noisy pixels from each quadrant. If the there are fewer than three noisy pixels in the level2.evt file, extra rows are filled as -1
| Pixel properties | Quadrant properties | ||||||
|---|---|---|---|---|---|---|---|
| Quadrant | DetID | PixID | Counts | Sigma | Mean | Median | Sigma |
| A | 3 | 1 | 11102 | 61.9 | 830 | 815 | 166.2 |
| A | 13 | 254 | 10504 | 58.3 | 830 | 815 | 166.2 |
| A | 0 | 226 | 7189 | 38.35 | 830 | 815 | 166.2 |
| B | 0 | 219 | 36974 | 228.23 | 832 | 812 | 158.4 |
| B | 12 | 111 | 18564 | 112.04 | 832 | 812 | 158.4 |
| B | 0 | 230 | 16955 | 101.88 | 832 | 812 | 158.4 |
| C | 7 | 247 | 1576161 | 8580.06 | 789 | 793 | 183.6 |
| C | 2 | 16 | 493592 | 2683.97 | 789 | 793 | 183.6 |
| C | 14 | 238 | 127862 | 692.07 | 789 | 793 | 183.6 |
| D | 1 | 52 | 169730 | 876.05 | 799 | 778 | 192.9 |
| D | 12 | 218 | 127794 | 658.61 | 799 | 778 | 192.9 |
| D | 1 | 239 | 59237 | 303.12 | 799 | 778 | 192.9 |
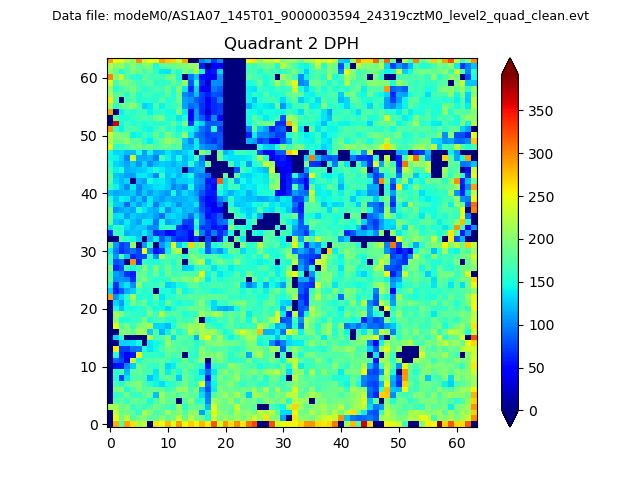
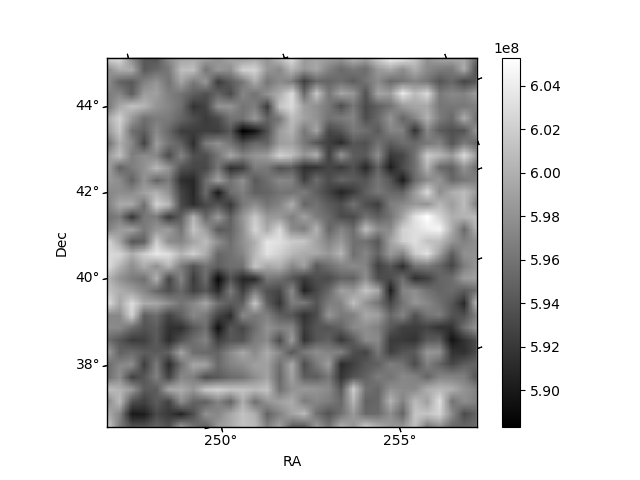
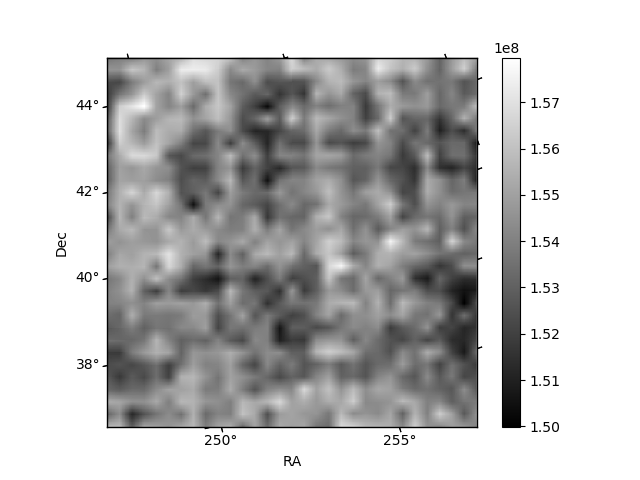
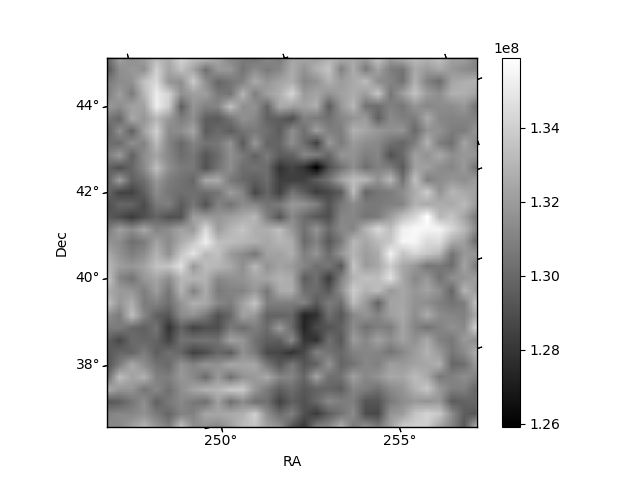
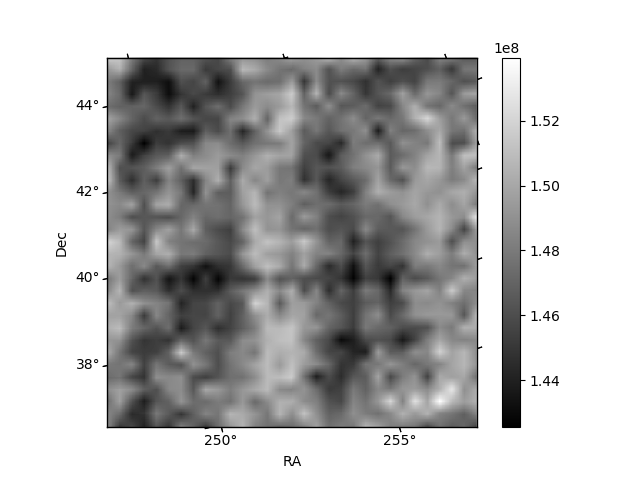
Histogram calculated using DETX and DETY for each event in the final _common_clean file
| Quadrant A | 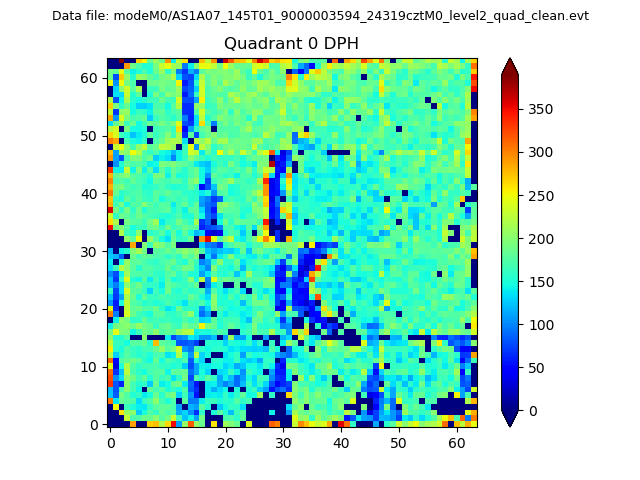 |
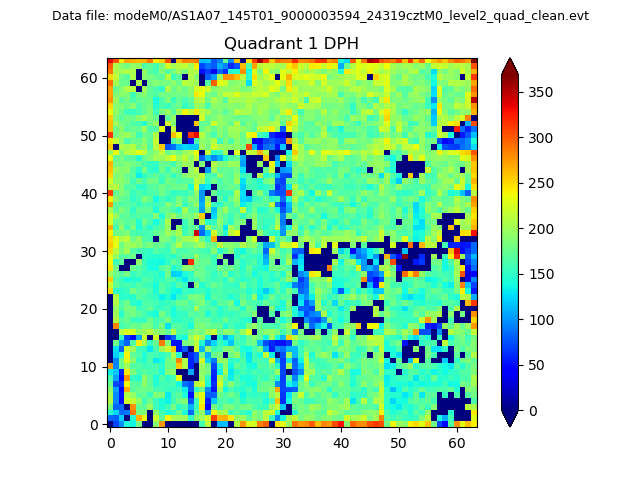 |
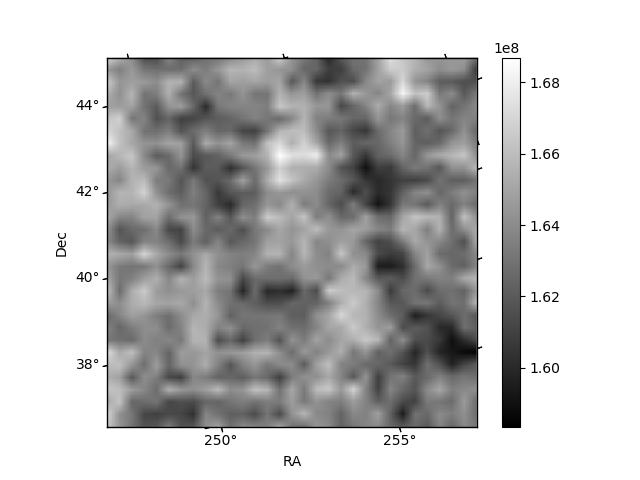
Quadrant B |
|---|---|---|---|
| Quadrant D | 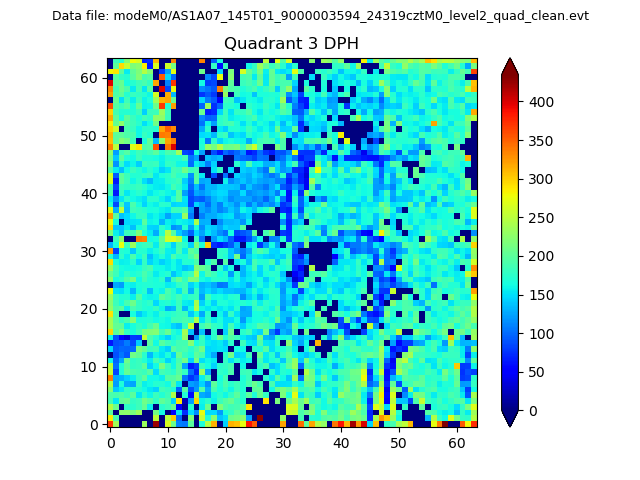 |
 |
Quadrant C |
| Plot type | Count rate plots | Images |
|---|---|---|
| Comparison with Poisson distribution Blue bars denote a histogram of data divided into 1 sec bins. Red curve is a Poisson curve with rate = median count rate of data. |
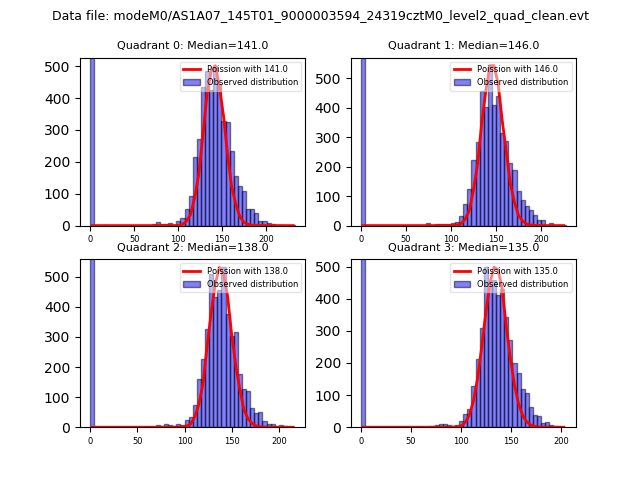 |
 |
| Quadrant-wise count rates Data is divided into 100 sec bins |
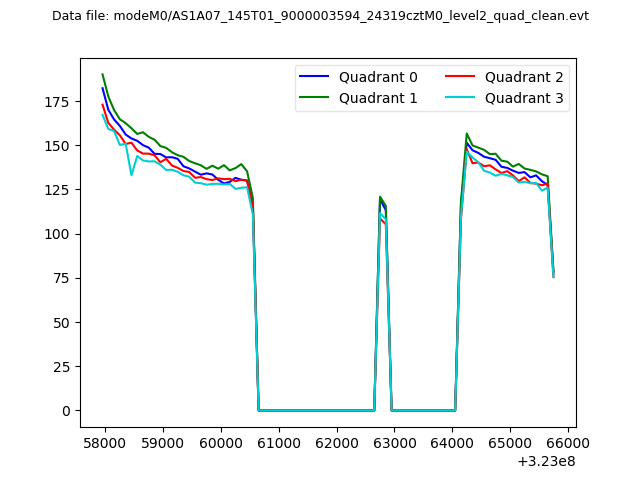 |
|
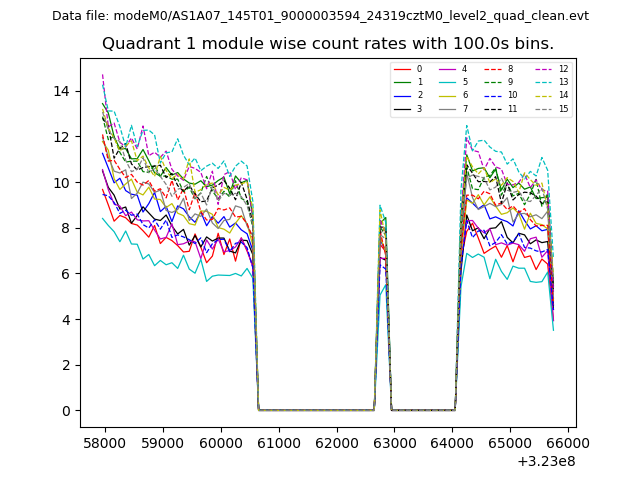
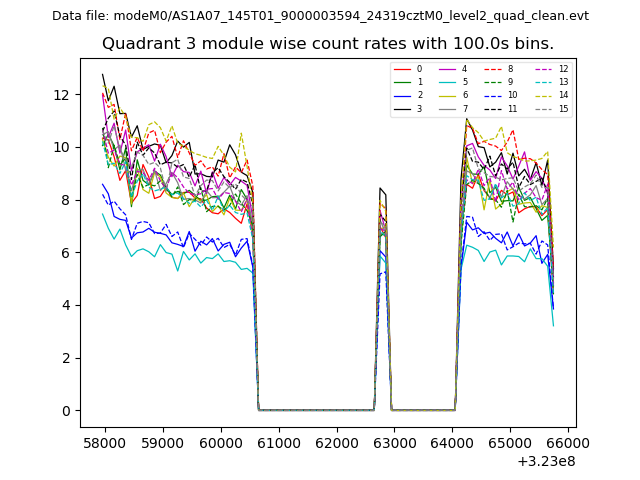
| Module-wise count rates for Quadrant A Data is divided into 100 sec bins |
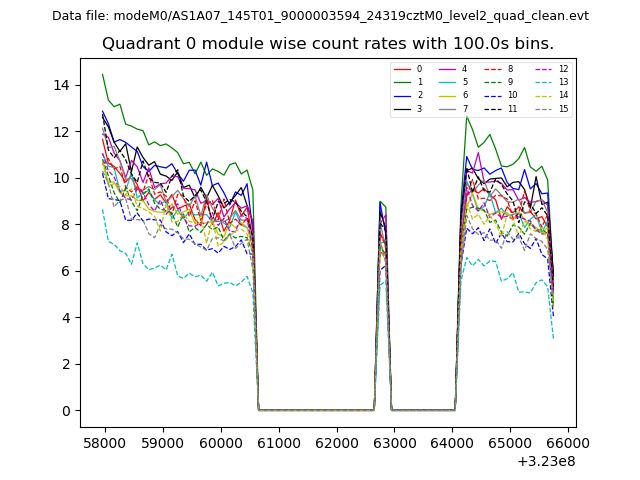 |
 |
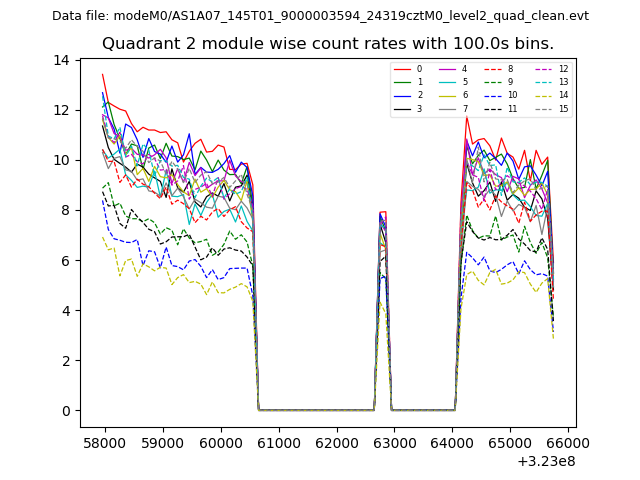
| Module-wise count rates for Quadrant B Data is divided into 100 sec bins |
 |
 |
| Module-wise count rates for Quadrant C Data is divided into 100 sec bins |
 |
 |
| Module-wise count rates for Quadrant D Data is divided into 100 sec bins |
 |
 |
| Parameter | Plot |
|---|---|
| CZT HV Monitor | 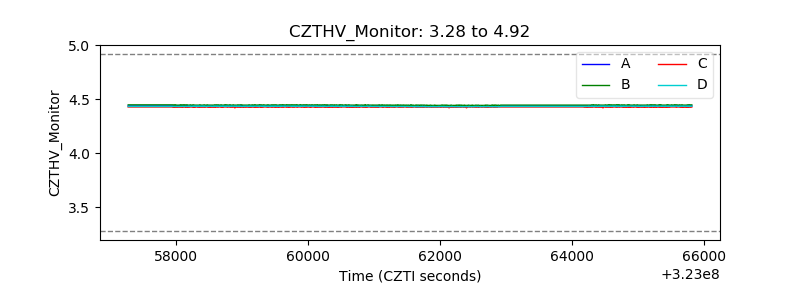 |
| D_VDD | 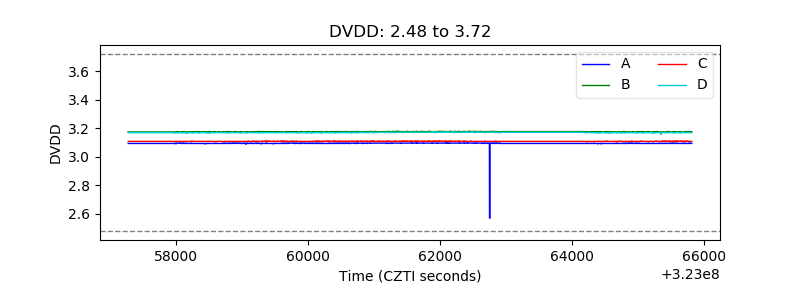 |
| Temperature 1 | 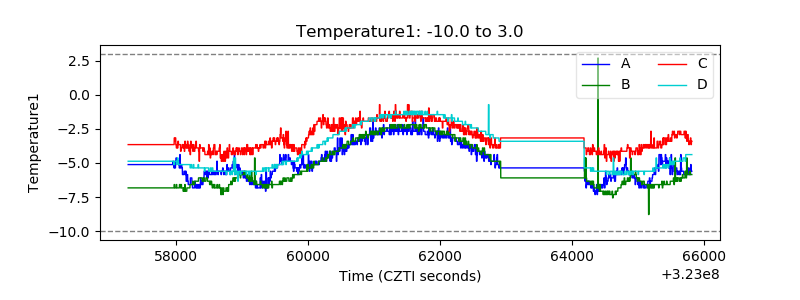 |
| Veto HV Monitor | 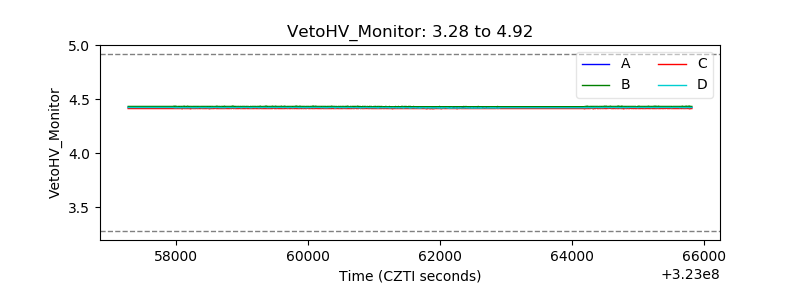 |
| Veto LLD | 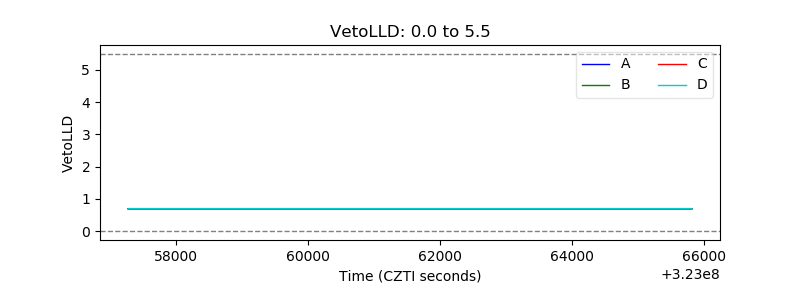 |
| Alpha Counter | 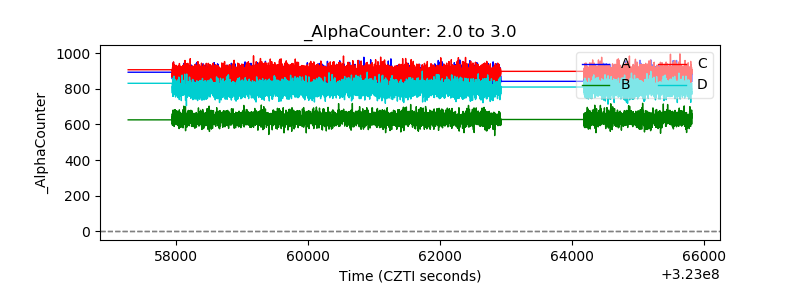 |
| _CPM_Rate | 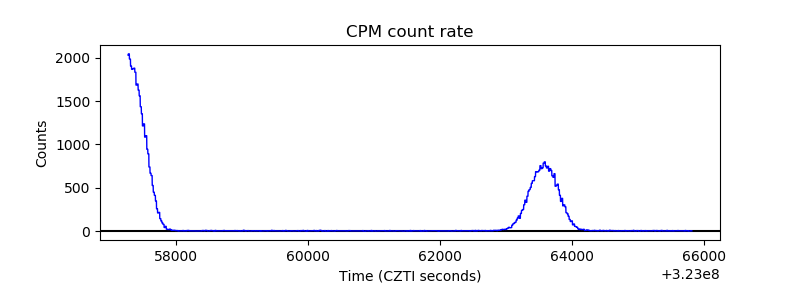 |
| CZT Counter | 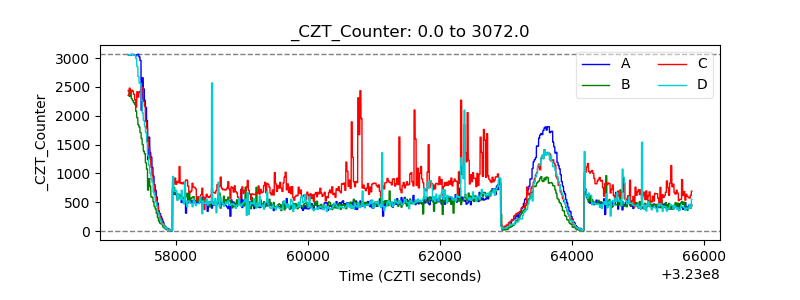 |
| +2.5 Volts monitor |  |
| +5 Volts monitor |  |
| _ROLL_ROT | 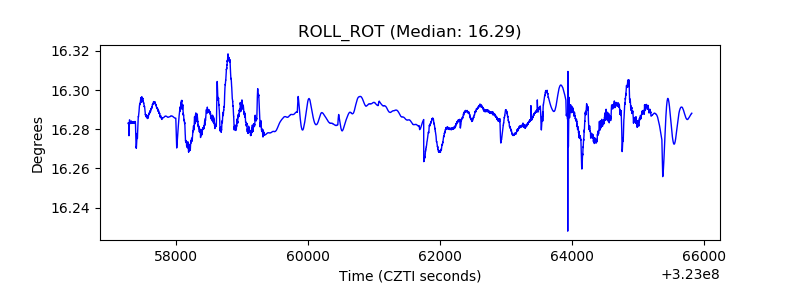 |
| _Roll_DEC | 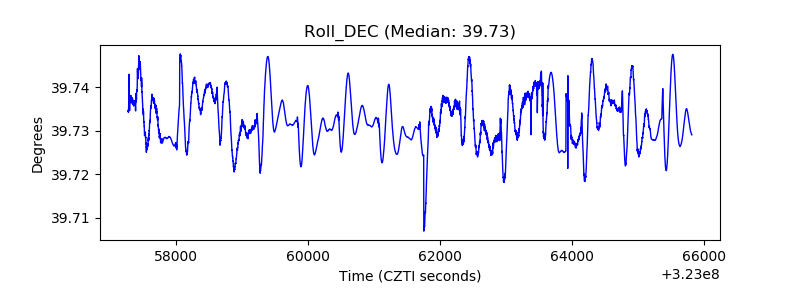 |
| _Roll_RA | 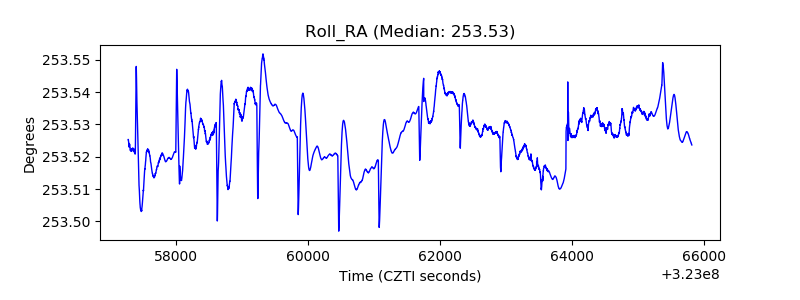 |
| Veto Counter |  |