| Param | Original file | Final file |
|---|---|---|
| Filename | modeM0/AS1A07_145T01_9000003594_24320cztM0_level2.evt | modeM0/AS1A07_145T01_9000003594_24320cztM0_level2_quad_clean.evt |
| Size (bytes) | 540,267,840 | 95,201,280 |
| Size | 515.2 MB | 90.8 MB |
| Events in quadrant A | 3,152,743 | 609,385 |
| Events in quadrant B | 4,872,837 | 620,700 |
| Events in quadrant C | 4,125,925 | 599,344 |
| Events in quadrant D | 3,757,541 | 587,558 |
| Mode M0 | |||
|---|---|---|---|
| Quadrant | BADHDUFLAG | Total packets | Discarded packets |
| A | 0 | 13658 | 5 |
| B | 0 | 18943 | 12 |
| C | 0 | 16635 | 4 |
| D | 0 | 15704 | 7 |
| Mode M9 | |||
|---|---|---|---|
| Quadrant | BADHDUFLAG | Total packets | Discarded packets |
| A | 0 | 8 | 0 |
| B | 0 | 8 | 0 |
| C | 0 | 8 | 0 |
| D | 0 | 8 | 0 |
| Mode SS | |||
|---|---|---|---|
| Quadrant | BADHDUFLAG | Total packets | Discarded packets |
| A | 0 | 138 | 0 |
| B | 0 | 138 | 2 |
| C | 0 | 138 | 0 |
| D | 0 | 138 | 0 |
| Quadrant | Total seconds | Saturated seconds | Saturation percentage |
|---|---|---|---|
| A | 6679 | 54 | 0.808504% |
| B | 6680 | 291 | 4.356287% |
| C | 6681 | 104 | 1.556653% |
| D | 6679 | 71 | 1.063033% |
Noise dominated data is calculated using 1-second bins in cleaned event files. If a bin has >2000 counts, and if more than 50% of those come from <1% of pixels, then it is considered to be noise-dominated and hence unusable.
| Quadrant | # 1 sec bins | Bins with >0 counts | Bins with >2000 counts | High rate bins dominated by noise | Noise dominated (total time) | Noise dominated (detector-on time) | Marked lightcurve |
|---|---|---|---|---|---|---|---|
| A | 7571 | 6681 | 0 | 0 | 0.00% | 0.00% | 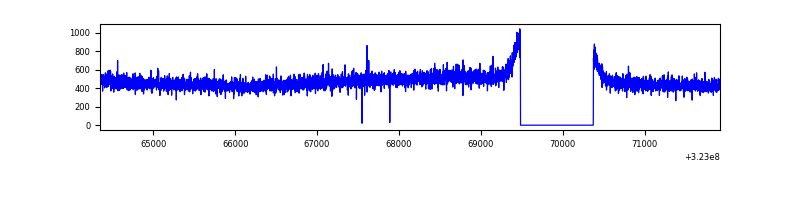 |
| B | 7572 | 6682 | 5 | 5 | 0.07% | 0.07% | 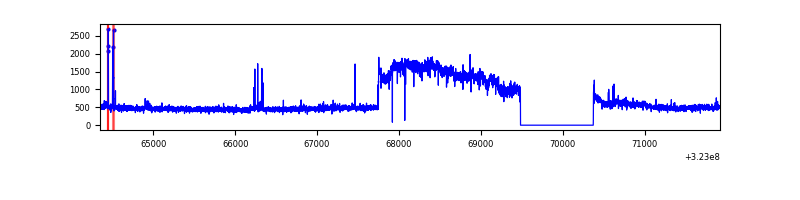 |
| C | 7572 | 6682 | 0 | 0 | 0.00% | 0.00% | 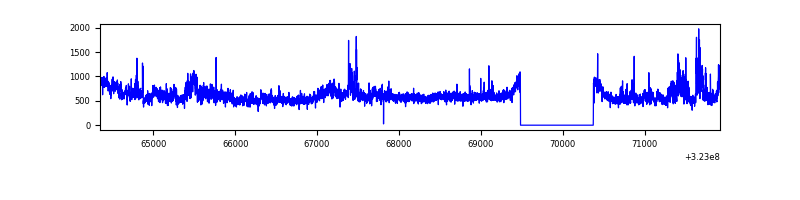 |
| D | 7572 | 6682 | 32 | 32 | 0.42% | 0.48% | 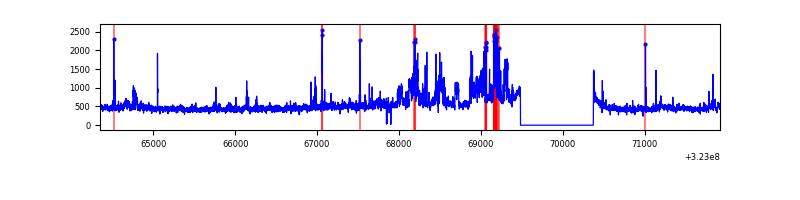 |
Top three noisy pixels from each quadrant. If the there are fewer than three noisy pixels in the level2.evt file, extra rows are filled as -1
| Pixel properties | Quadrant properties | ||||||
|---|---|---|---|---|---|---|---|
| Quadrant | DetID | PixID | Counts | Sigma | Mean | Median | Sigma |
| A | 13 | 254 | 9790 | 54.7 | 817 | 799 | 164.4 |
| A | 3 | 137 | 7271 | 39.37 | 817 | 799 | 164.4 |
| A | 0 | 226 | 7038 | 37.95 | 817 | 799 | 164.4 |
| B | 4 | 200 | 1654282 | 10639.03 | 812 | 794 | 155.4 |
| B | 0 | 219 | 23443 | 145.73 | 812 | 794 | 155.4 |
| B | 12 | 111 | 19028 | 117.32 | 812 | 794 | 155.4 |
| C | 7 | 247 | 670925 | 3668.25 | 784 | 789 | 182.7 |
| C | 2 | 16 | 172068 | 937.56 | 784 | 789 | 182.7 |
| C | 14 | 238 | 124431 | 676.8 | 784 | 789 | 182.7 |
| D | 12 | 218 | 462197 | 2424.35 | 789 | 768 | 190.3 |
| D | 1 | 52 | 159688 | 834.97 | 789 | 768 | 190.3 |
| D | 8 | 195 | 74388 | 386.8 | 789 | 768 | 190.3 |
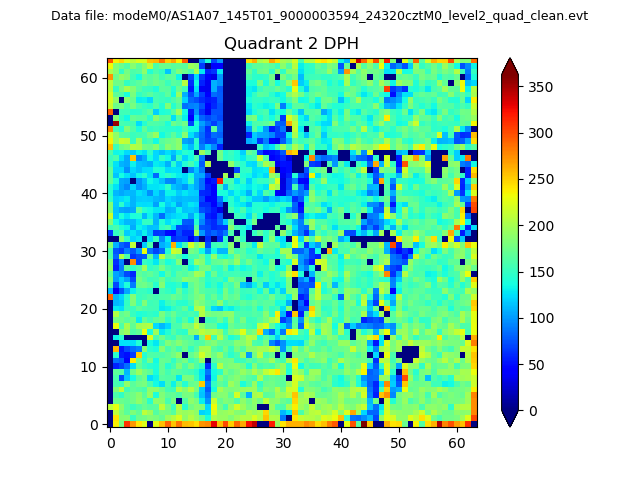
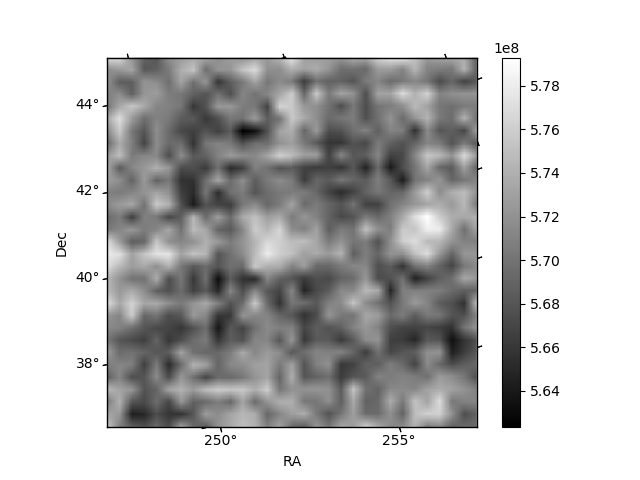
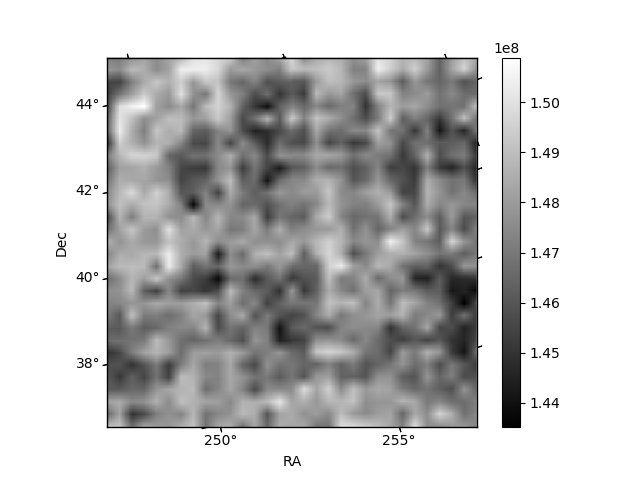
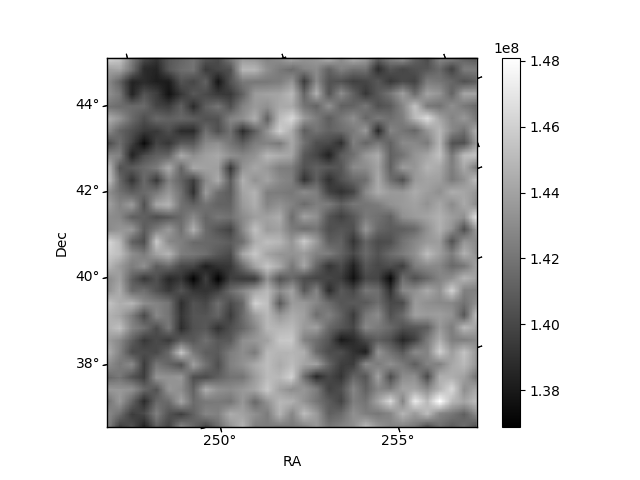
Histogram calculated using DETX and DETY for each event in the final _common_clean file
| Quadrant A | 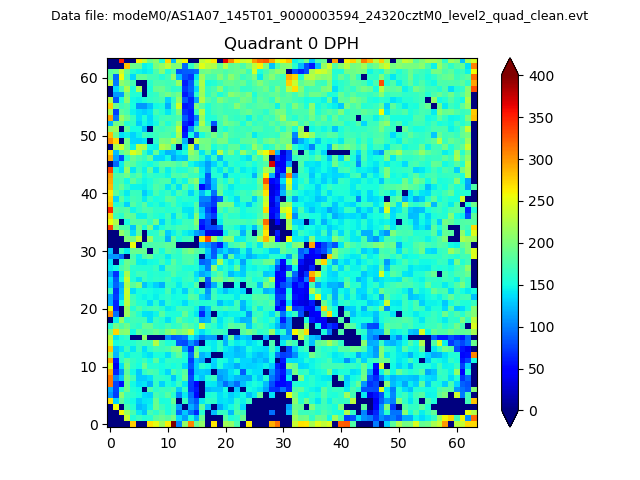 |
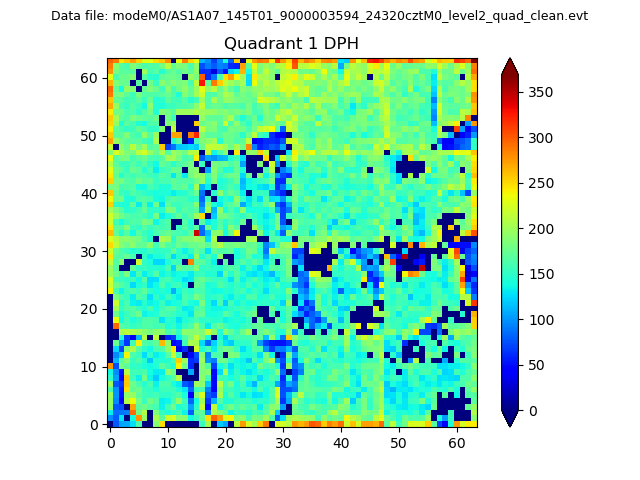 |
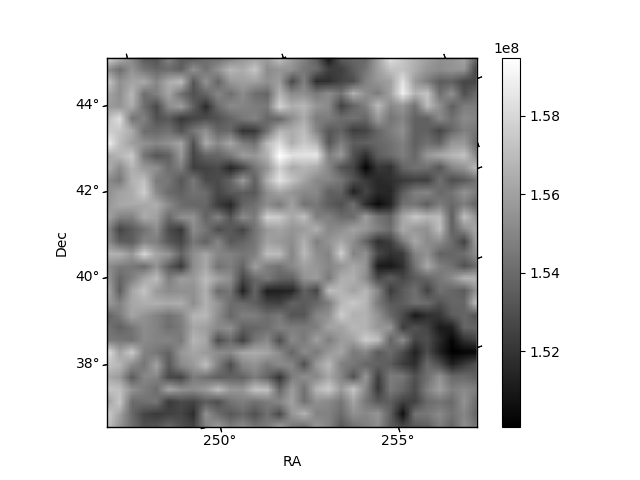
Quadrant B |
|---|---|---|---|
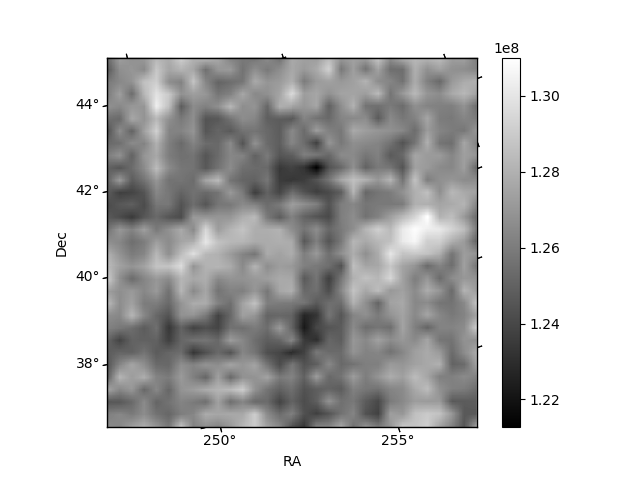
| Quadrant D | 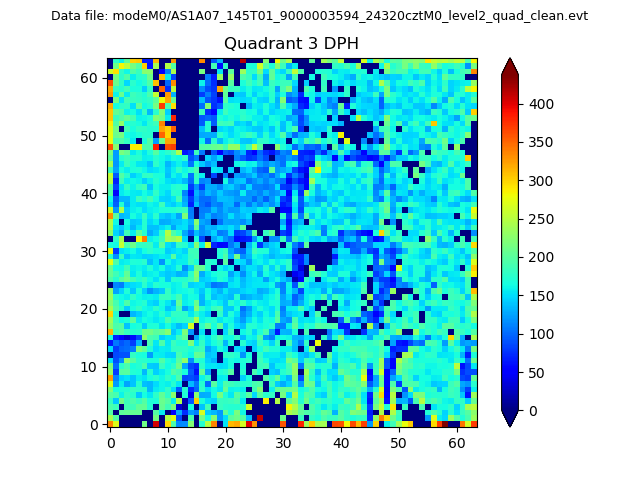 |
 |
Quadrant C |
| Plot type | Count rate plots | Images |
|---|---|---|
| Comparison with Poisson distribution Blue bars denote a histogram of data divided into 1 sec bins. Red curve is a Poisson curve with rate = median count rate of data. |
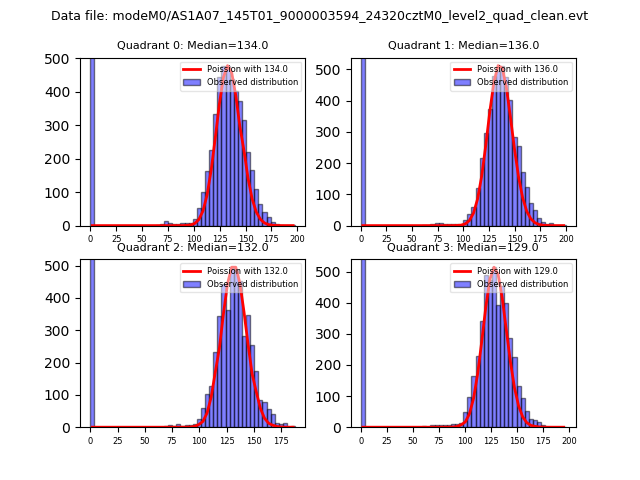 |
 |
| Quadrant-wise count rates Data is divided into 100 sec bins |
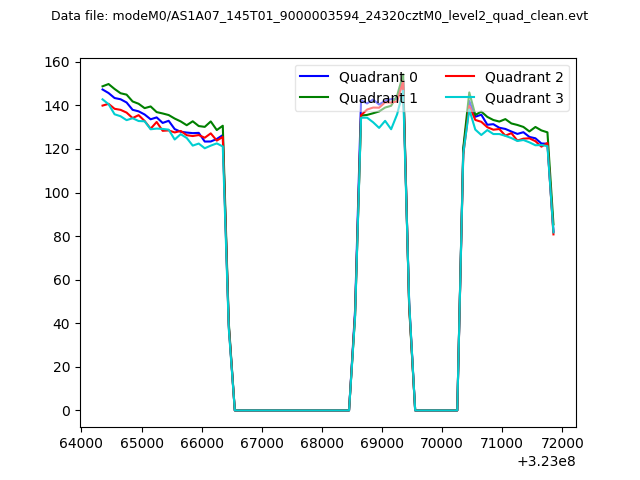 |
|
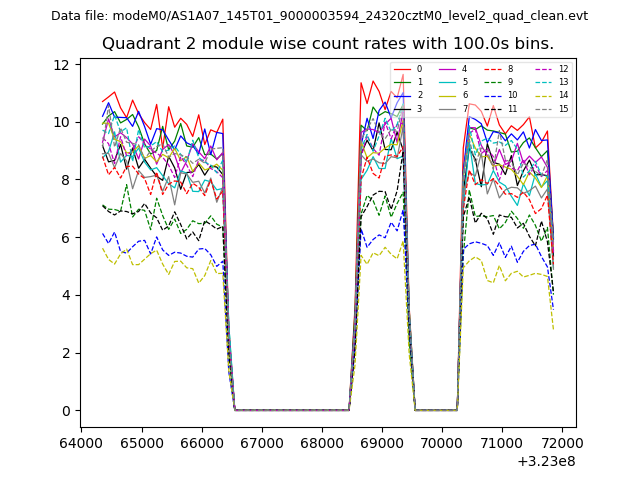
| Module-wise count rates for Quadrant A Data is divided into 100 sec bins |
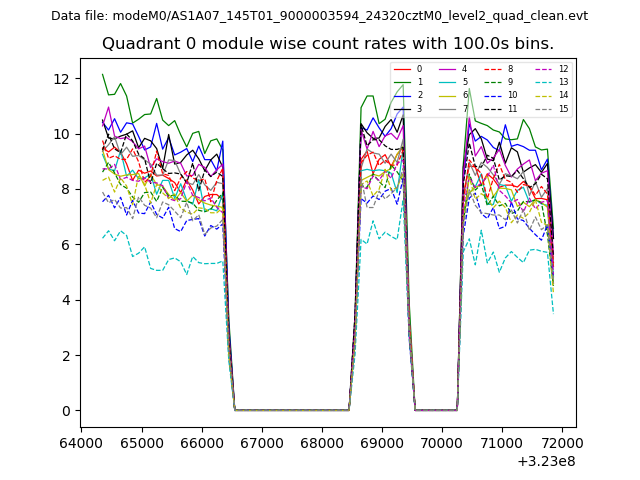 |
 |
| Module-wise count rates for Quadrant B Data is divided into 100 sec bins |
 |
 |
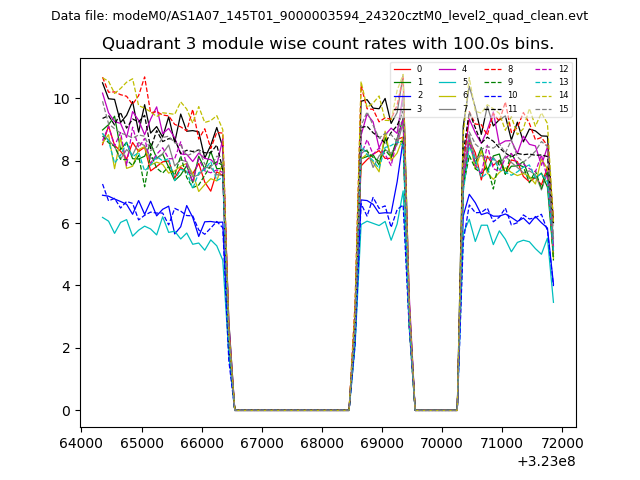
| Module-wise count rates for Quadrant C Data is divided into 100 sec bins |
 |
 |
| Module-wise count rates for Quadrant D Data is divided into 100 sec bins |
 |
 |
| Parameter | Plot |
|---|---|
| CZT HV Monitor | 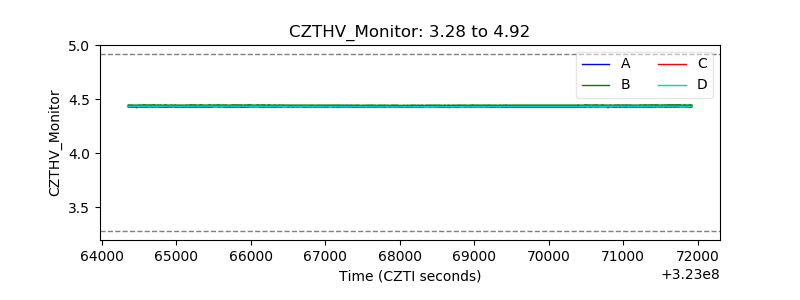 |
| D_VDD | 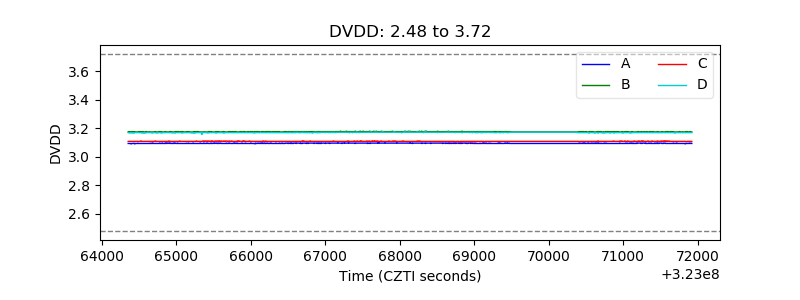 |
| Temperature 1 | 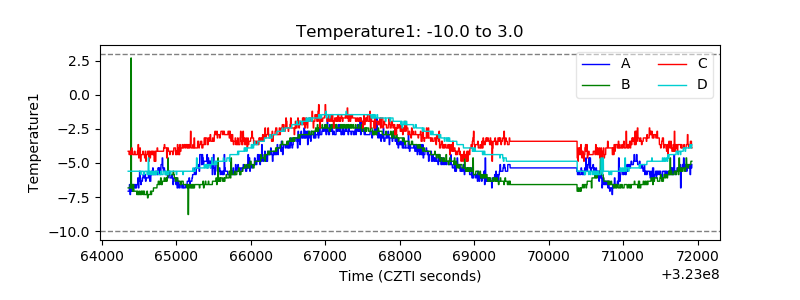 |
| Veto HV Monitor |  |
| Veto LLD | 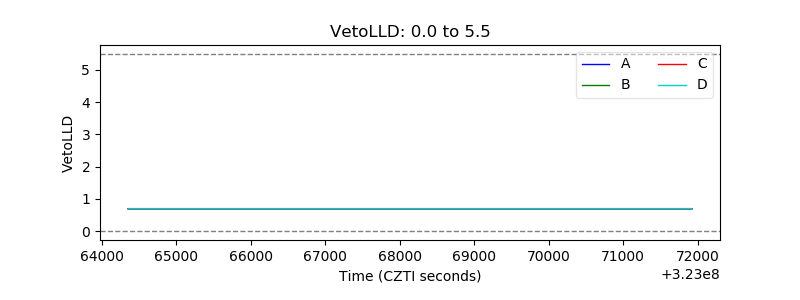 |
| Alpha Counter |  |
| _CPM_Rate | 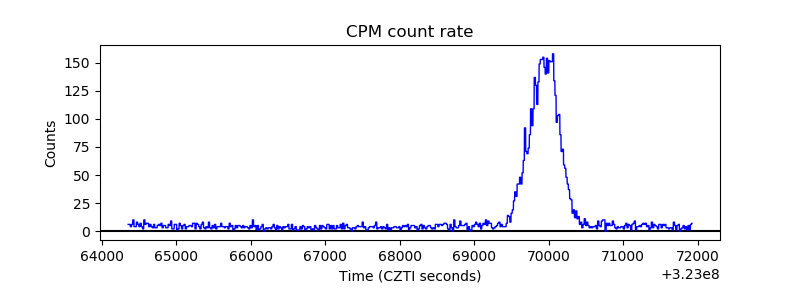 |
| CZT Counter | 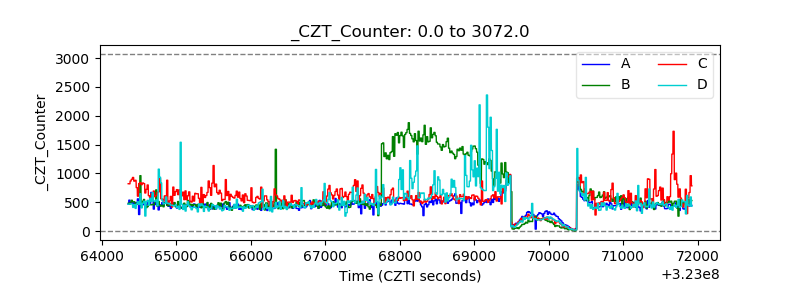 |
| +2.5 Volts monitor |  |
| +5 Volts monitor |  |
| _ROLL_ROT | 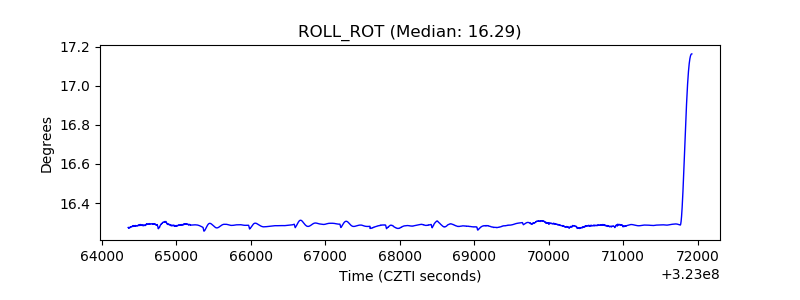 |
| _Roll_DEC | 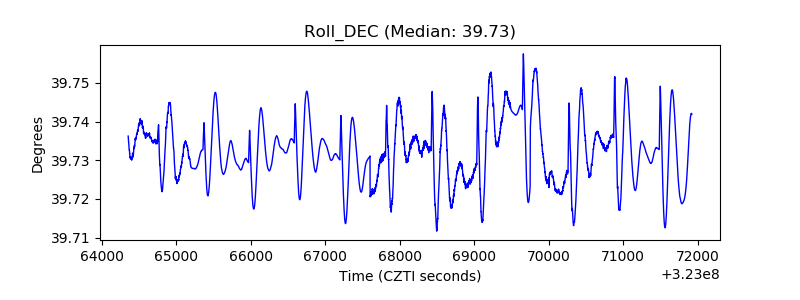 |
| _Roll_RA | 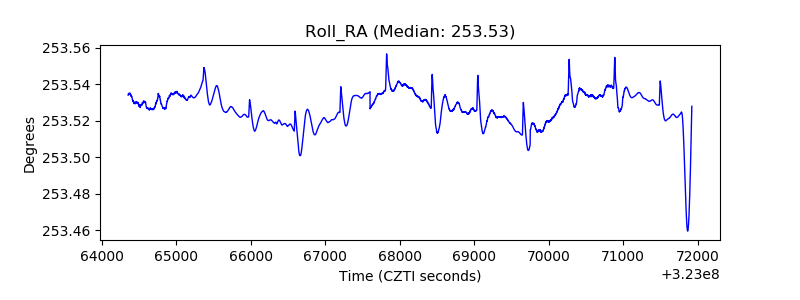 |
| Veto Counter | 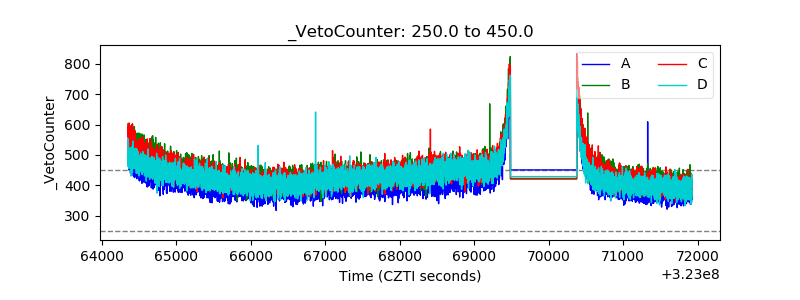 |