| Param | Original file | Final file |
|---|---|---|
| Filename | modeM0/AS1A07_145T01_9000003594_24321cztM0_level2.evt | modeM0/AS1A07_145T01_9000003594_24321cztM0_level2_quad_clean.evt |
| Size (bytes) | 687,813,120 | 104,149,440 |
| Size | 655.9 MB | 99.3 MB |
| Events in quadrant A | 3,450,137 | 668,202 |
| Events in quadrant B | 5,958,423 | 682,908 |
| Events in quadrant C | 6,344,531 | 641,943 |
| Events in quadrant D | 4,578,470 | 646,869 |
| Mode M0 | |||
|---|---|---|---|
| Quadrant | BADHDUFLAG | Total packets | Discarded packets |
| A | 0 | 15107 | 2 |
| B | 0 | 22444 | 2 |
| C | 0 | 24086 | 2 |
| D | 0 | 18701 | 2 |
| Mode M9 | |||
|---|---|---|---|
| Quadrant | BADHDUFLAG | Total packets | Discarded packets |
| A | 0 | 7 | 0 |
| B | 0 | 8 | 0 |
| C | 0 | 8 | 0 |
| D | 0 | 8 | 0 |
| Mode SS | |||
|---|---|---|---|
| Quadrant | BADHDUFLAG | Total packets | Discarded packets |
| A | 0 | 150 | 0 |
| B | 0 | 150 | 0 |
| C | 0 | 150 | 0 |
| D | 0 | 150 | 0 |
| Quadrant | Total seconds | Saturated seconds | Saturation percentage |
|---|---|---|---|
| A | 7383 | 105 | 1.422186% |
| B | 7383 | 271 | 3.670595% |
| C | 7382 | 692 | 9.374153% |
| D | 7382 | 162 | 2.194527% |
Noise dominated data is calculated using 1-second bins in cleaned event files. If a bin has >2000 counts, and if more than 50% of those come from <1% of pixels, then it is considered to be noise-dominated and hence unusable.
| Quadrant | # 1 sec bins | Bins with >0 counts | Bins with >2000 counts | High rate bins dominated by noise | Noise dominated (total time) | Noise dominated (detector-on time) | Marked lightcurve |
|---|---|---|---|---|---|---|---|
| A | 7873 | 7383 | 0 | 0 | 0.00% | 0.00% | 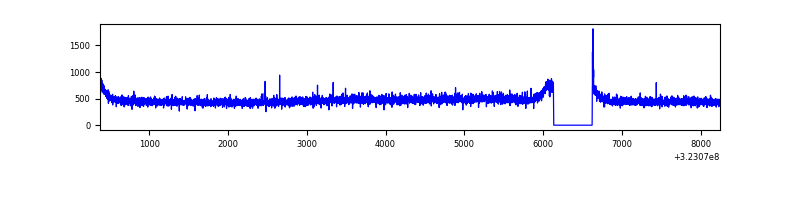 |
| B | 7873 | 7383 | 0 | 0 | 0.00% | 0.00% | 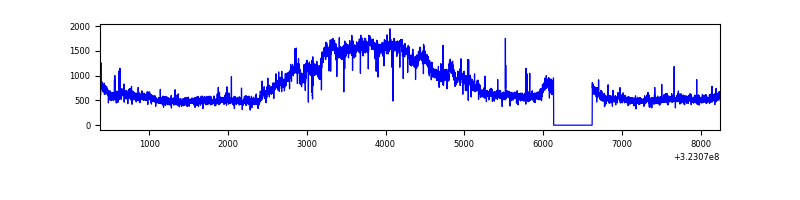 |
| C | 7872 | 7382 | 390 | 390 | 4.95% | 5.28% | 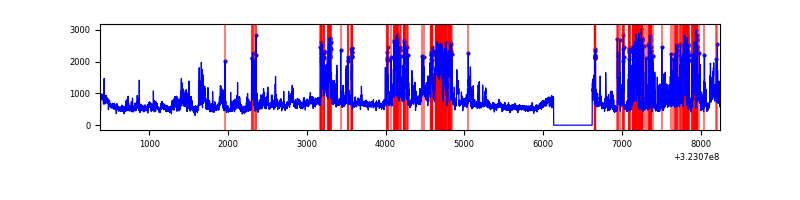 |
| D | 7872 | 7382 | 79 | 79 | 1.00% | 1.07% | 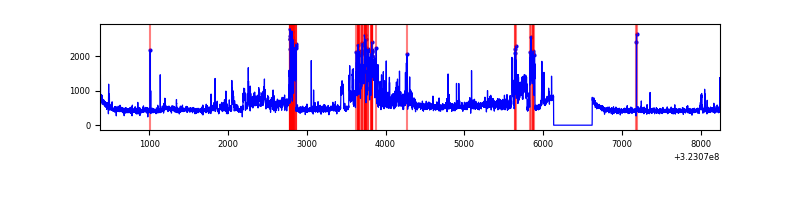 |
Top three noisy pixels from each quadrant. If the there are fewer than three noisy pixels in the level2.evt file, extra rows are filled as -1
| Pixel properties | Quadrant properties | ||||||
|---|---|---|---|---|---|---|---|
| Quadrant | DetID | PixID | Counts | Sigma | Mean | Median | Sigma |
| A | 3 | 1 | 16741 | 88.78 | 890 | 870 | 178.8 |
| A | 13 | 254 | 10468 | 53.69 | 890 | 870 | 178.8 |
| A | 3 | 137 | 8311 | 41.62 | 890 | 870 | 178.8 |
| B | 4 | 200 | 2439865 | 14298.95 | 886 | 864 | 170.6 |
| B | 0 | 219 | 38165 | 218.68 | 886 | 864 | 170.6 |
| B | 12 | 111 | 20951 | 117.76 | 886 | 864 | 170.6 |
| C | 2 | 16 | 1738557 | 8915.27 | 835 | 841 | 194.9 |
| C | 7 | 247 | 731400 | 3748.1 | 835 | 841 | 194.9 |
| C | 3 | 233 | 477972 | 2447.9 | 835 | 841 | 194.9 |
| D | 1 | 52 | 754733 | 3552.69 | 863 | 835 | 212.2 |
| D | 12 | 218 | 454575 | 2138.22 | 863 | 835 | 212.2 |
| D | 8 | 195 | 70736 | 329.4 | 863 | 835 | 212.2 |
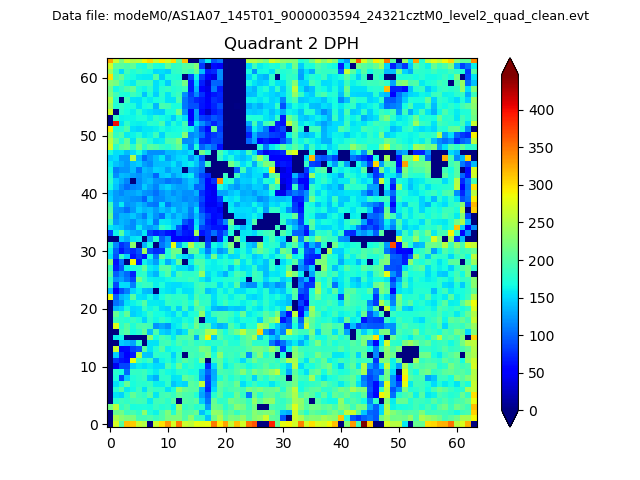
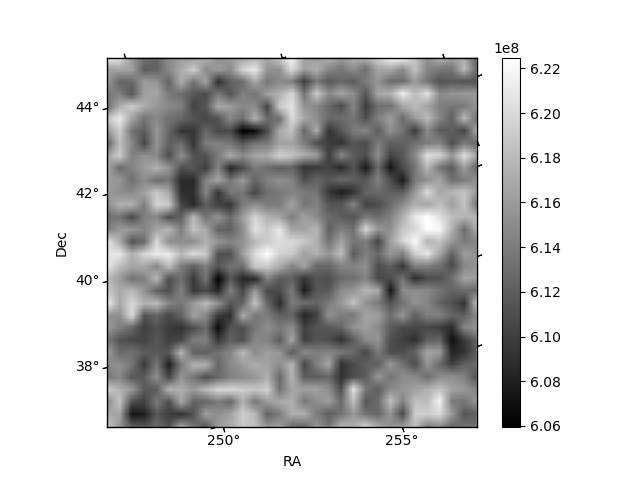
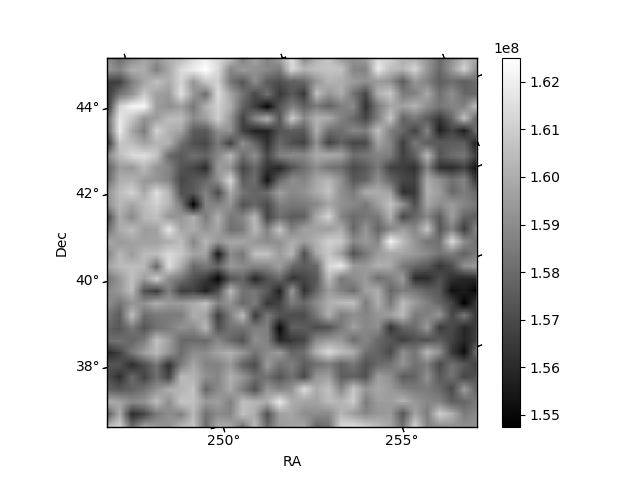
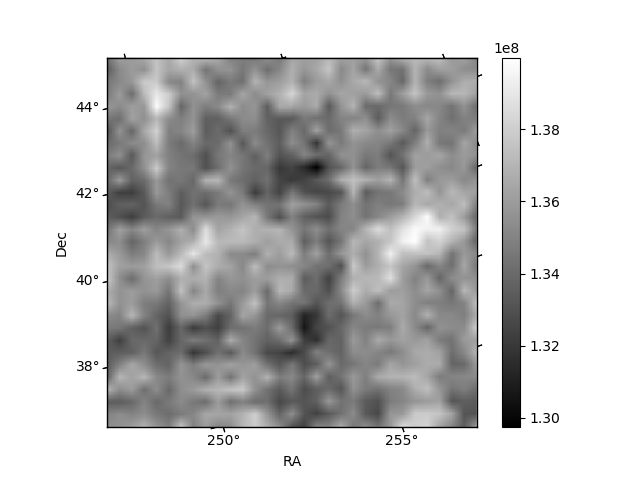
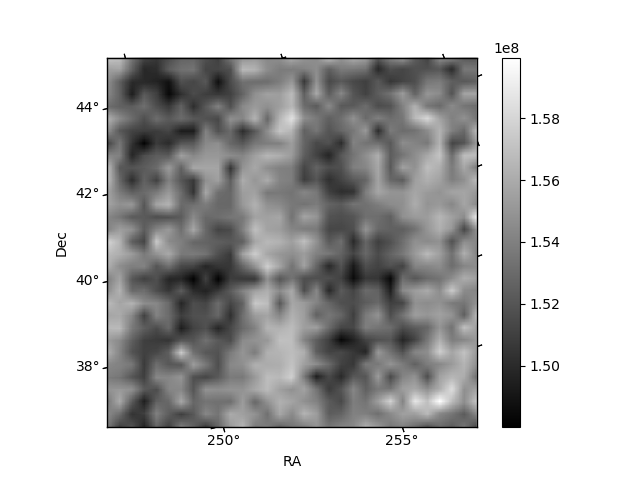
Histogram calculated using DETX and DETY for each event in the final _common_clean file
| Quadrant A | 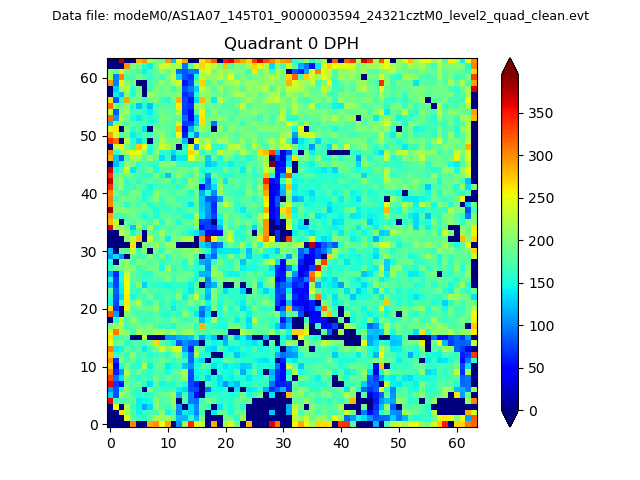 |
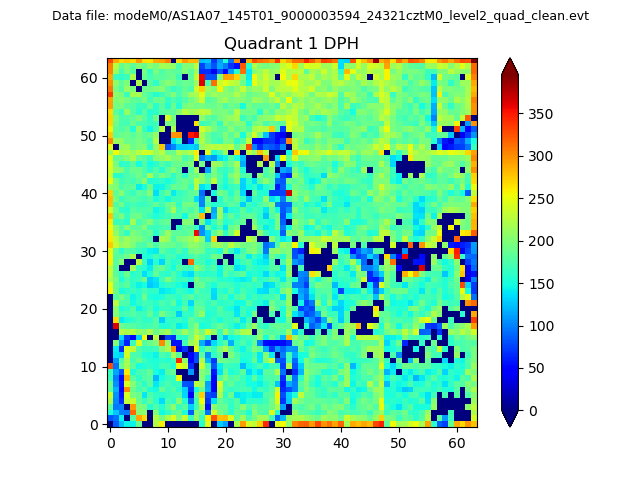 |
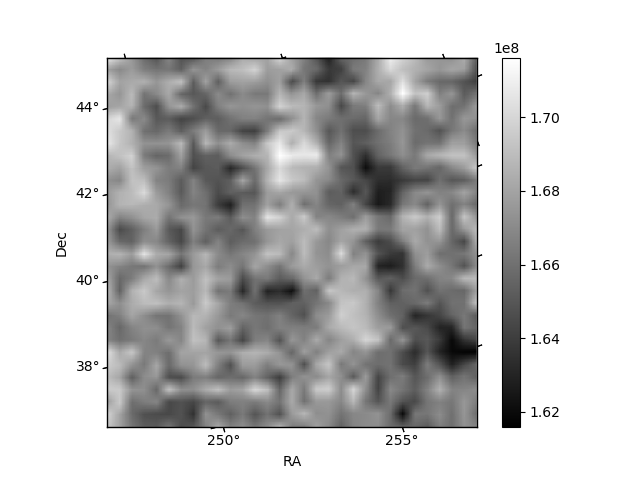
Quadrant B |
|---|---|---|---|
| Quadrant D | 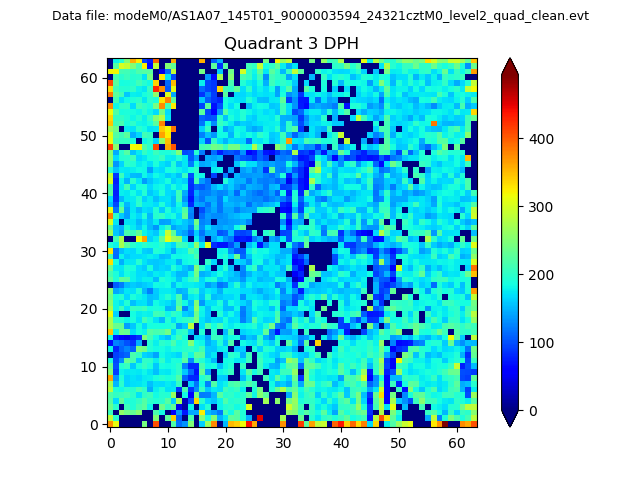 |
 |
Quadrant C |
| Plot type | Count rate plots | Images |
|---|---|---|
| Comparison with Poisson distribution Blue bars denote a histogram of data divided into 1 sec bins. Red curve is a Poisson curve with rate = median count rate of data. |
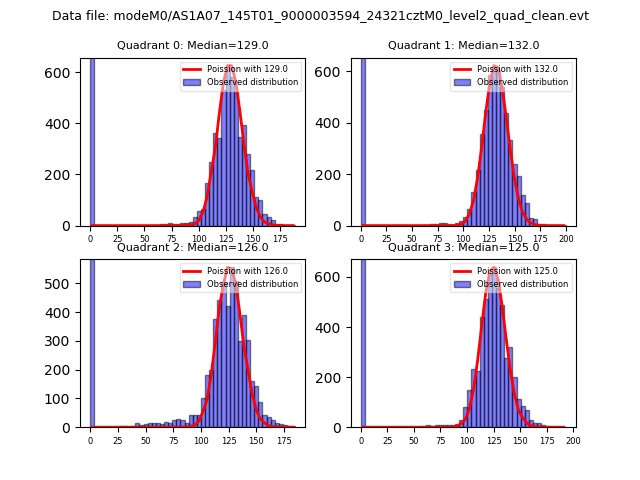 |
 |
| Quadrant-wise count rates Data is divided into 100 sec bins |
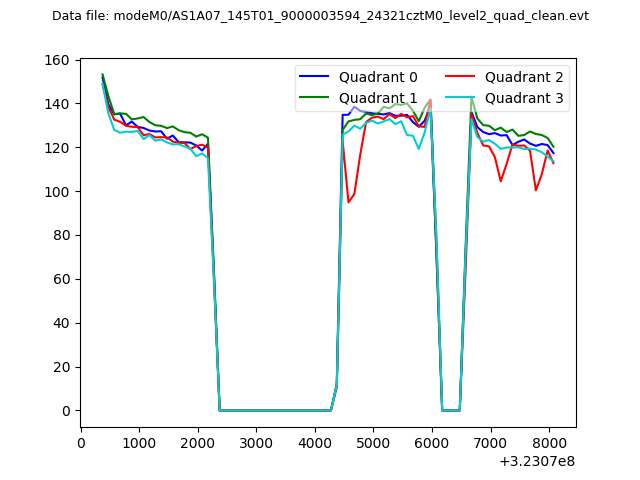 |
|
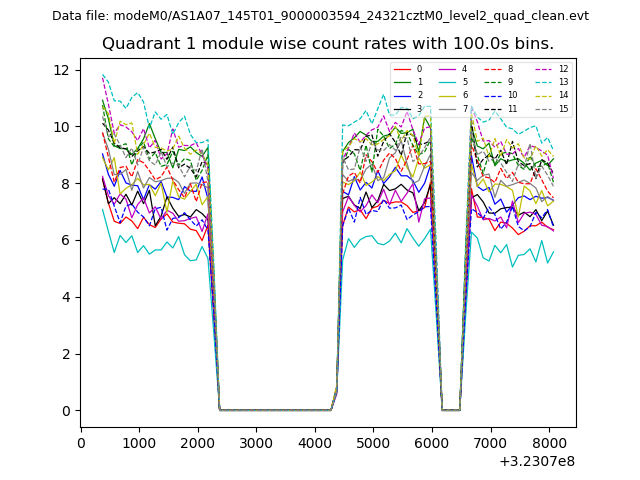
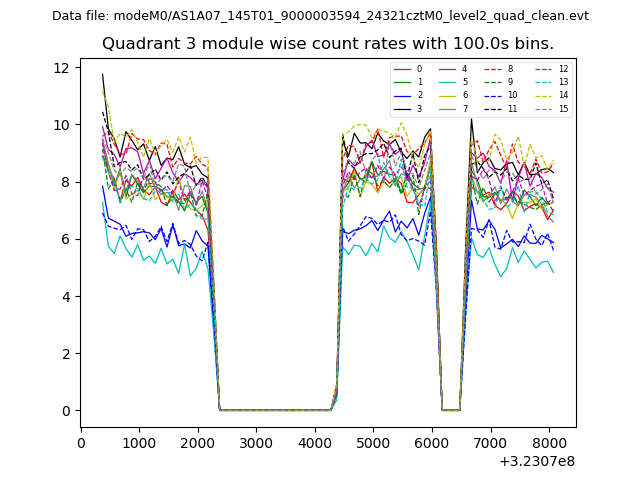
| Module-wise count rates for Quadrant A Data is divided into 100 sec bins |
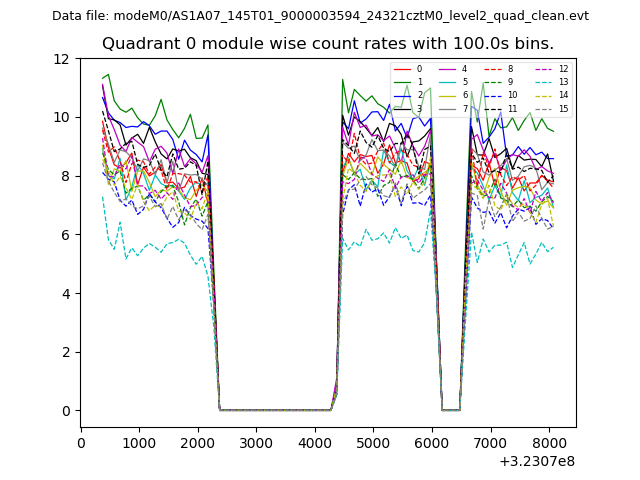 |
 |
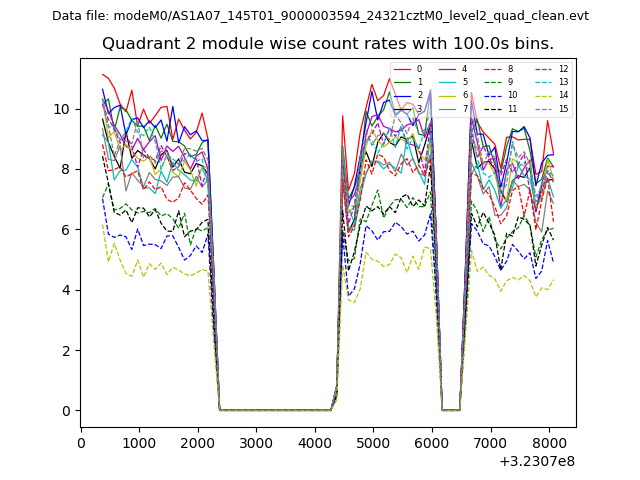
| Module-wise count rates for Quadrant B Data is divided into 100 sec bins |
 |
 |
| Module-wise count rates for Quadrant C Data is divided into 100 sec bins |
 |
 |
| Module-wise count rates for Quadrant D Data is divided into 100 sec bins |
 |
 |
| Parameter | Plot |
|---|---|
| CZT HV Monitor | 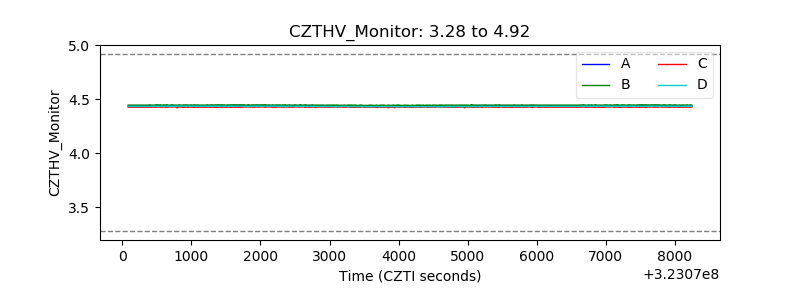 |
| D_VDD | 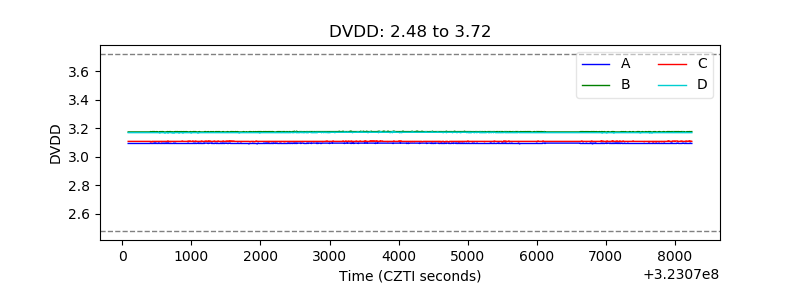 |
| Temperature 1 | 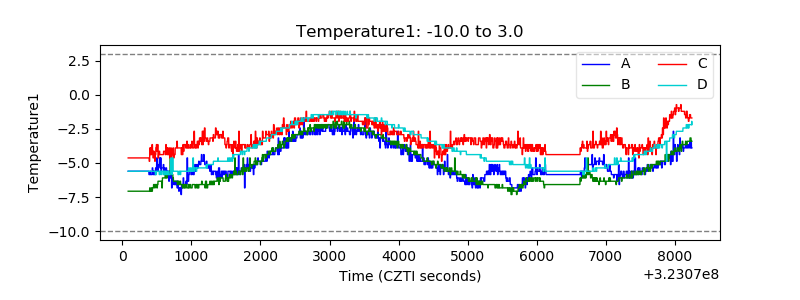 |
| Veto HV Monitor | 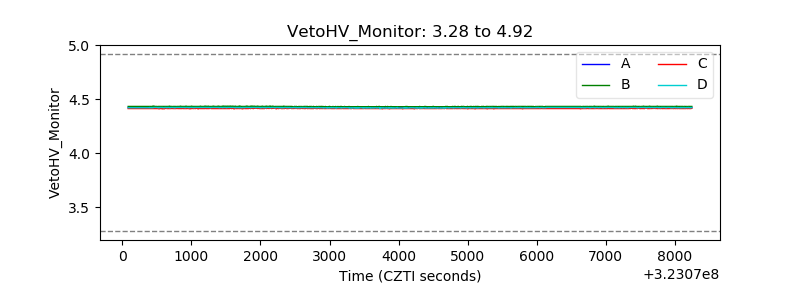 |
| Veto LLD | 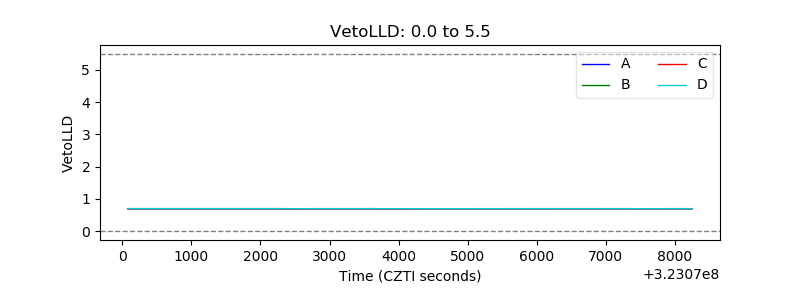 |
| Alpha Counter | 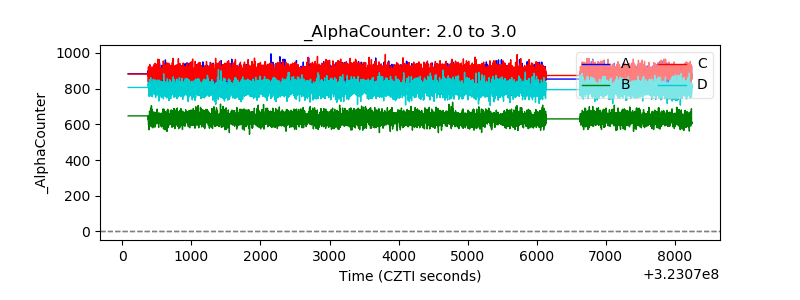 |
| _CPM_Rate | 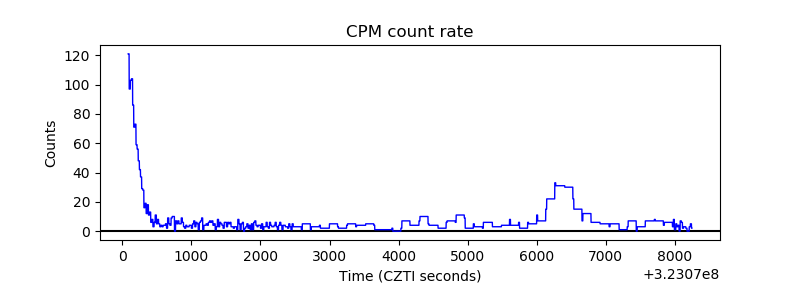 |
| CZT Counter | 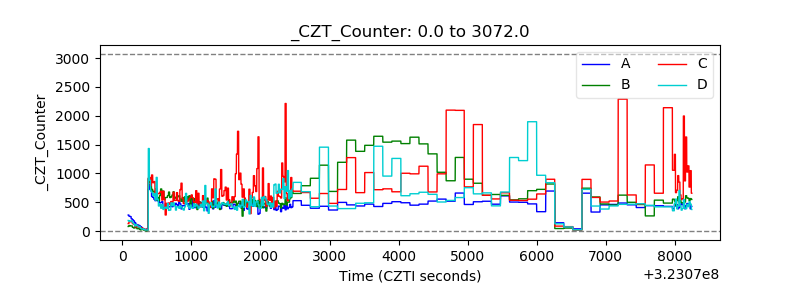 |
| +2.5 Volts monitor |  |
| +5 Volts monitor | 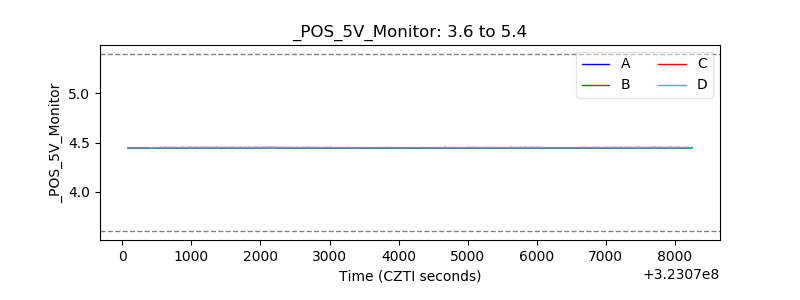 |
| _ROLL_ROT |  |
| _Roll_DEC | 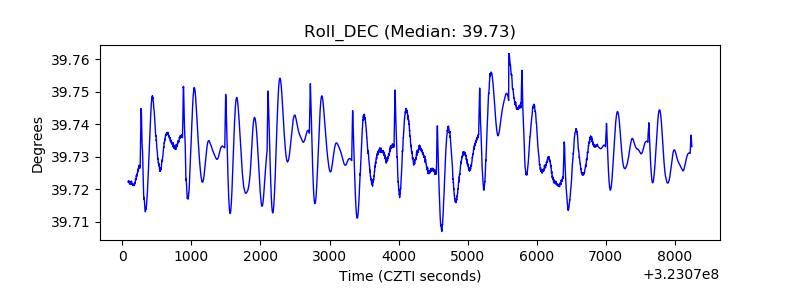 |
| _Roll_RA | 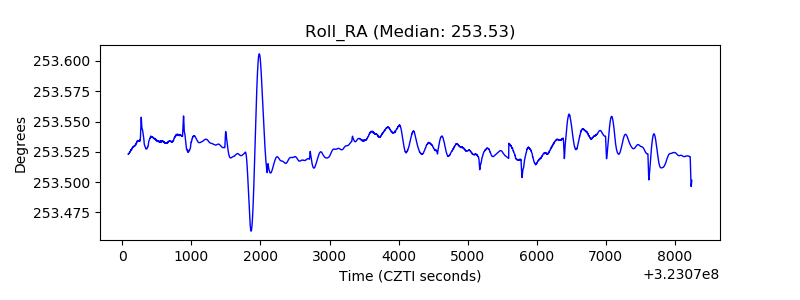 |
| Veto Counter | 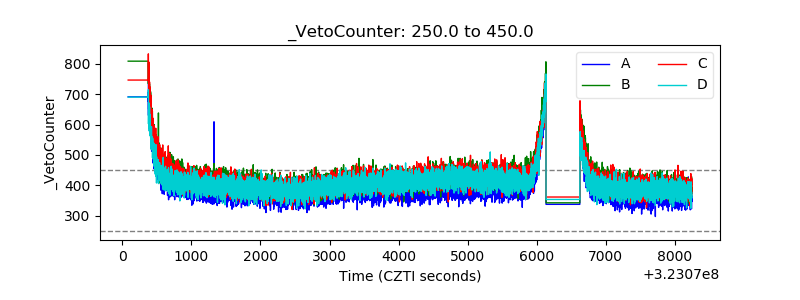 |