| Param | Original file | Final file |
|---|---|---|
| Filename | modeM0/AS1A07_145T01_9000003594_24323cztM0_level2.evt | modeM0/AS1A07_145T01_9000003594_24323cztM0_level2_quad_clean.evt |
| Size (bytes) | 848,401,920 | 89,907,840 |
| Size | 809.1 MB | 85.7 MB |
| Events in quadrant A | 3,580,040 | 562,176 |
| Events in quadrant B | 10,505,819 | 555,084 |
| Events in quadrant C | 5,550,456 | 542,420 |
| Events in quadrant D | 5,545,280 | 533,608 |
| Mode M0 | |||
|---|---|---|---|
| Quadrant | BADHDUFLAG | Total packets | Discarded packets |
| A | 0 | 15551 | 1 |
| B | 0 | 36625 | 1 |
| C | 0 | 21489 | 1 |
| D | 0 | 21454 | 1 |
| Mode M9 | |||
|---|---|---|---|
| Quadrant | BADHDUFLAG | Total packets | Discarded packets |
| A | 0 | 3 | 0 |
| B | 0 | 3 | 0 |
| C | 0 | 3 | 0 |
| D | 0 | 3 | 0 |
| Mode SS | |||
|---|---|---|---|
| Quadrant | BADHDUFLAG | Total packets | Discarded packets |
| A | 0 | 156 | 0 |
| B | 0 | 156 | 0 |
| C | 0 | 156 | 0 |
| D | 0 | 156 | 0 |
| Quadrant | Total seconds | Saturated seconds | Saturation percentage |
|---|---|---|---|
| A | 7605 | 124 | 1.630506% |
| B | 7605 | 1536 | 20.197239% |
| C | 7605 | 391 | 5.141354% |
| D | 7606 | 447 | 5.876939% |
Noise dominated data is calculated using 1-second bins in cleaned event files. If a bin has >2000 counts, and if more than 50% of those come from <1% of pixels, then it is considered to be noise-dominated and hence unusable.
| Quadrant | # 1 sec bins | Bins with >0 counts | Bins with >2000 counts | High rate bins dominated by noise | Noise dominated (total time) | Noise dominated (detector-on time) | Marked lightcurve |
|---|---|---|---|---|---|---|---|
| A | 7880 | 7605 | 0 | 0 | 0.00% | 0.00% | 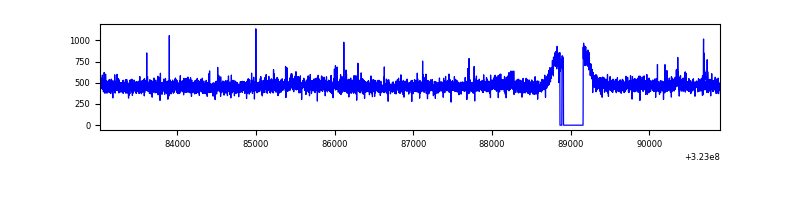 |
| B | 7880 | 7605 | 960 | 960 | 12.18% | 12.62% | 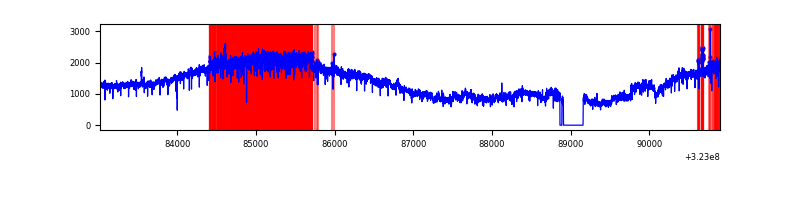 |
| C | 7880 | 7605 | 134 | 134 | 1.70% | 1.76% | 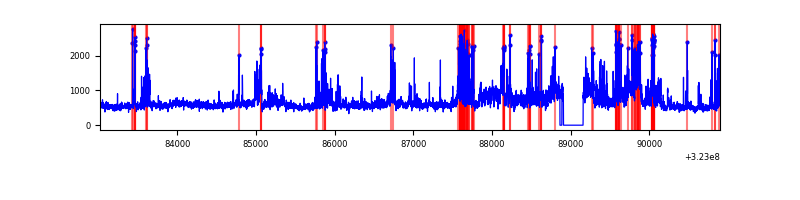 |
| D | 7881 | 7606 | 316 | 316 | 4.01% | 4.15% | 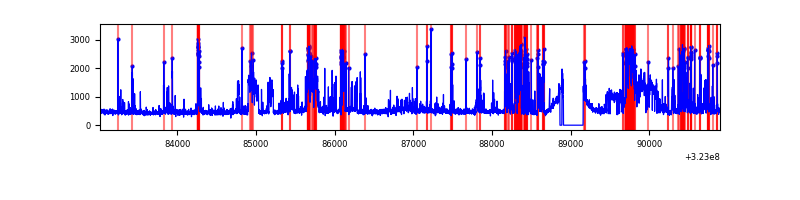 |
Top three noisy pixels from each quadrant. If the there are fewer than three noisy pixels in the level2.evt file, extra rows are filled as -1
| Pixel properties | Quadrant properties | ||||||
|---|---|---|---|---|---|---|---|
| Quadrant | DetID | PixID | Counts | Sigma | Mean | Median | Sigma |
| A | 3 | 1 | 26737 | 138.12 | 921 | 899 | 187.1 |
| A | 13 | 254 | 11885 | 58.73 | 921 | 899 | 187.1 |
| A | 3 | 137 | 8462 | 40.43 | 921 | 899 | 187.1 |
| B | 4 | 200 | 6917752 | 39931.79 | 887 | 861 | 173.2 |
| B | 0 | 219 | 52391 | 297.49 | 887 | 861 | 173.2 |
| B | 12 | 17 | 24155 | 134.48 | 887 | 861 | 173.2 |
| C | 2 | 16 | 1034740 | 5088.86 | 869 | 873 | 203.2 |
| C | 7 | 247 | 827930 | 4070.91 | 869 | 873 | 203.2 |
| C | 14 | 238 | 136485 | 667.5 | 869 | 873 | 203.2 |
| D | 1 | 52 | 979097 | 4541.42 | 874 | 846 | 215.4 |
| D | 12 | 218 | 592825 | 2748.19 | 874 | 846 | 215.4 |
| D | 7 | 223 | 443928 | 2056.96 | 874 | 846 | 215.4 |
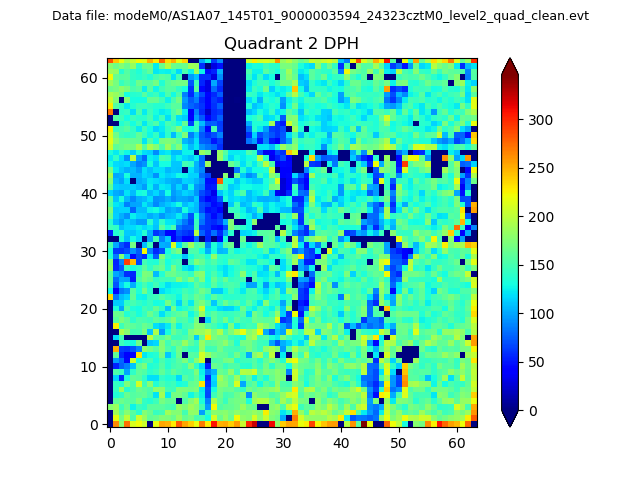
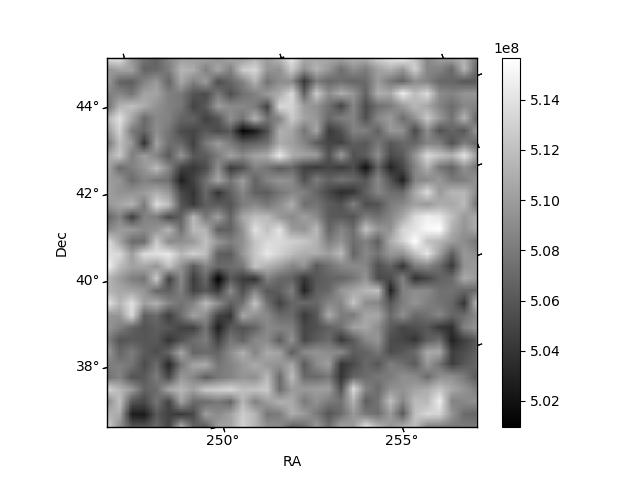
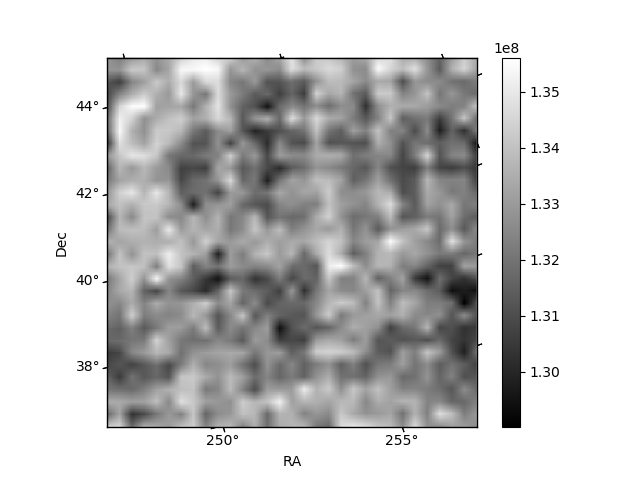
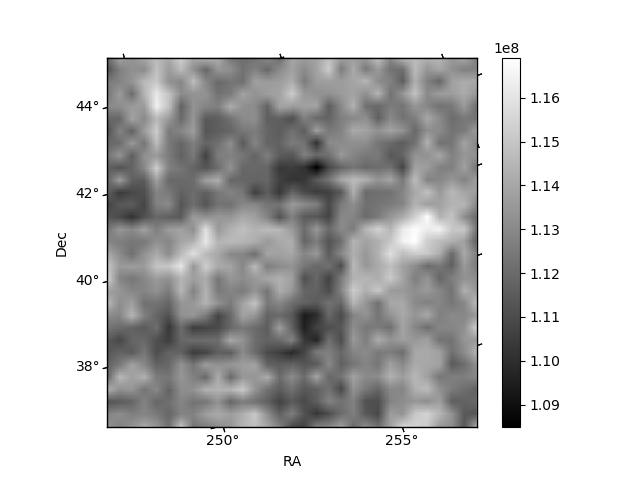
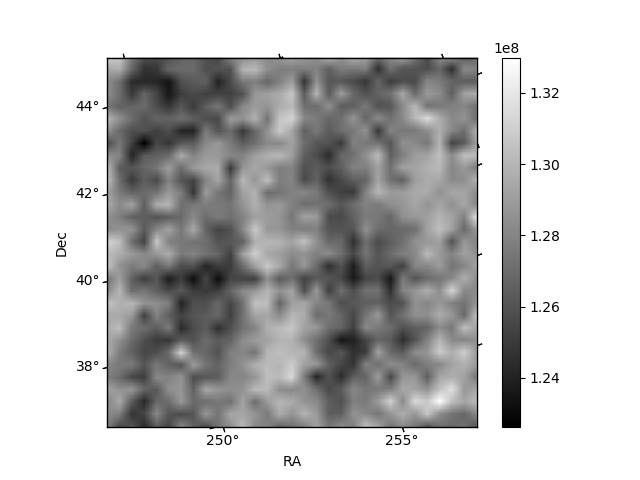
Histogram calculated using DETX and DETY for each event in the final _common_clean file
| Quadrant A | 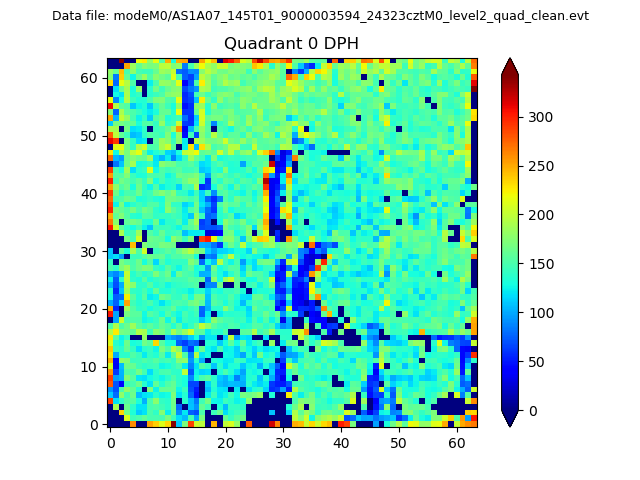 |
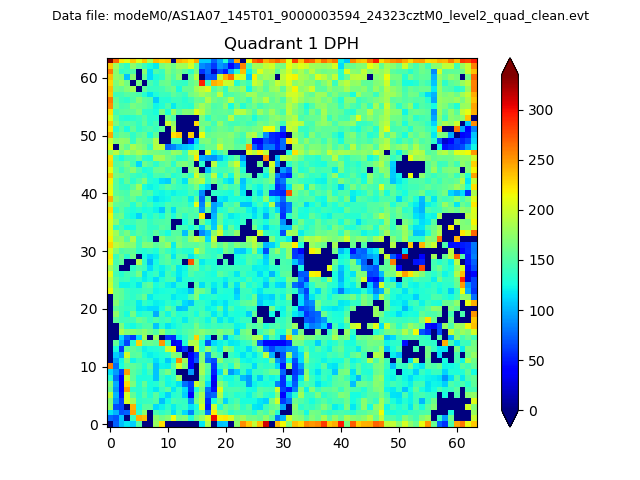 |
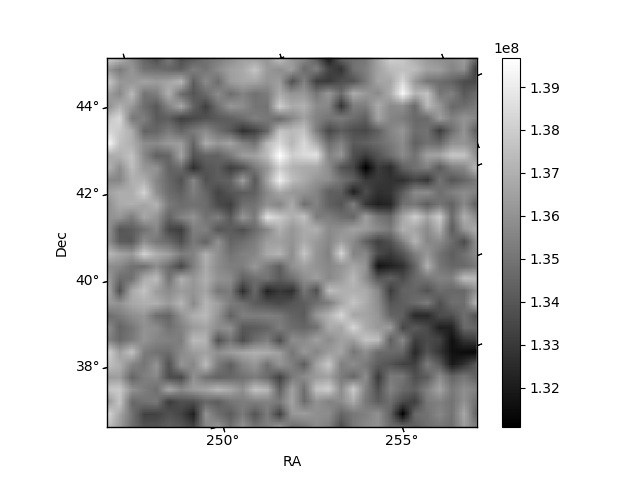
Quadrant B |
|---|---|---|---|
| Quadrant D | 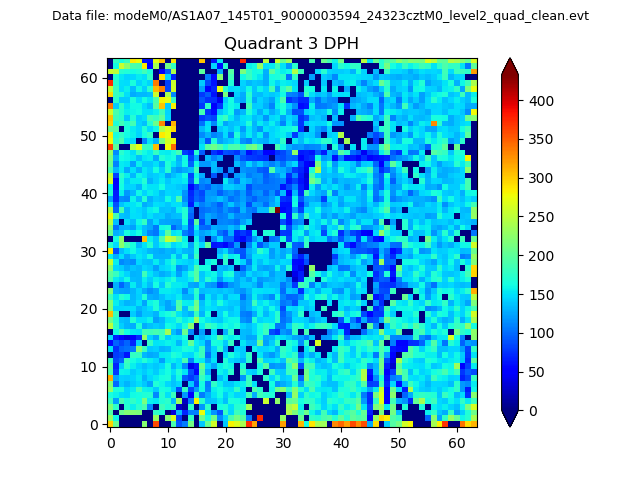 |
 |
Quadrant C |
| Plot type | Count rate plots | Images |
|---|---|---|
| Comparison with Poisson distribution Blue bars denote a histogram of data divided into 1 sec bins. Red curve is a Poisson curve with rate = median count rate of data. |
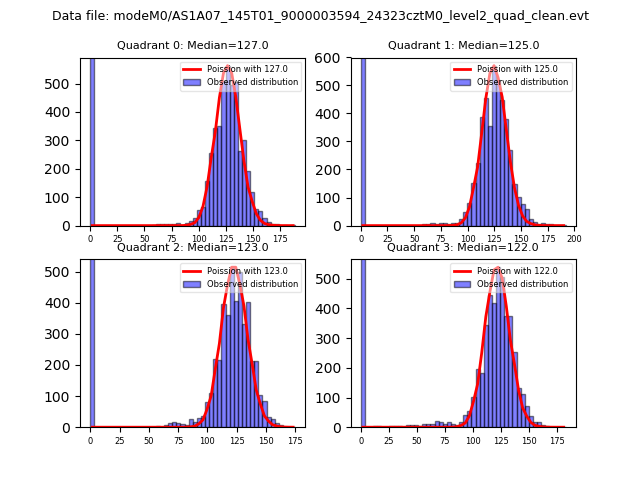 |
 |
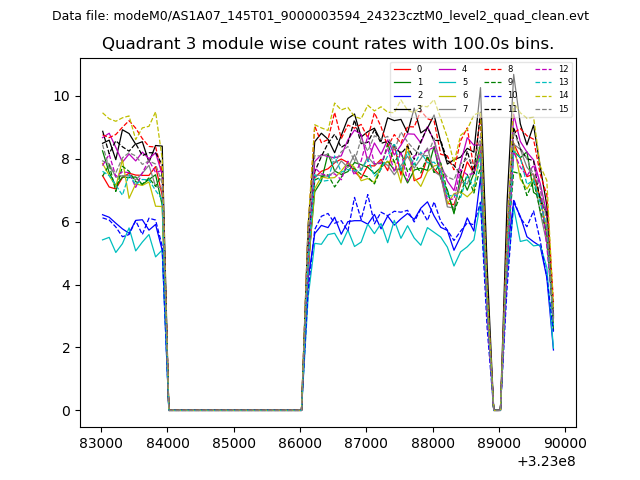
| Quadrant-wise count rates Data is divided into 100 sec bins |
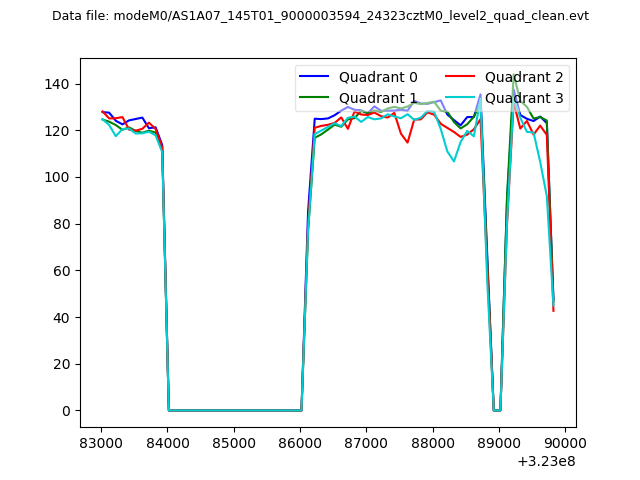 |
|
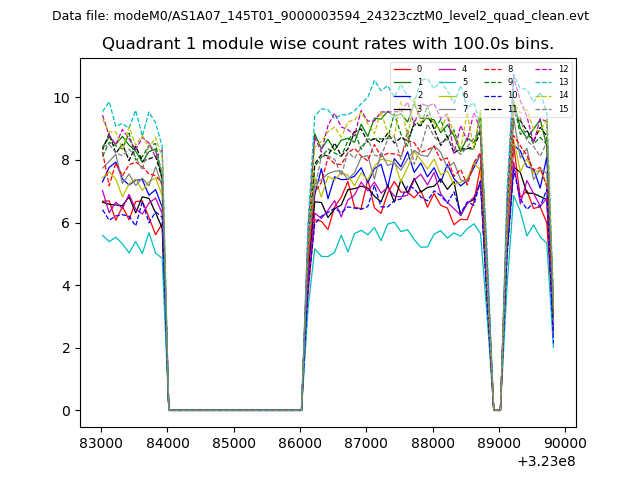
| Module-wise count rates for Quadrant A Data is divided into 100 sec bins |
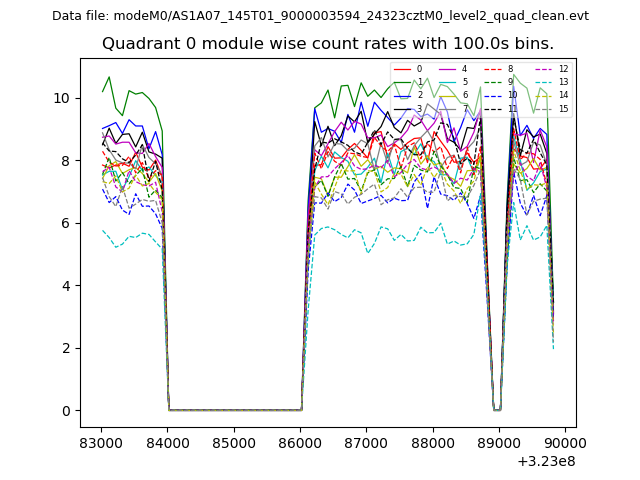 |
 |
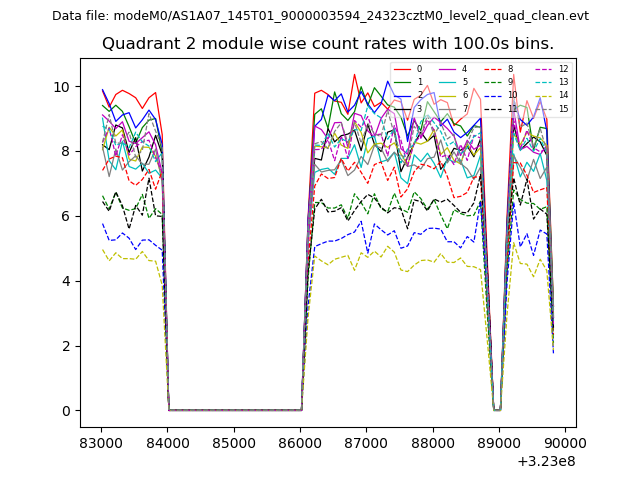
| Module-wise count rates for Quadrant B Data is divided into 100 sec bins |
 |
 |
| Module-wise count rates for Quadrant C Data is divided into 100 sec bins |
 |
 |
| Module-wise count rates for Quadrant D Data is divided into 100 sec bins |
 |
 |
| Parameter | Plot |
|---|---|
| CZT HV Monitor | 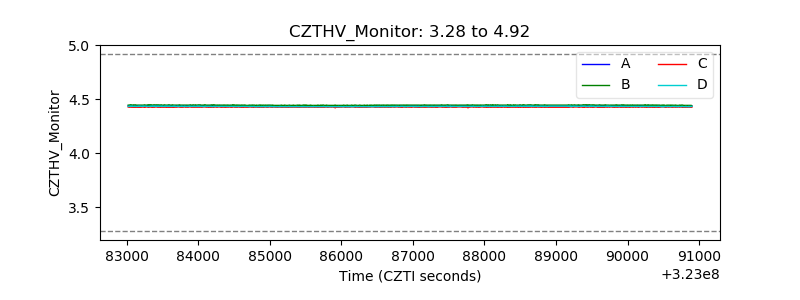 |
| D_VDD | 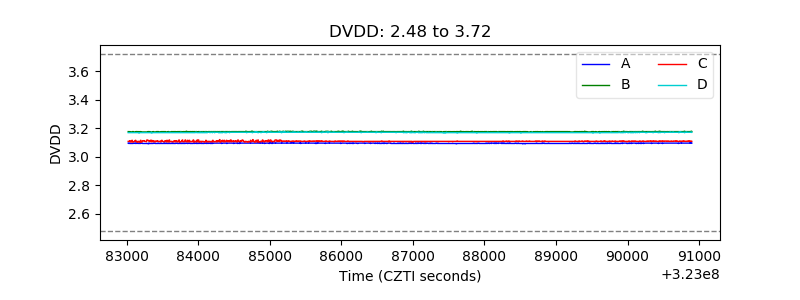 |
| Temperature 1 | 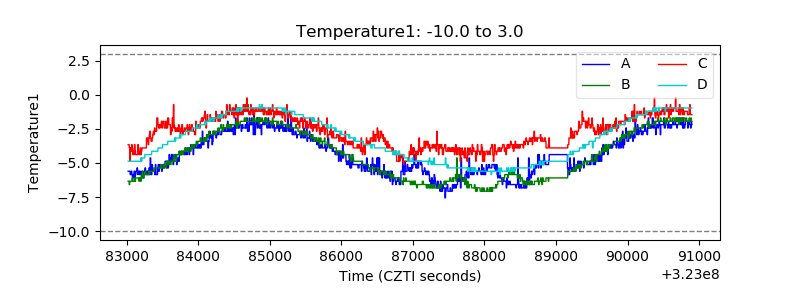 |
| Veto HV Monitor | 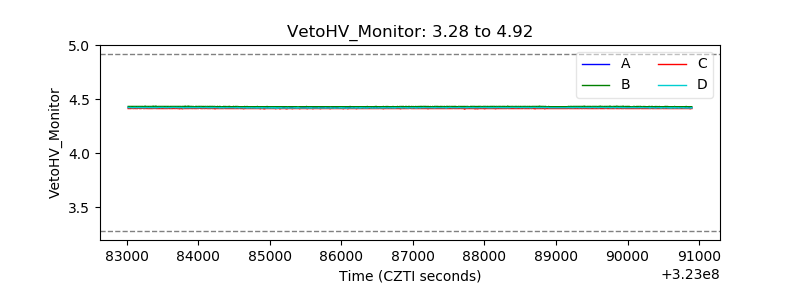 |
| Veto LLD | 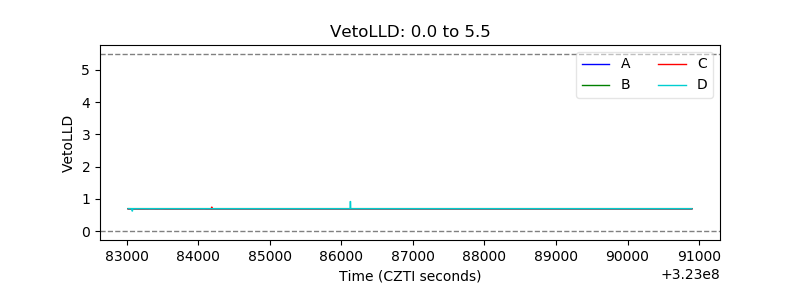 |
| Alpha Counter | 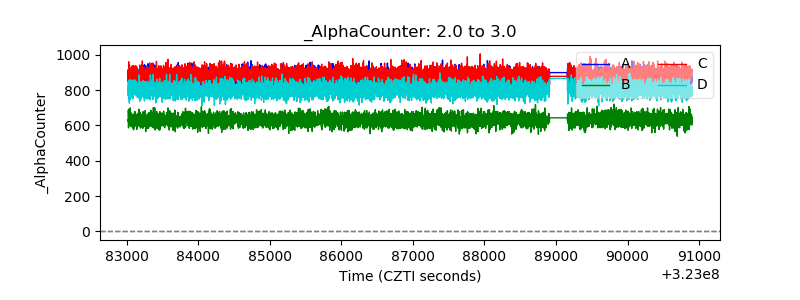 |
| _CPM_Rate | 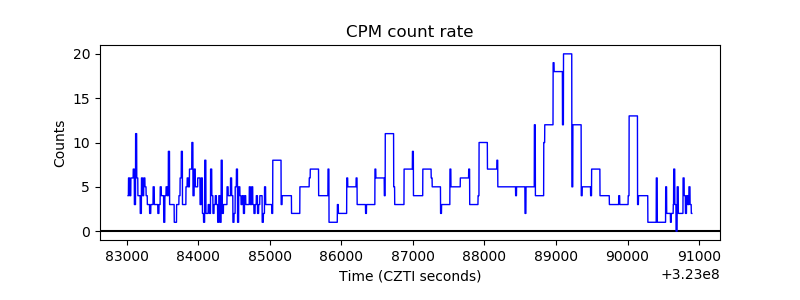 |
| CZT Counter | 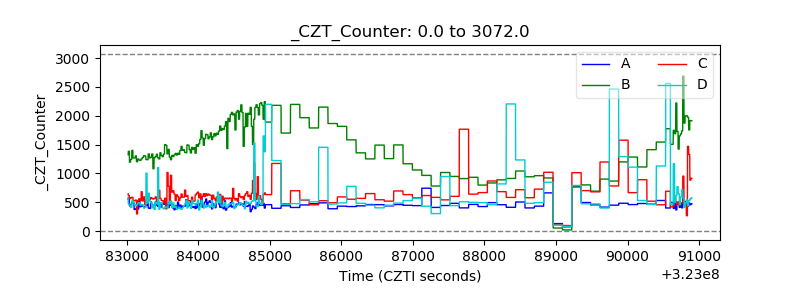 |
| +2.5 Volts monitor | 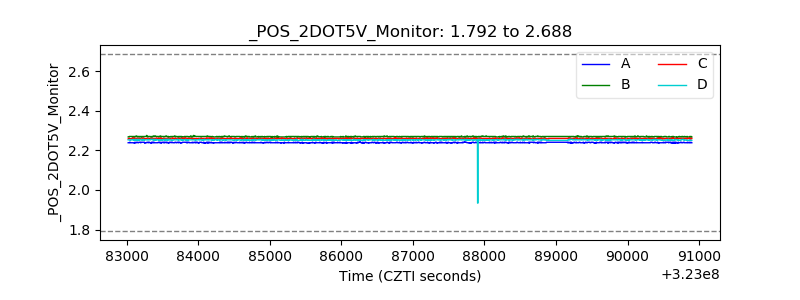 |
| +5 Volts monitor |  |
| _ROLL_ROT | 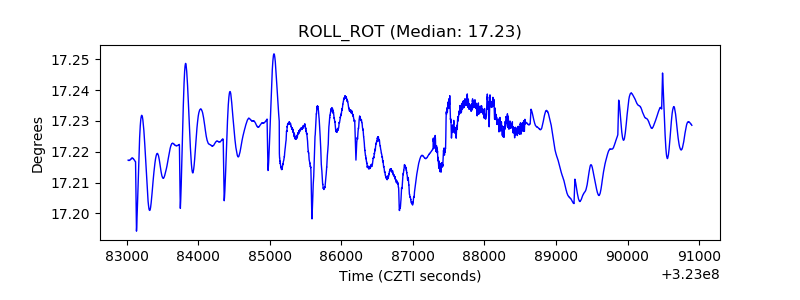 |
| _Roll_DEC |  |
| _Roll_RA | 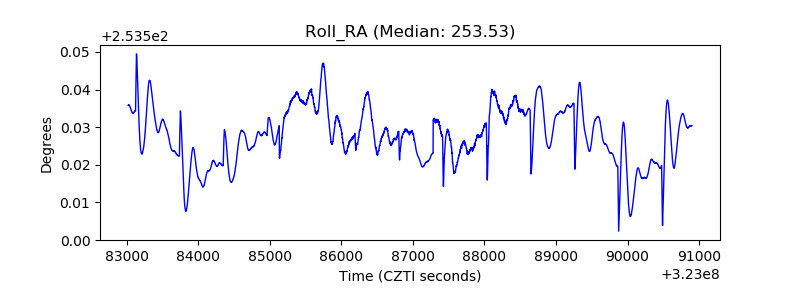 |
| Veto Counter | 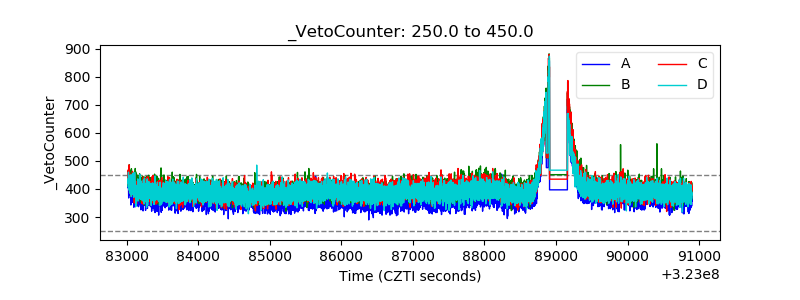 |