| Param | Original file | Final file |
|---|---|---|
| Filename | modeM0/AS1A07_145T01_9000003594_24326cztM0_level2.evt | modeM0/AS1A07_145T01_9000003594_24326cztM0_level2_quad_clean.evt |
| Size (bytes) | 1,708,920,000 | 218,257,920 |
| Size | 1.6 GB | 208.1 MB |
| Events in quadrant A | 8,656,162 | 1,360,105 |
| Events in quadrant B | 15,892,023 | 1,368,550 |
| Events in quadrant C | 12,501,459 | 1,322,078 |
| Events in quadrant D | 13,468,887 | 1,293,032 |
| Mode M0 | |||
|---|---|---|---|
| Quadrant | BADHDUFLAG | Total packets | Discarded packets |
| A | 0 | 37563 | 3 |
| B | 0 | 58955 | 3 |
| C | 0 | 49032 | 3 |
| D | 0 | 52383 | 3 |
| Mode M9 | |||
|---|---|---|---|
| Quadrant | BADHDUFLAG | Total packets | Discarded packets |
| A | 0 | 20 | 0 |
| B | 0 | 20 | 0 |
| C | 0 | 20 | 0 |
| D | 0 | 20 | 0 |
| Mode SS | |||
|---|---|---|---|
| Quadrant | BADHDUFLAG | Total packets | Discarded packets |
| A | 0 | 374 | 0 |
| B | 0 | 374 | 0 |
| C | 0 | 374 | 0 |
| D | 0 | 374 | 0 |
| Quadrant | Total seconds | Saturated seconds | Saturation percentage |
|---|---|---|---|
| A | 18373 | 163 | 0.887171% |
| B | 18373 | 1294 | 7.042943% |
| C | 18373 | 838 | 4.561041% |
| D | 18374 | 700 | 3.809731% |
Noise dominated data is calculated using 1-second bins in cleaned event files. If a bin has >2000 counts, and if more than 50% of those come from <1% of pixels, then it is considered to be noise-dominated and hence unusable.
| Quadrant | # 1 sec bins | Bins with >0 counts | Bins with >2000 counts | High rate bins dominated by noise | Noise dominated (total time) | Noise dominated (detector-on time) | Marked lightcurve |
|---|---|---|---|---|---|---|---|
| A | 20403 | 18373 | 2 | 2 | 0.01% | 0.01% | 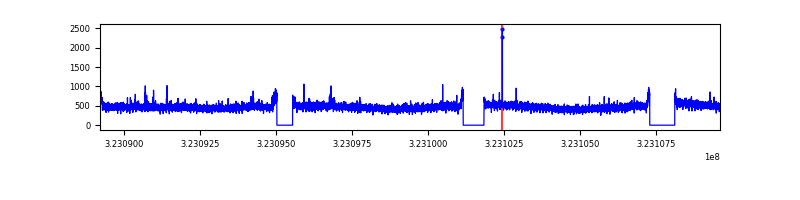 |
| B | 20403 | 18373 | 291 | 291 | 1.43% | 1.58% | 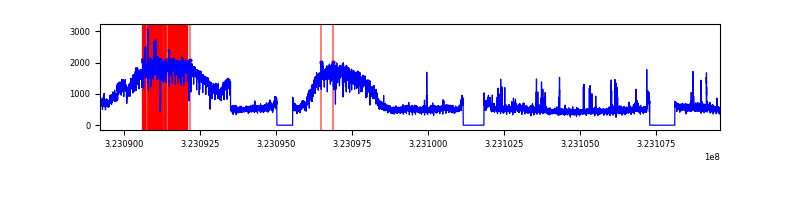 |
| C | 20403 | 18373 | 378 | 378 | 1.85% | 2.06% | 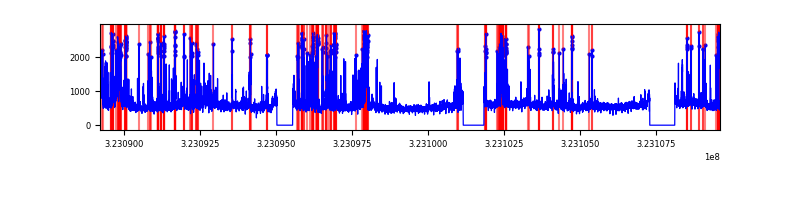 |
| D | 20404 | 18374 | 455 | 455 | 2.23% | 2.48% | 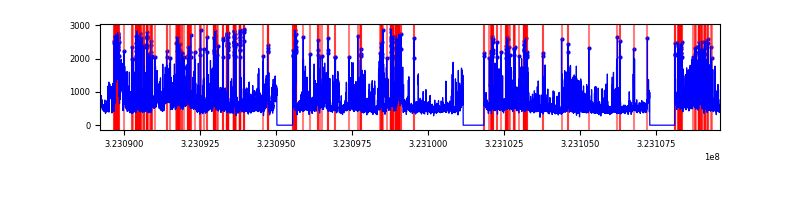 |
Top three noisy pixels from each quadrant. If the there are fewer than three noisy pixels in the level2.evt file, extra rows are filled as -1
| Pixel properties | Quadrant properties | ||||||
|---|---|---|---|---|---|---|---|
| Quadrant | DetID | PixID | Counts | Sigma | Mean | Median | Sigma |
| A | 3 | 1 | 52155 | 111.65 | 2230 | 2182 | 447.6 |
| A | 13 | 254 | 26815 | 55.03 | 2230 | 2182 | 447.6 |
| A | 3 | 137 | 20605 | 41.16 | 2230 | 2182 | 447.6 |
| B | 4 | 200 | 7075444 | 16817.01 | 2198 | 2141 | 420.6 |
| B | 5 | 32 | 69182 | 159.39 | 2198 | 2141 | 420.6 |
| B | 12 | 111 | 52219 | 119.06 | 2198 | 2141 | 420.6 |
| C | 2 | 16 | 2607613 | 5270.25 | 2117 | 2130 | 494.4 |
| C | 7 | 247 | 1186991 | 2396.68 | 2117 | 2130 | 494.4 |
| C | 14 | 238 | 332143 | 667.54 | 2117 | 2130 | 494.4 |
| D | 1 | 52 | 2692846 | 5180.69 | 2143 | 2079 | 519.4 |
| D | 7 | 223 | 1095160 | 2104.57 | 2143 | 2079 | 519.4 |
| D | 12 | 218 | 820654 | 1576.05 | 2143 | 2079 | 519.4 |
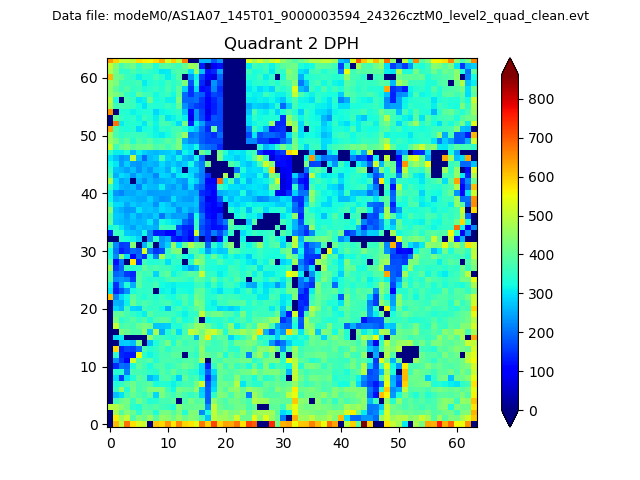
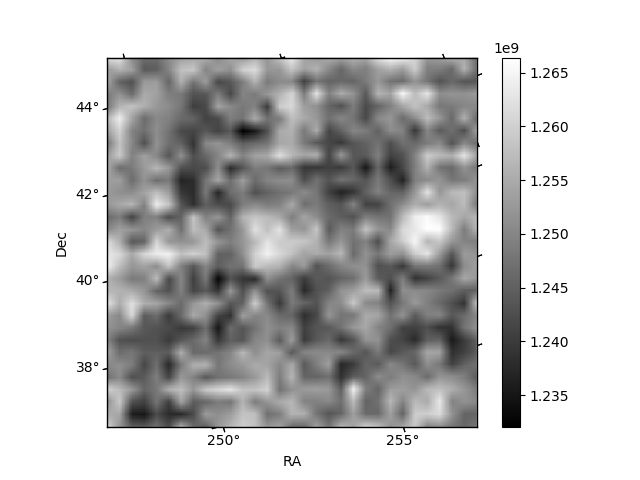
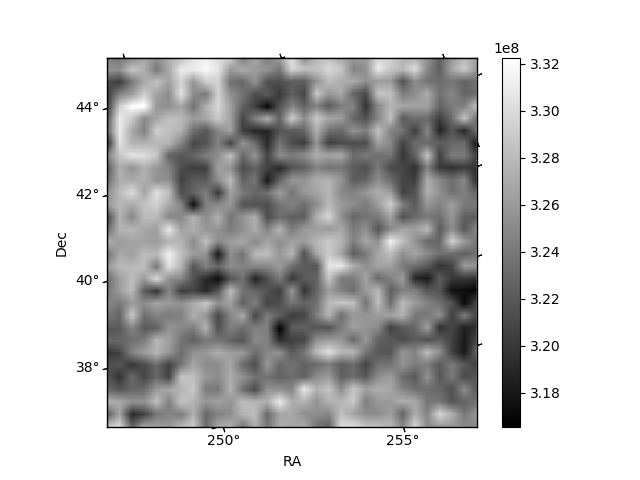
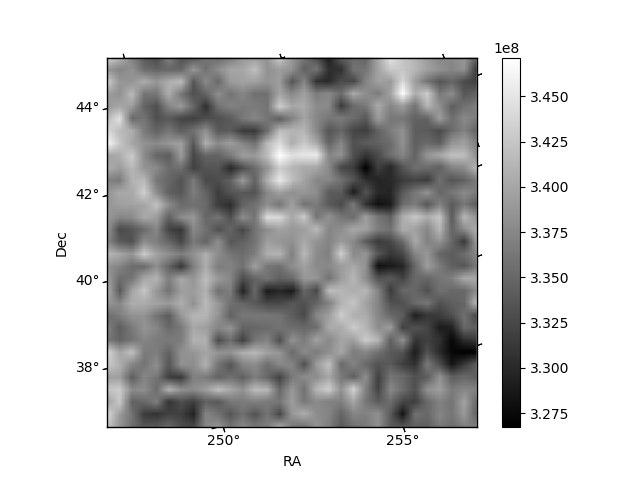
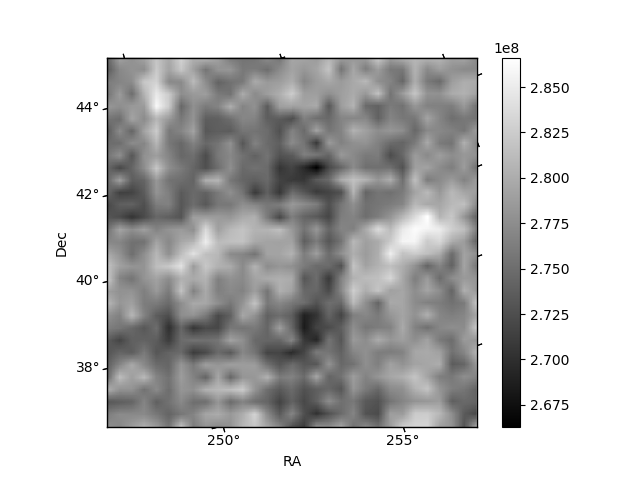
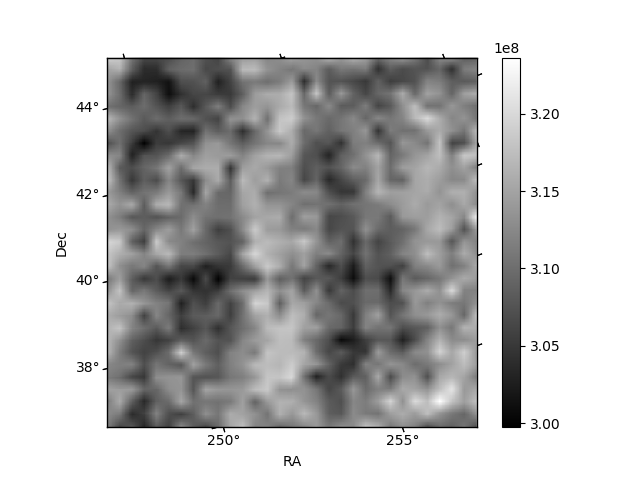
Histogram calculated using DETX and DETY for each event in the final _common_clean file
| Quadrant A | 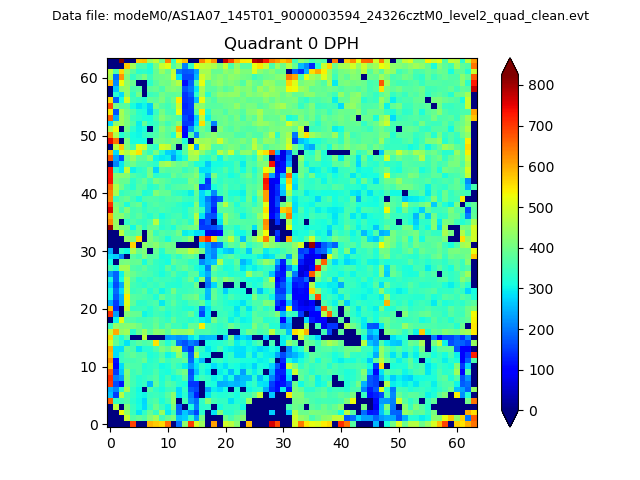 |
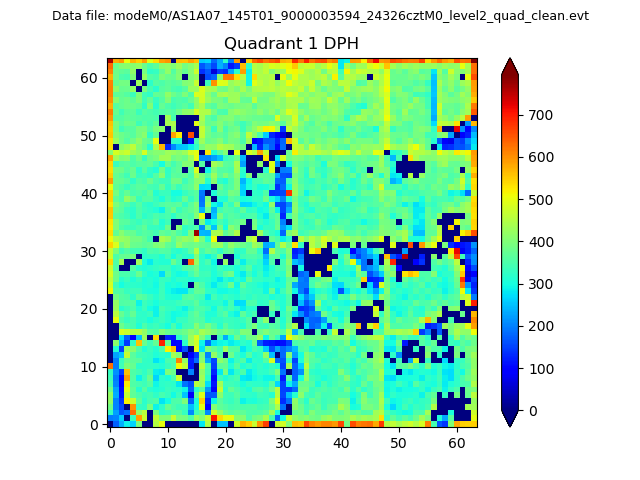 |
Quadrant B |
|---|---|---|---|
| Quadrant D | 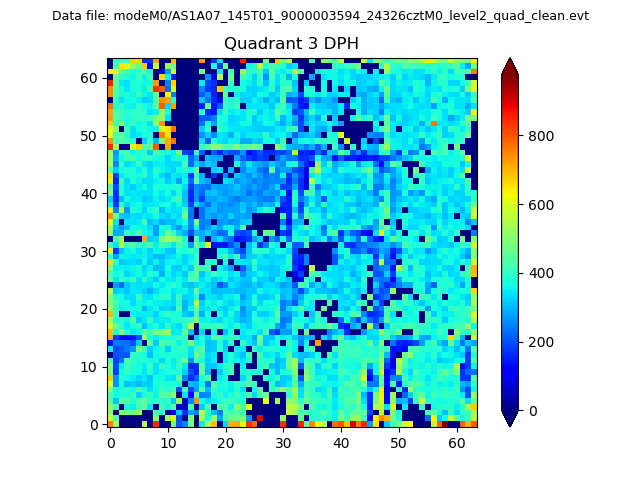 |
 |
Quadrant C |
| Plot type | Count rate plots | Images |
|---|---|---|
| Comparison with Poisson distribution Blue bars denote a histogram of data divided into 1 sec bins. Red curve is a Poisson curve with rate = median count rate of data. |
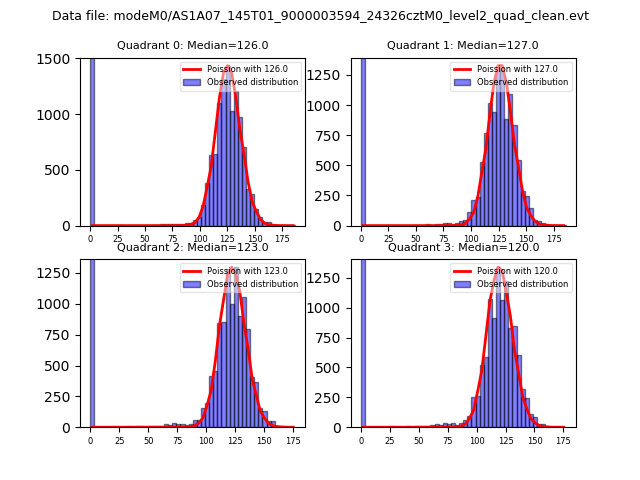 |
 |
| Quadrant-wise count rates Data is divided into 100 sec bins |
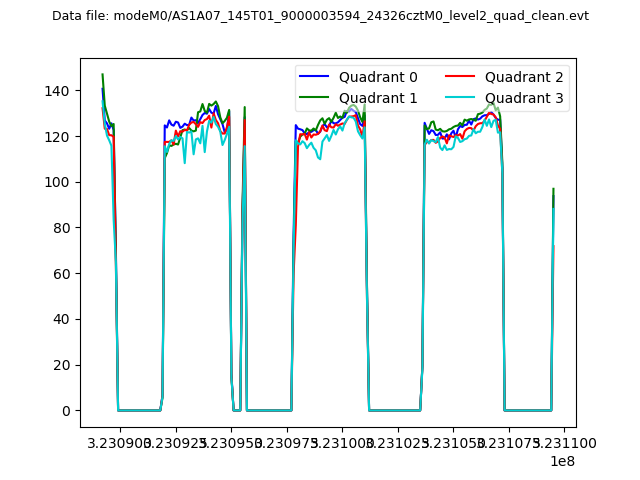 |
|
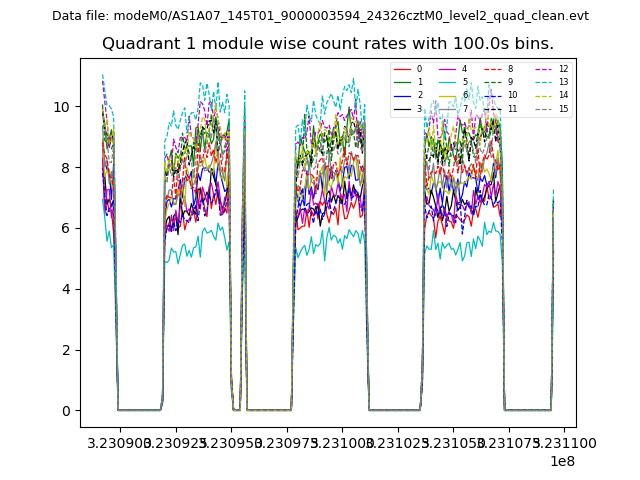
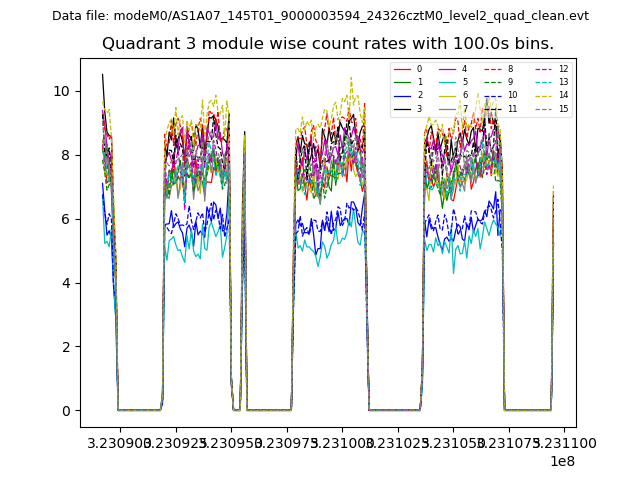
| Module-wise count rates for Quadrant A Data is divided into 100 sec bins |
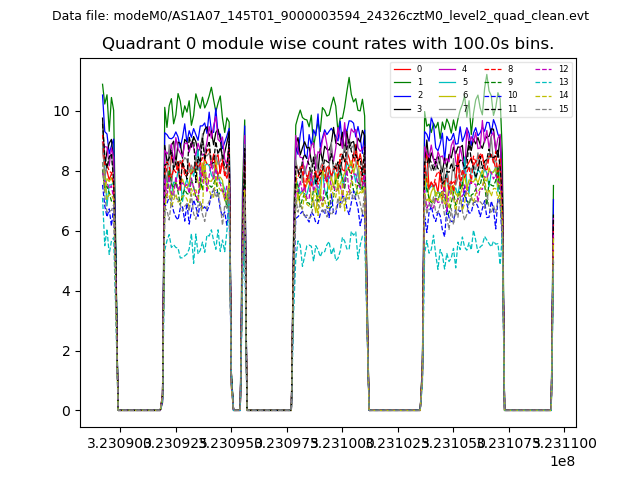 |
 |
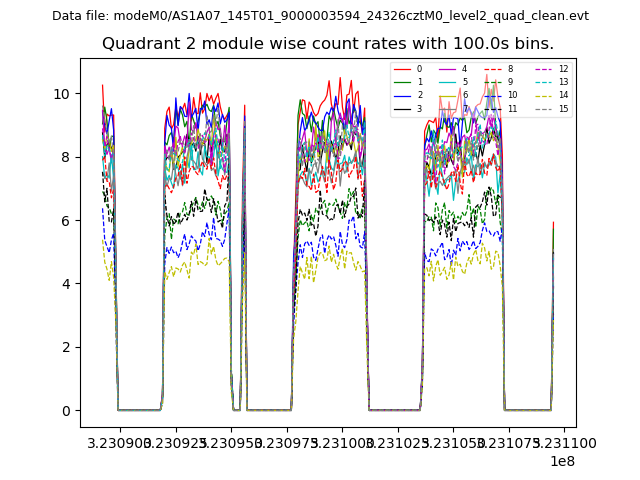
| Module-wise count rates for Quadrant B Data is divided into 100 sec bins |
 |
 |
| Module-wise count rates for Quadrant C Data is divided into 100 sec bins |
 |
 |
| Module-wise count rates for Quadrant D Data is divided into 100 sec bins |
 |
 |
| Parameter | Plot |
|---|---|
| CZT HV Monitor | 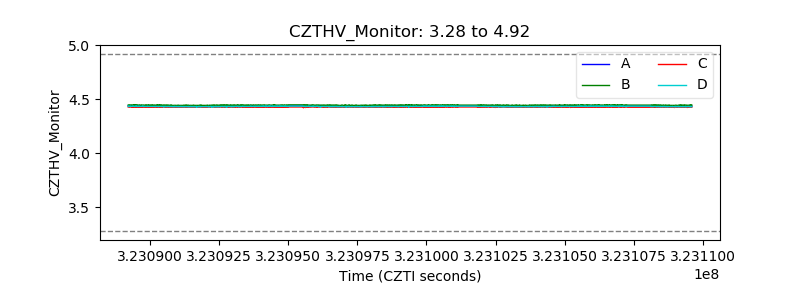 |
| D_VDD | 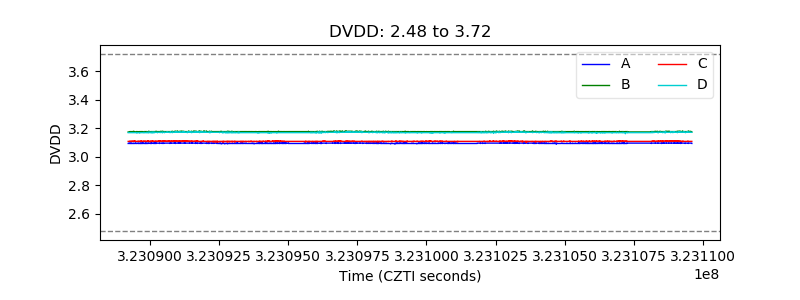 |
| Temperature 1 | 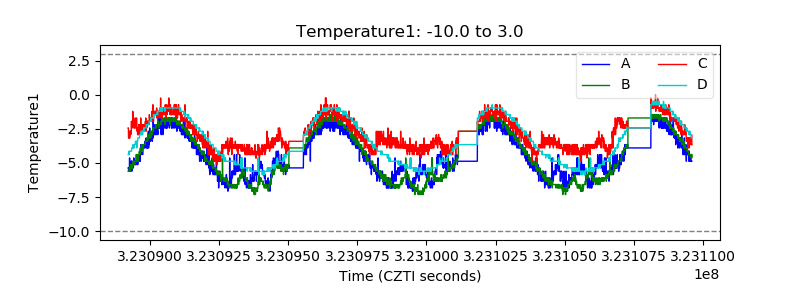 |
| Veto HV Monitor | 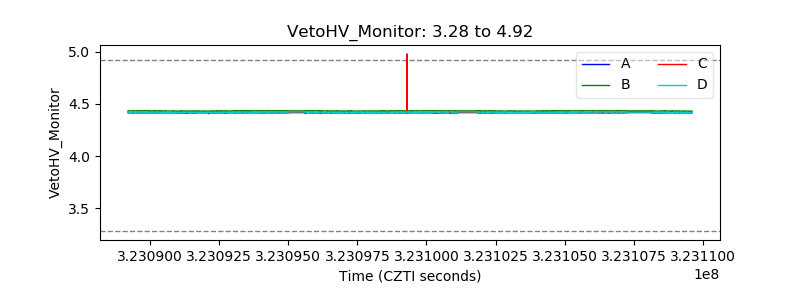 |
| Veto LLD | 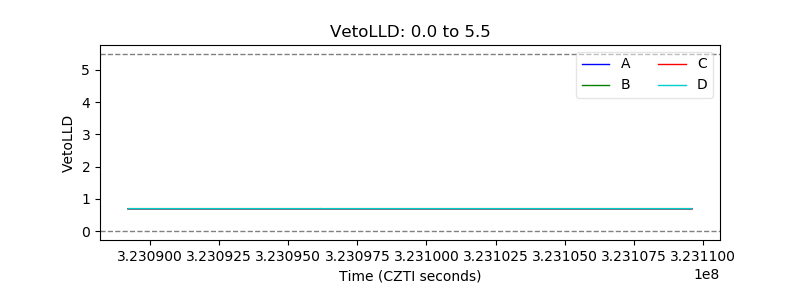 |
| Alpha Counter | 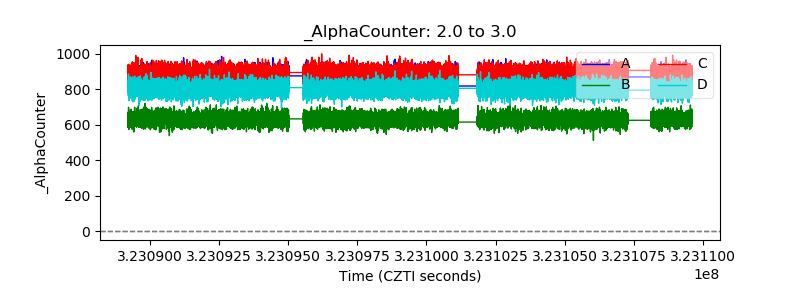 |
| _CPM_Rate | 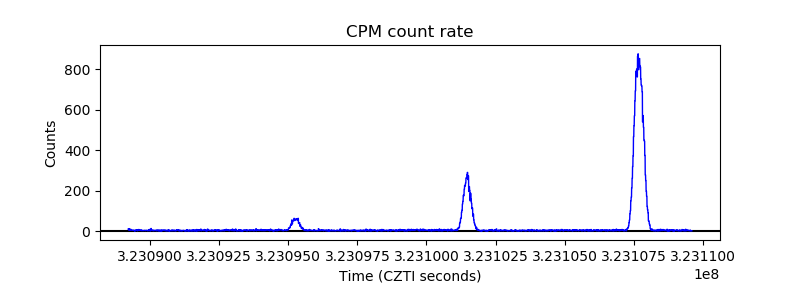 |
| CZT Counter | 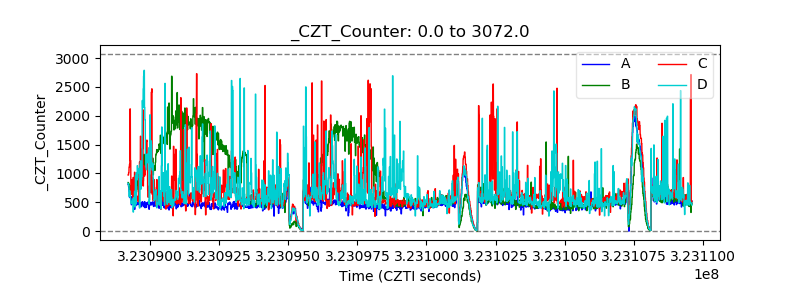 |
| +2.5 Volts monitor | 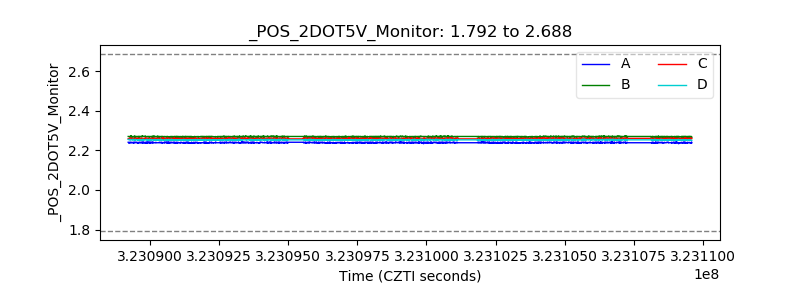 |
| +5 Volts monitor | 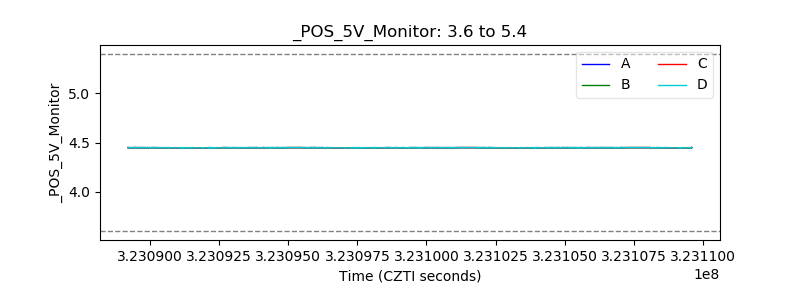 |
| _ROLL_ROT | 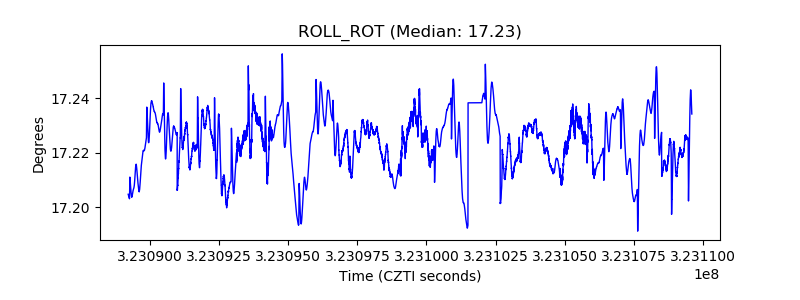 |
| _Roll_DEC | 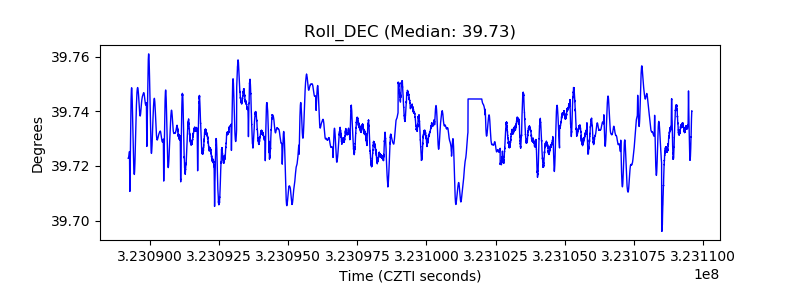 |
| _Roll_RA | 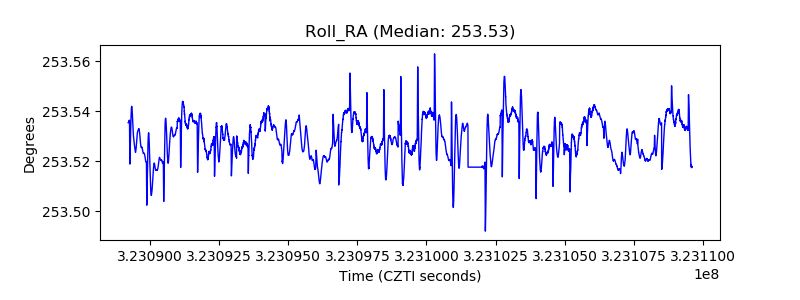 |
| Veto Counter | 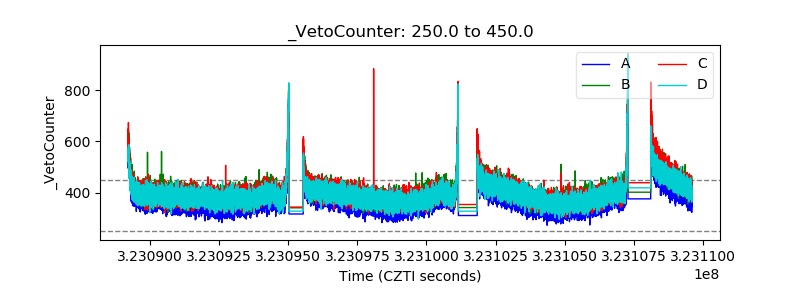 |