| Param | Original file | Final file |
|---|---|---|
| Filename | modeM0/AS1A07_145T01_9000003594_24329cztM0_level2.evt | modeM0/AS1A07_145T01_9000003594_24329cztM0_level2_quad_clean.evt |
| Size (bytes) | 583,335,360 | 91,396,800 |
| Size | 556.3 MB | 87.2 MB |
| Events in quadrant A | 3,019,129 | 596,391 |
| Events in quadrant B | 3,094,225 | 615,352 |
| Events in quadrant C | 4,979,825 | 575,612 |
| Events in quadrant D | 6,156,642 | 550,806 |
| Mode M0 | |||
|---|---|---|---|
| Quadrant | BADHDUFLAG | Total packets | Discarded packets |
| A | 0 | 13058 | 1 |
| B | 0 | 13190 | 1 |
| C | 0 | 19147 | 1 |
| D | 0 | 22459 | 1 |
| Mode M9 | |||
|---|---|---|---|
| Quadrant | BADHDUFLAG | Total packets | Discarded packets |
| A | 0 | 12 | 0 |
| B | 0 | 12 | 0 |
| C | 0 | 12 | 0 |
| D | 0 | 12 | 0 |
| Mode SS | |||
|---|---|---|---|
| Quadrant | BADHDUFLAG | Total packets | Discarded packets |
| A | 0 | 124 | 0 |
| B | 0 | 124 | 0 |
| C | 0 | 124 | 0 |
| D | 0 | 124 | 0 |
| Quadrant | Total seconds | Saturated seconds | Saturation percentage |
|---|---|---|---|
| A | 6155 | 41 | 0.666125% |
| B | 6156 | 68 | 1.104613% |
| C | 6156 | 417 | 6.773879% |
| D | 6156 | 1024 | 16.634178% |
Noise dominated data is calculated using 1-second bins in cleaned event files. If a bin has >2000 counts, and if more than 50% of those come from <1% of pixels, then it is considered to be noise-dominated and hence unusable.
| Quadrant | # 1 sec bins | Bins with >0 counts | Bins with >2000 counts | High rate bins dominated by noise | Noise dominated (total time) | Noise dominated (detector-on time) | Marked lightcurve |
|---|---|---|---|---|---|---|---|
| A | 7275 | 6155 | 0 | 0 | 0.00% | 0.00% | 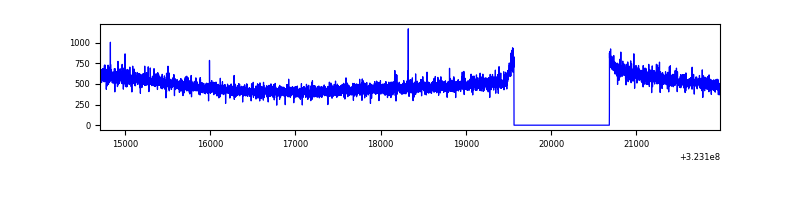 |
| B | 7276 | 6156 | 4 | 4 | 0.05% | 0.06% | 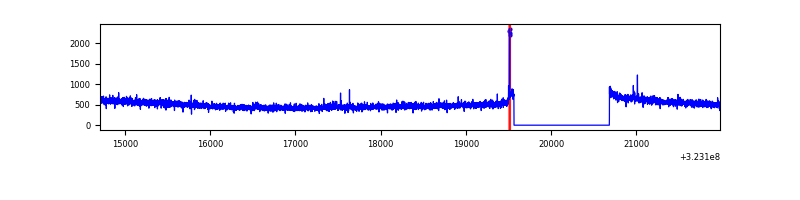 |
| C | 7276 | 6156 | 226 | 226 | 3.11% | 3.67% | 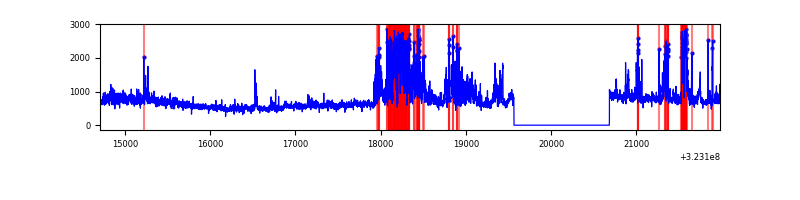 |
| D | 7276 | 6156 | 837 | 837 | 11.50% | 13.60% | 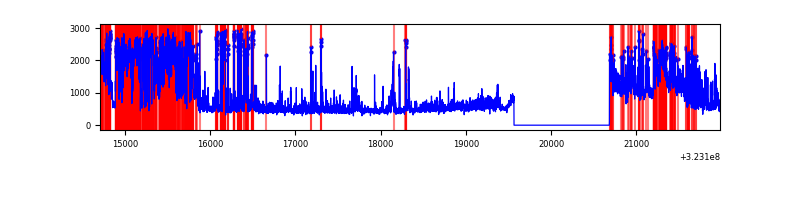 |
Top three noisy pixels from each quadrant. If the there are fewer than three noisy pixels in the level2.evt file, extra rows are filled as -1
| Pixel properties | Quadrant properties | ||||||
|---|---|---|---|---|---|---|---|
| Quadrant | DetID | PixID | Counts | Sigma | Mean | Median | Sigma |
| A | 13 | 254 | 9087 | 53.38 | 779 | 764 | 155.9 |
| A | 2 | 79 | 7255 | 41.63 | 779 | 764 | 155.9 |
| A | 3 | 137 | 6963 | 39.76 | 779 | 764 | 155.9 |
| B | 12 | 111 | 17674 | 113.61 | 784 | 765 | 148.8 |
| B | 11 | 111 | 15626 | 99.85 | 784 | 765 | 148.8 |
| B | 5 | 172 | 14896 | 94.95 | 784 | 765 | 148.8 |
| C | 2 | 16 | 1071070 | 6124.4 | 753 | 759 | 174.8 |
| C | 7 | 247 | 848692 | 4851.94 | 753 | 759 | 174.8 |
| C | 14 | 238 | 118369 | 672.97 | 753 | 759 | 174.8 |
| D | 1 | 52 | 1901880 | 10963.15 | 717 | 698 | 173.4 |
| D | 12 | 218 | 687720 | 3961.71 | 717 | 698 | 173.4 |
| D | 1 | 239 | 315510 | 1815.36 | 717 | 698 | 173.4 |
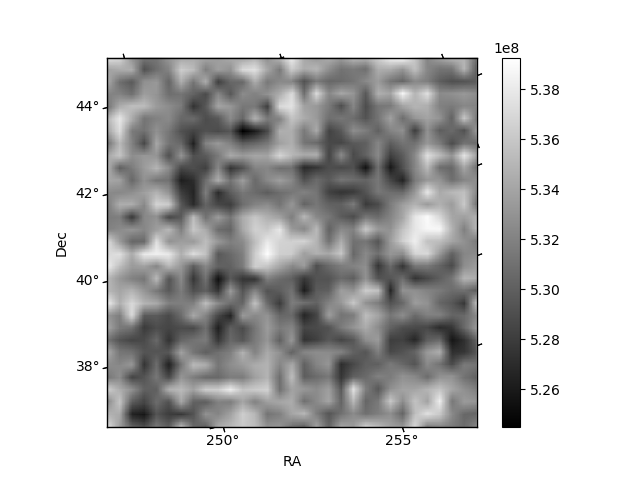
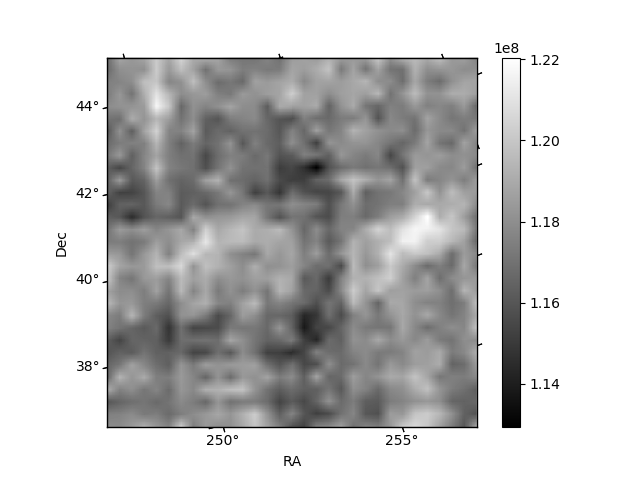
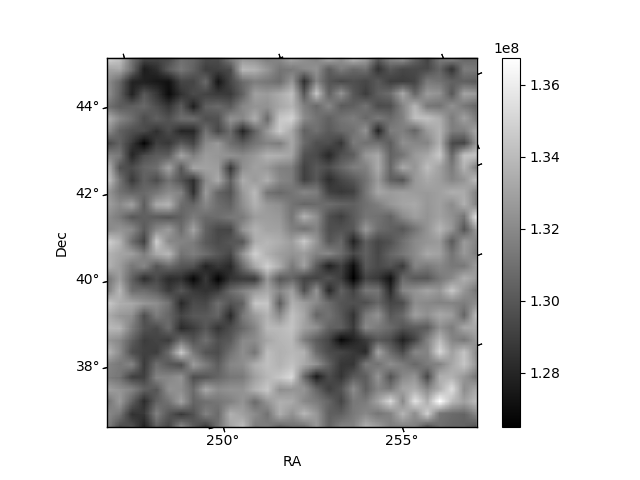
Histogram calculated using DETX and DETY for each event in the final _common_clean file
| Quadrant A | 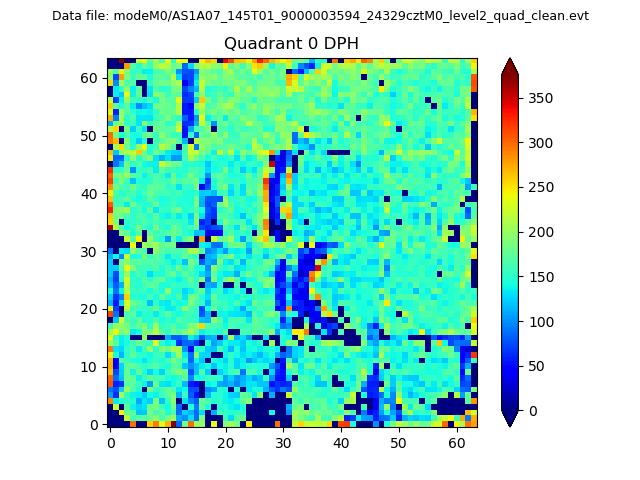 |
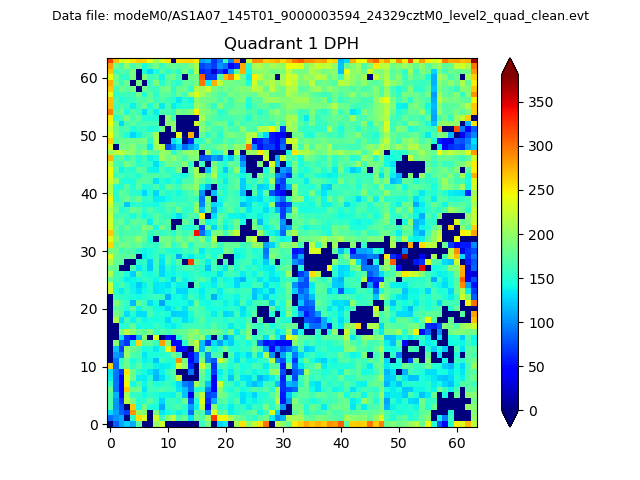 |
Quadrant B |
|---|---|---|---|
| Quadrant D | 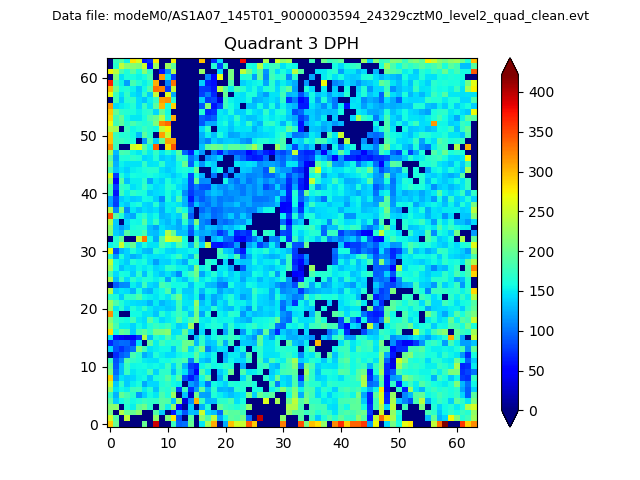 |
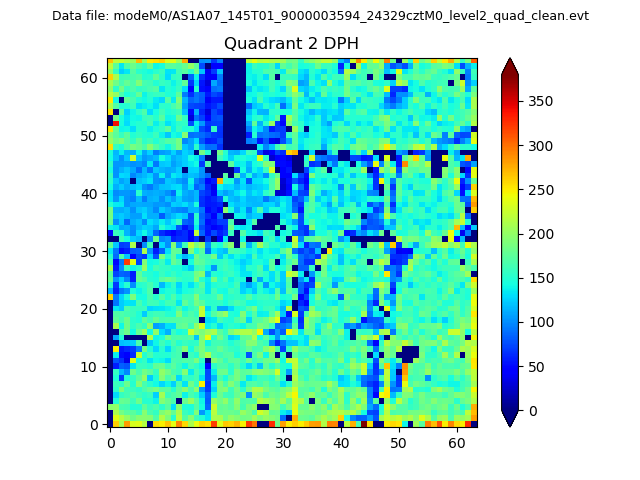 |
Quadrant C |
| Plot type | Count rate plots | Images |
|---|---|---|
| Comparison with Poisson distribution Blue bars denote a histogram of data divided into 1 sec bins. Red curve is a Poisson curve with rate = median count rate of data. |
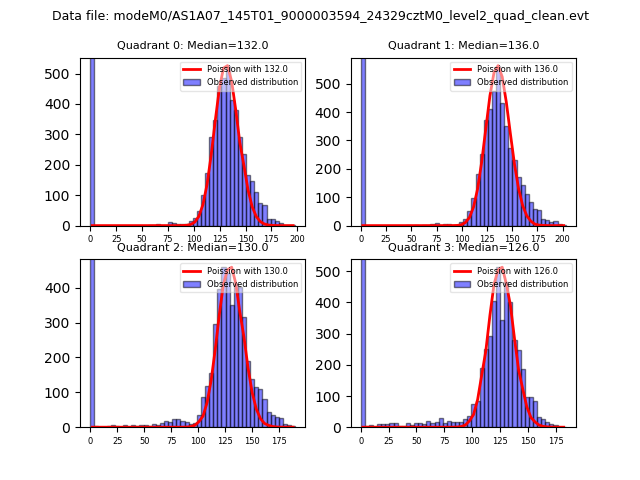 |
 |
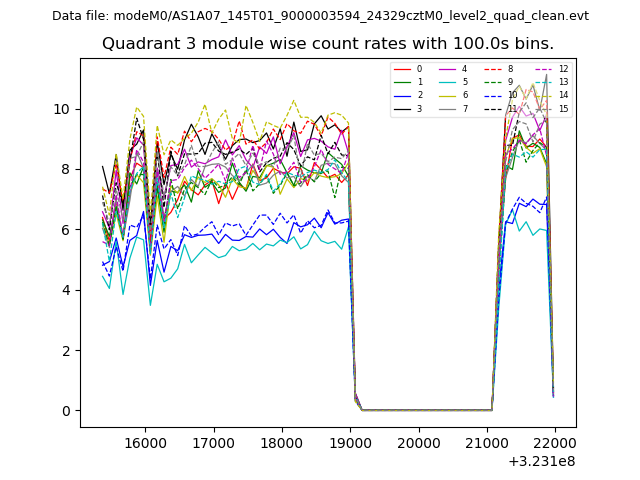
| Quadrant-wise count rates Data is divided into 100 sec bins |
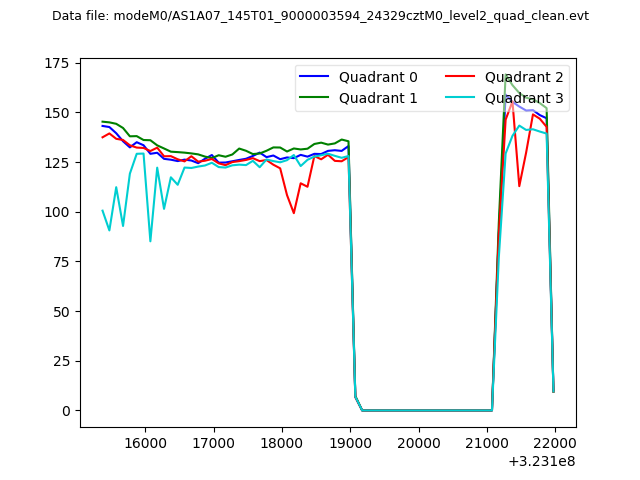 |
|
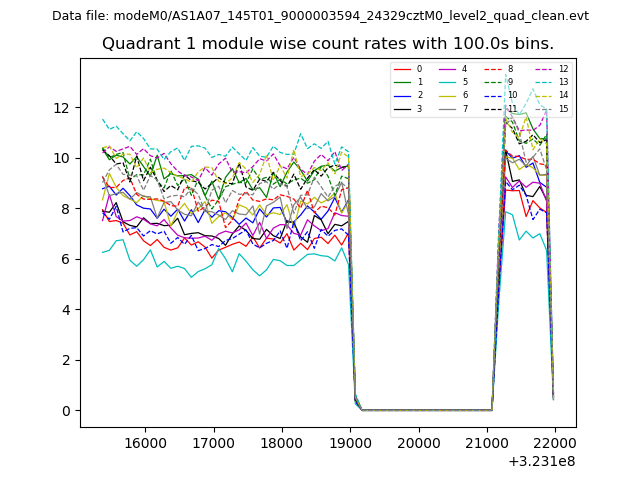
| Module-wise count rates for Quadrant A Data is divided into 100 sec bins |
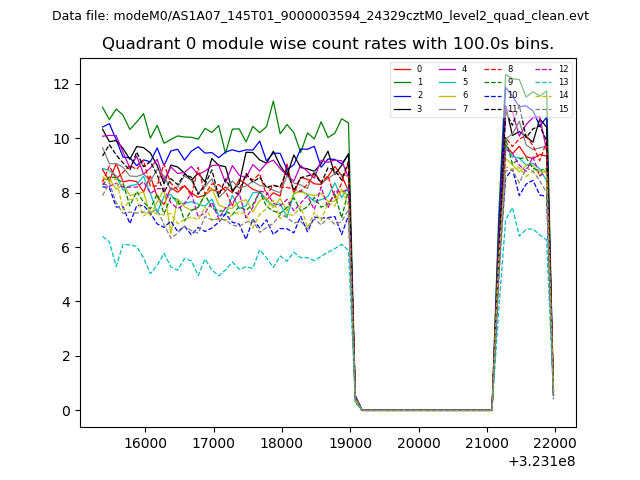 |
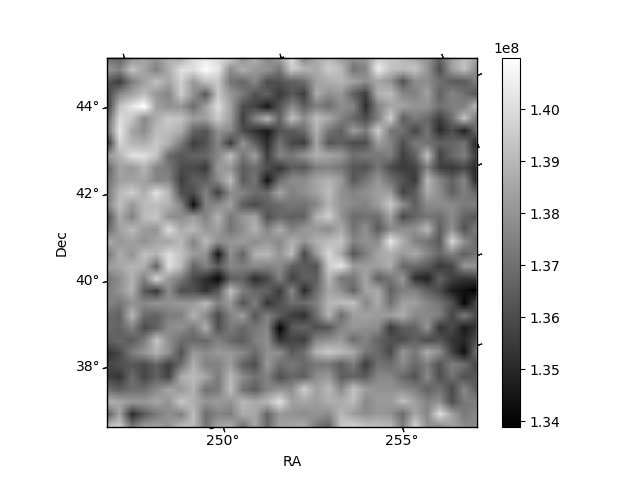 |
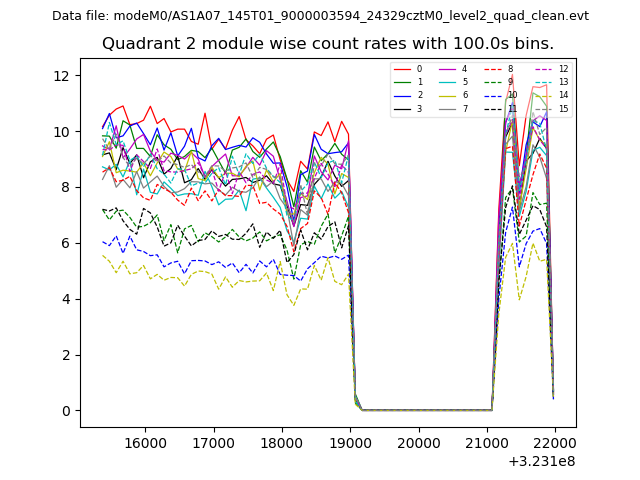
| Module-wise count rates for Quadrant B Data is divided into 100 sec bins |
 |
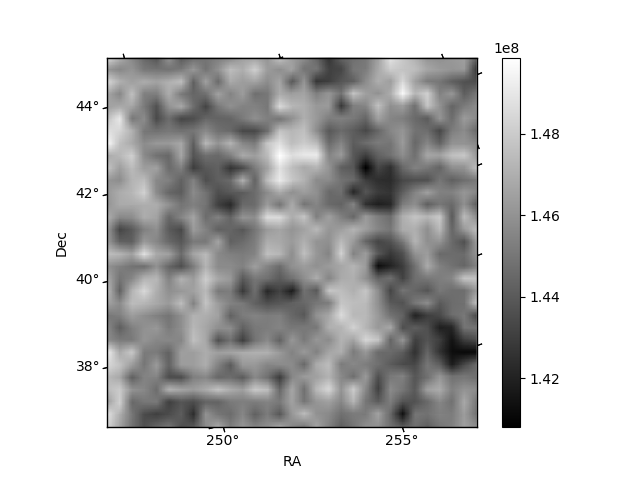 |
| Module-wise count rates for Quadrant C Data is divided into 100 sec bins |
 |
 |
| Module-wise count rates for Quadrant D Data is divided into 100 sec bins |
 |
 |
| Parameter | Plot |
|---|---|
| CZT HV Monitor | 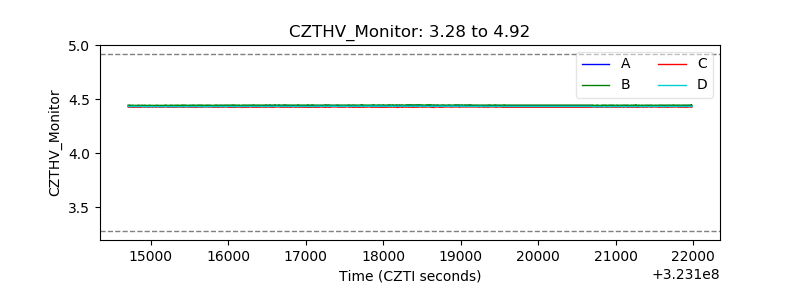 |
| D_VDD | 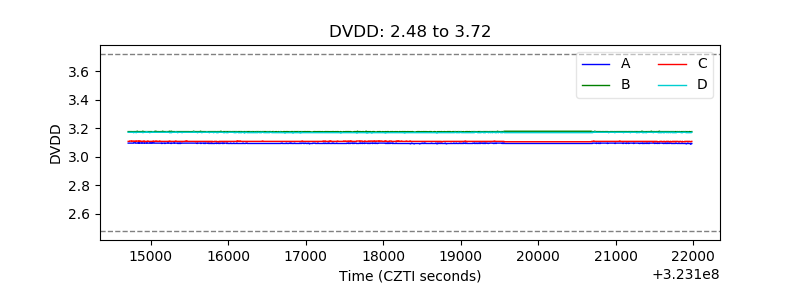 |
| Temperature 1 | 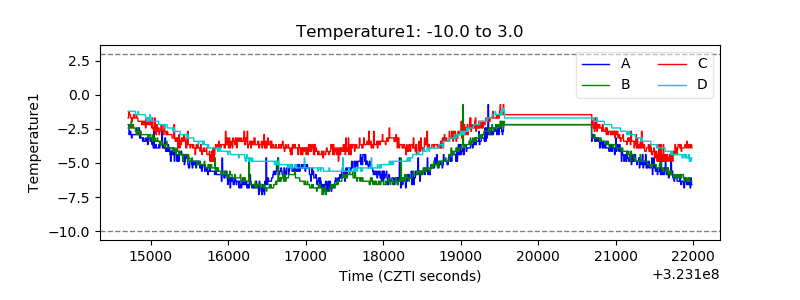 |
| Veto HV Monitor | 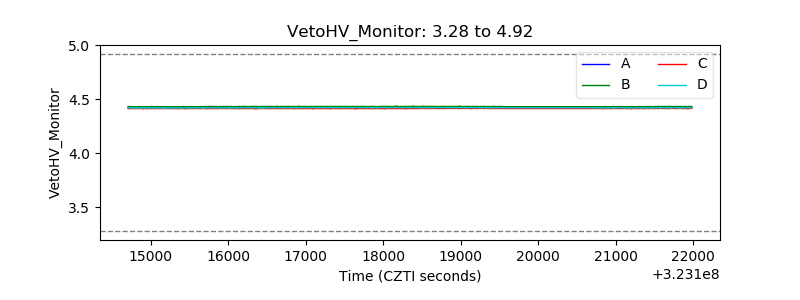 |
| Veto LLD | 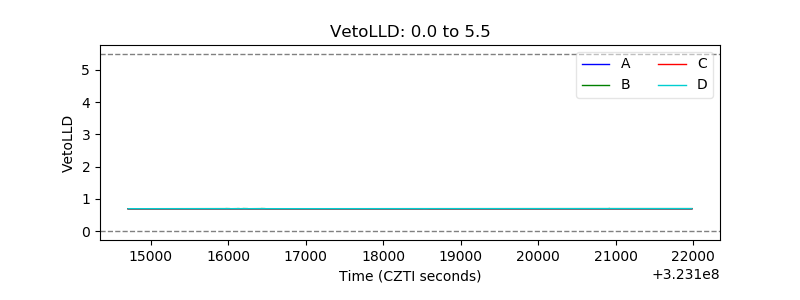 |
| Alpha Counter | 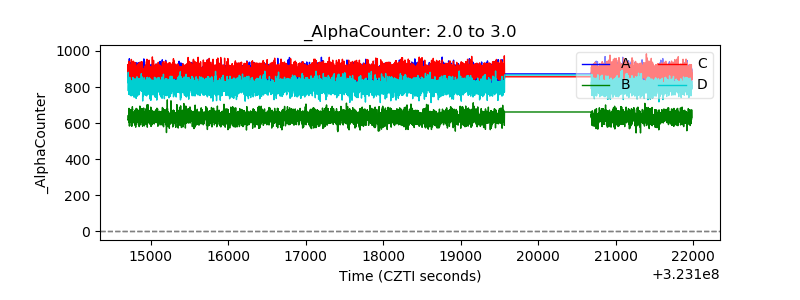 |
| _CPM_Rate | 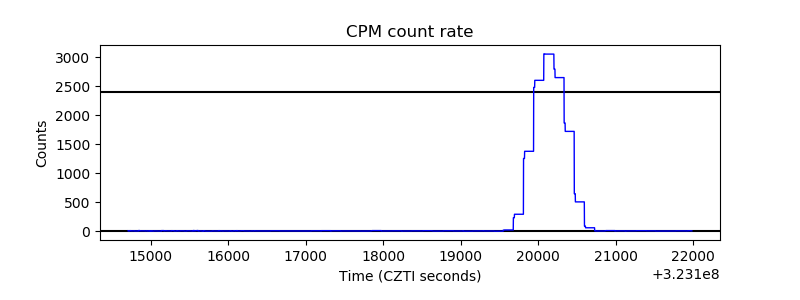 |
| CZT Counter | 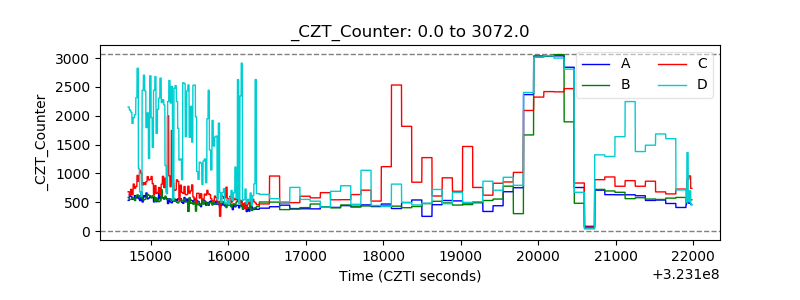 |
| +2.5 Volts monitor |  |
| +5 Volts monitor |  |
| _ROLL_ROT | 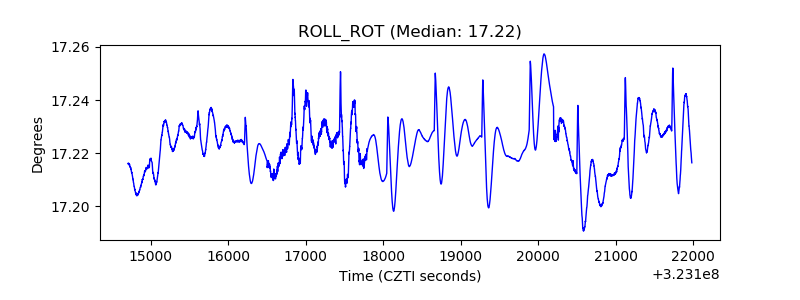 |
| _Roll_DEC | 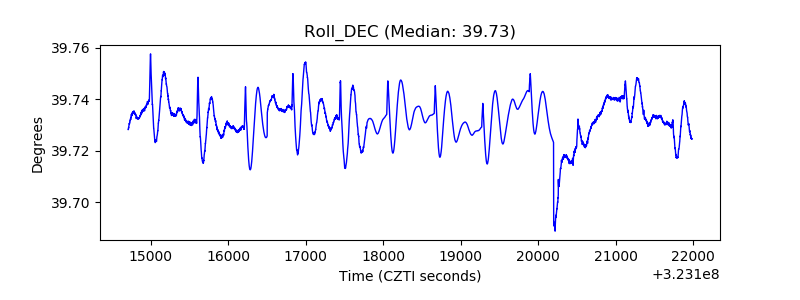 |
| _Roll_RA | 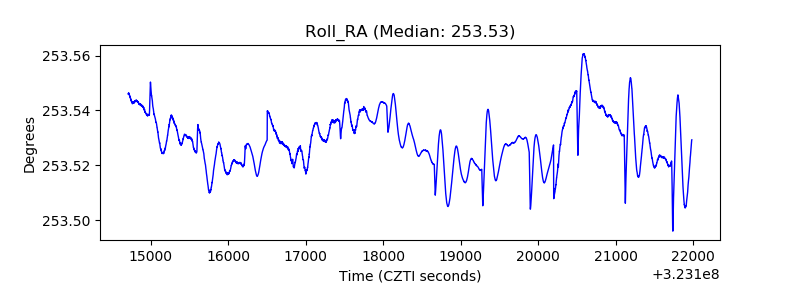 |
| Veto Counter |  |