| Param | Original file | Final file |
|---|---|---|
| Filename | modeM0/AS1A07_145T01_9000003594_24332cztM0_level2.evt | modeM0/AS1A07_145T01_9000003594_24332cztM0_level2_quad_clean.evt |
| Size (bytes) | 465,120,000 | 106,240,320 |
| Size | 443.6 MB | 101.3 MB |
| Events in quadrant A | 3,084,599 | 700,198 |
| Events in quadrant B | 3,186,008 | 733,621 |
| Events in quadrant C | 3,622,575 | 697,211 |
| Events in quadrant D | 3,782,092 | 663,722 |
| Mode M0 | |||
|---|---|---|---|
| Quadrant | BADHDUFLAG | Total packets | Discarded packets |
| A | 0 | 12918 | 2 |
| B | 0 | 13194 | 2 |
| C | 0 | 14827 | 2 |
| D | 0 | 15230 | 2 |
| Mode M9 | |||
|---|---|---|---|
| Quadrant | BADHDUFLAG | Total packets | Discarded packets |
| A | 0 | 16 | 0 |
| B | 0 | 17 | 0 |
| C | 0 | 17 | 0 |
| D | 0 | 17 | 0 |
| Mode SS | |||
|---|---|---|---|
| Quadrant | BADHDUFLAG | Total packets | Discarded packets |
| A | 0 | 124 | 0 |
| B | 0 | 124 | 0 |
| C | 0 | 124 | 0 |
| D | 0 | 124 | 0 |
| Quadrant | Total seconds | Saturated seconds | Saturation percentage |
|---|---|---|---|
| A | 6052 | 46 | 0.760079% |
| B | 6052 | 69 | 1.140119% |
| C | 6052 | 93 | 1.536682% |
| D | 6052 | 59 | 0.974884% |
Noise dominated data is calculated using 1-second bins in cleaned event files. If a bin has >2000 counts, and if more than 50% of those come from <1% of pixels, then it is considered to be noise-dominated and hence unusable.
| Quadrant | # 1 sec bins | Bins with >0 counts | Bins with >2000 counts | High rate bins dominated by noise | Noise dominated (total time) | Noise dominated (detector-on time) | Marked lightcurve |
|---|---|---|---|---|---|---|---|
| A | 7387 | 6052 | 0 | 0 | 0.00% | 0.00% | 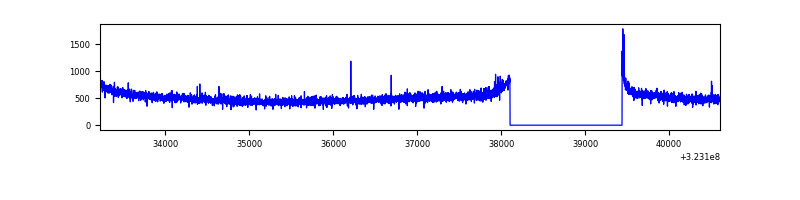 |
| B | 7387 | 6052 | 3 | 3 | 0.04% | 0.05% | 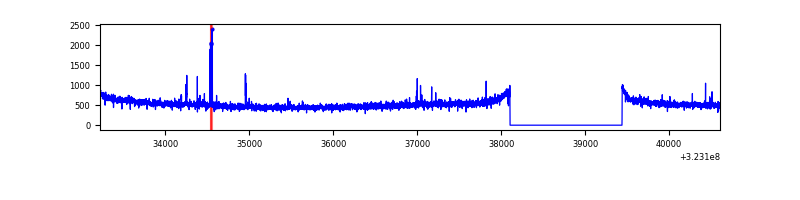 |
| C | 7387 | 6052 | 0 | 0 | 0.00% | 0.00% | 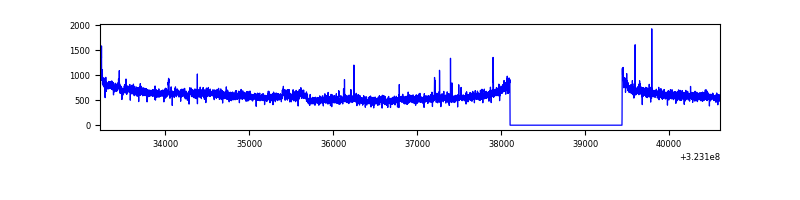 |
| D | 7387 | 6052 | 27 | 27 | 0.37% | 0.45% | 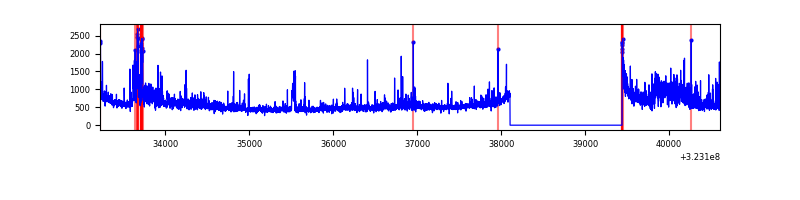 |
Top three noisy pixels from each quadrant. If the there are fewer than three noisy pixels in the level2.evt file, extra rows are filled as -1
| Pixel properties | Quadrant properties | ||||||
|---|---|---|---|---|---|---|---|
| Quadrant | DetID | PixID | Counts | Sigma | Mean | Median | Sigma |
| A | 3 | 1 | 20738 | 127.07 | 795 | 781 | 157.1 |
| A | 13 | 254 | 8465 | 48.93 | 795 | 781 | 157.1 |
| A | 3 | 137 | 6725 | 37.85 | 795 | 781 | 157.1 |
| B | 5 | 172 | 21133 | 136.25 | 803 | 785 | 149.3 |
| B | 12 | 111 | 17535 | 112.16 | 803 | 785 | 149.3 |
| B | 0 | 230 | 16090 | 102.48 | 803 | 785 | 149.3 |
| C | 7 | 247 | 411128 | 2299.74 | 776 | 783 | 178.4 |
| C | 14 | 238 | 126532 | 704.75 | 776 | 783 | 178.4 |
| C | 2 | 16 | 39070 | 214.58 | 776 | 783 | 178.4 |
| D | 7 | 223 | 552316 | 2962.62 | 772 | 750 | 186.2 |
| D | 1 | 52 | 179653 | 960.94 | 772 | 750 | 186.2 |
| D | 7 | 238 | 60310 | 319.91 | 772 | 750 | 186.2 |
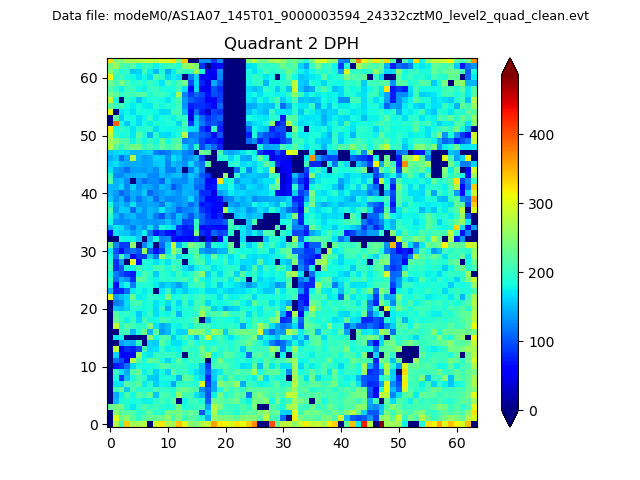
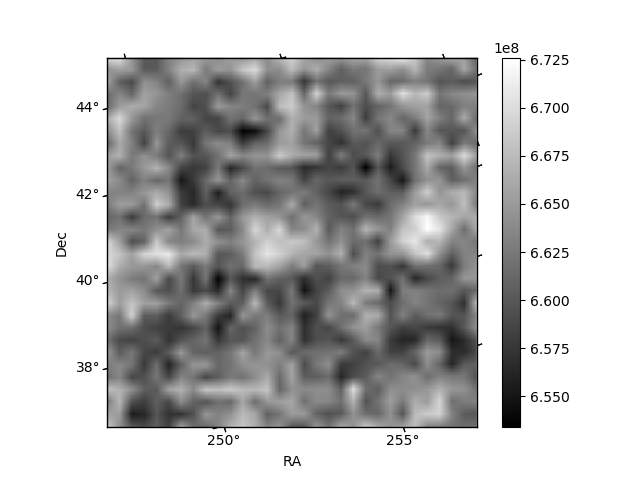
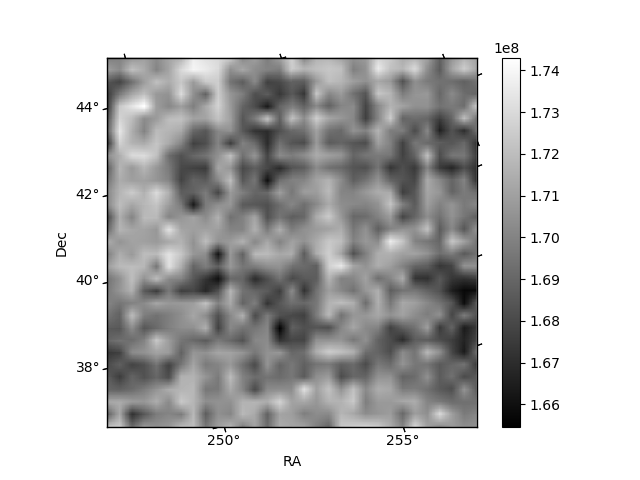
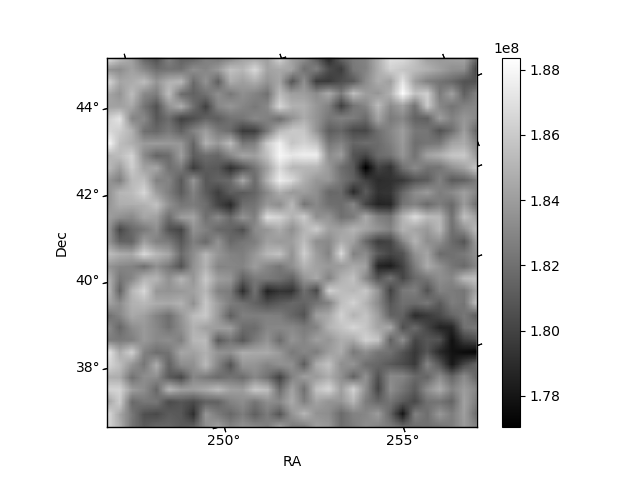
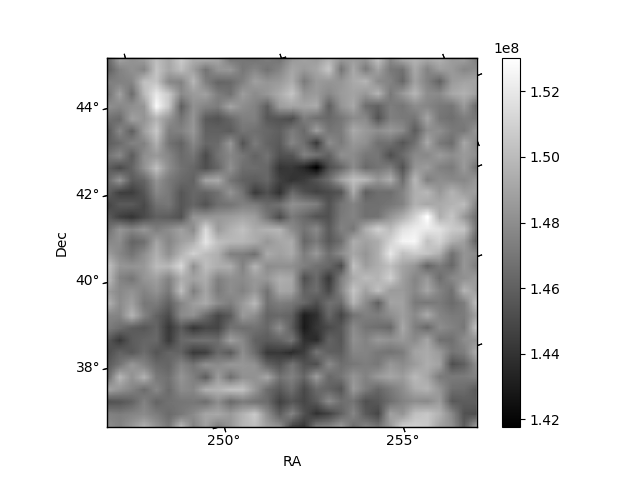
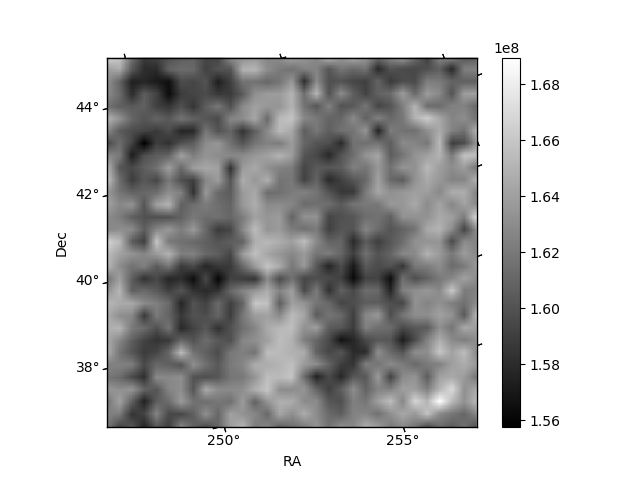
Histogram calculated using DETX and DETY for each event in the final _common_clean file
| Quadrant A | 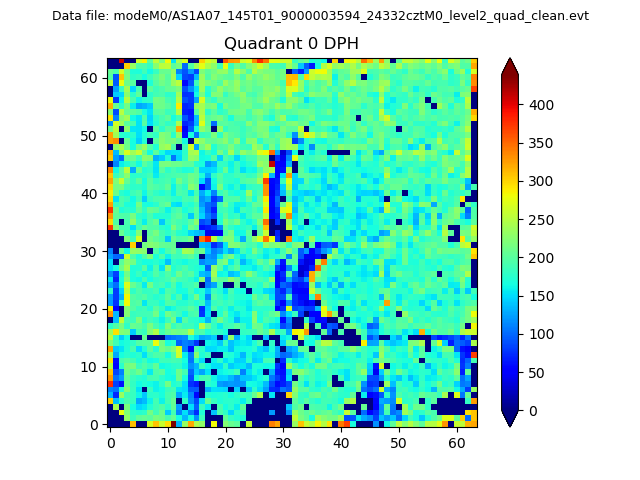 |
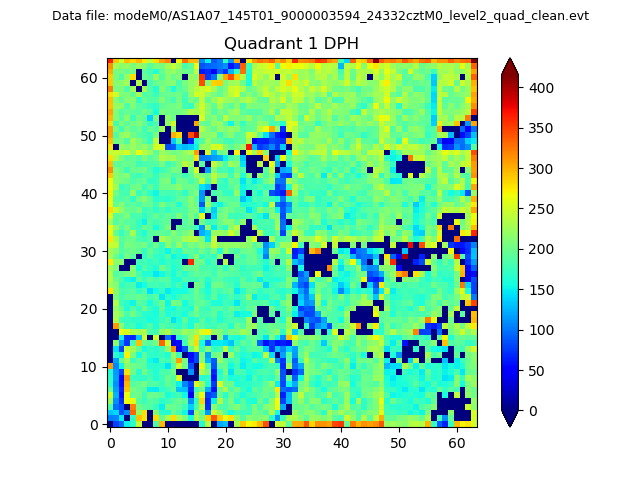 |
Quadrant B |
|---|---|---|---|
| Quadrant D | 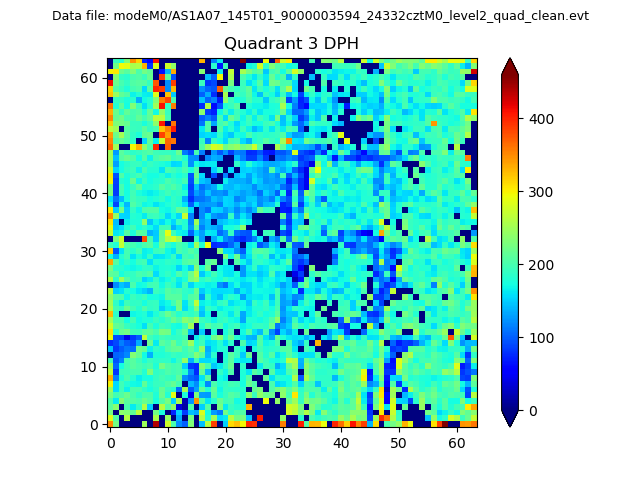 |
 |
Quadrant C |
| Plot type | Count rate plots | Images |
|---|---|---|
| Comparison with Poisson distribution Blue bars denote a histogram of data divided into 1 sec bins. Red curve is a Poisson curve with rate = median count rate of data. |
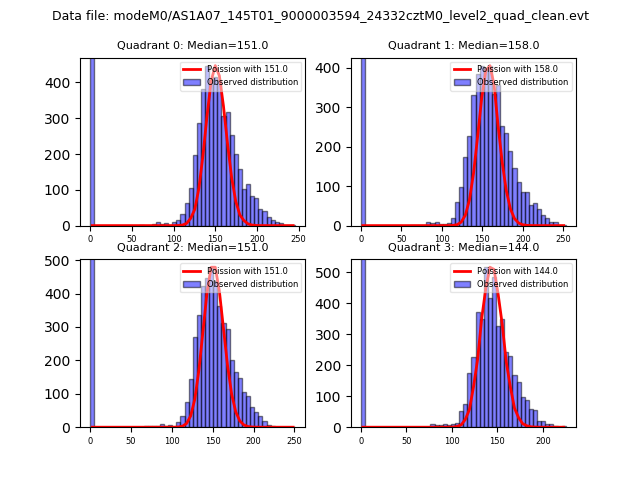 |
 |
| Quadrant-wise count rates Data is divided into 100 sec bins |
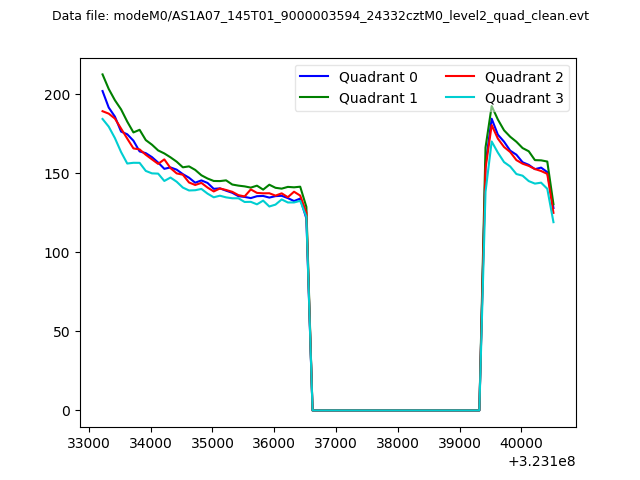 |
|
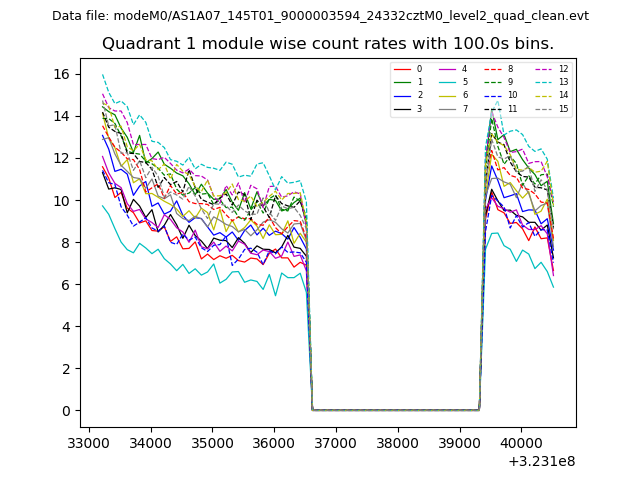
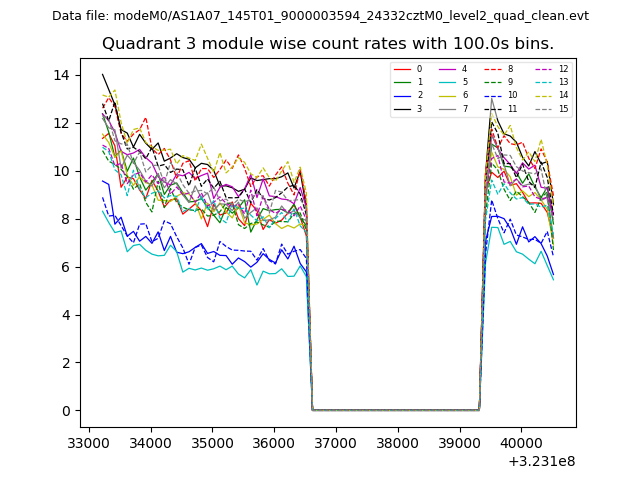
| Module-wise count rates for Quadrant A Data is divided into 100 sec bins |
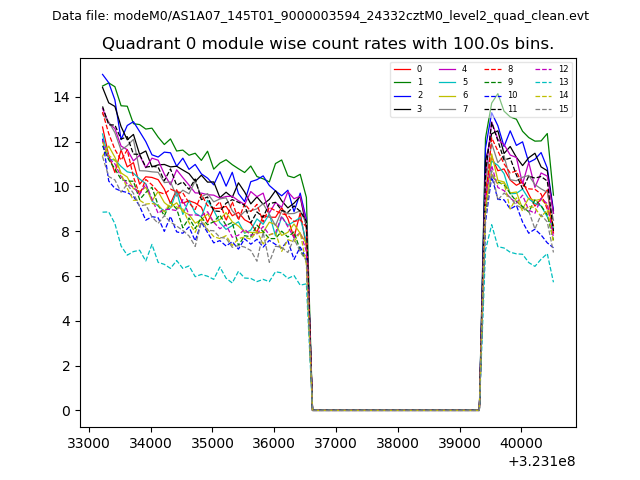 |
 |
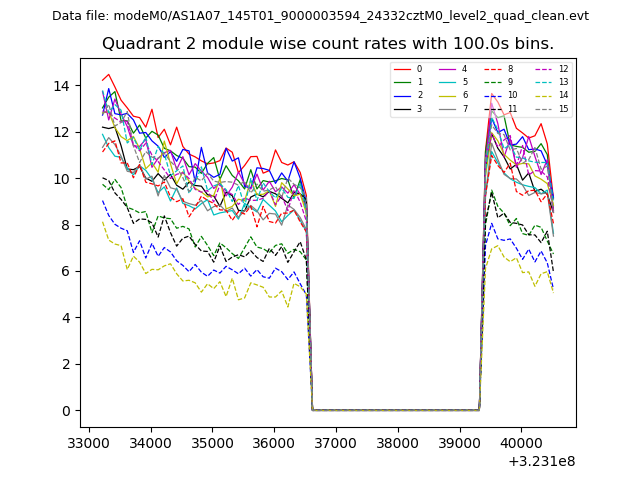
| Module-wise count rates for Quadrant B Data is divided into 100 sec bins |
 |
 |
| Module-wise count rates for Quadrant C Data is divided into 100 sec bins |
 |
 |
| Module-wise count rates for Quadrant D Data is divided into 100 sec bins |
 |
 |
| Parameter | Plot |
|---|---|
| CZT HV Monitor | 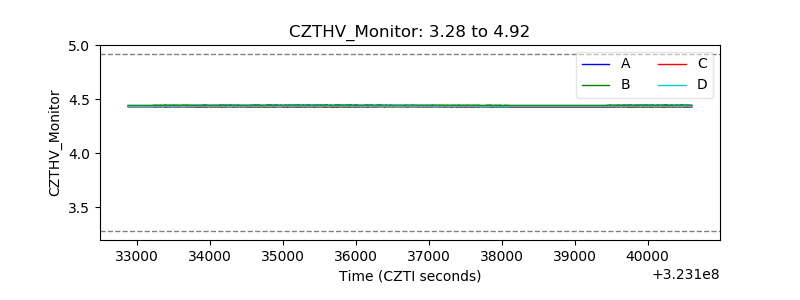 |
| D_VDD | 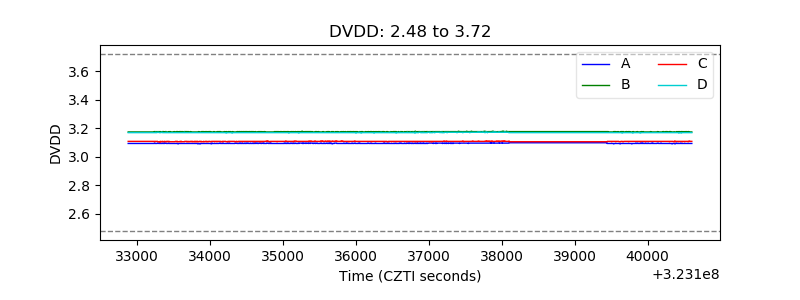 |
| Temperature 1 | 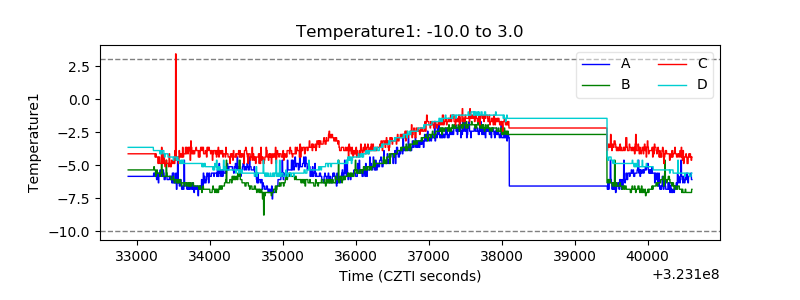 |
| Veto HV Monitor |  |
| Veto LLD | 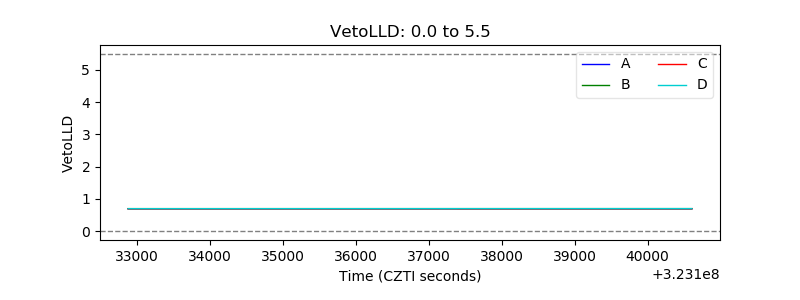 |
| Alpha Counter | 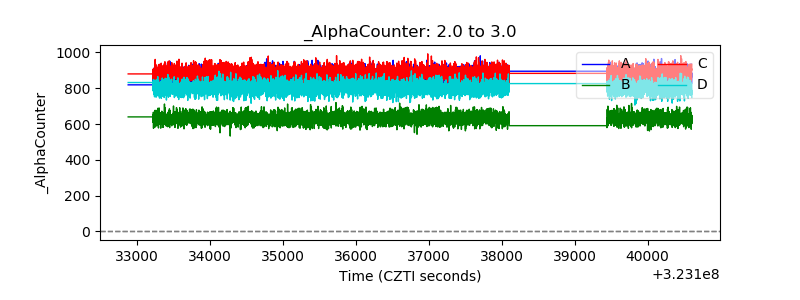 |
| _CPM_Rate | 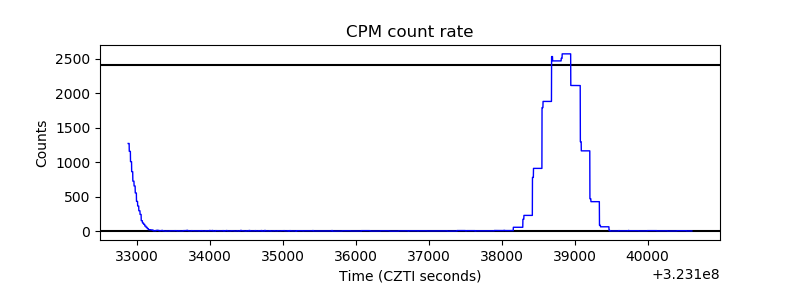 |
| CZT Counter | 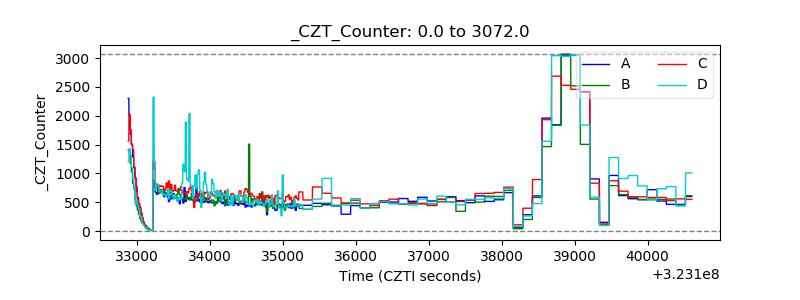 |
| +2.5 Volts monitor |  |
| +5 Volts monitor |  |
| _ROLL_ROT | 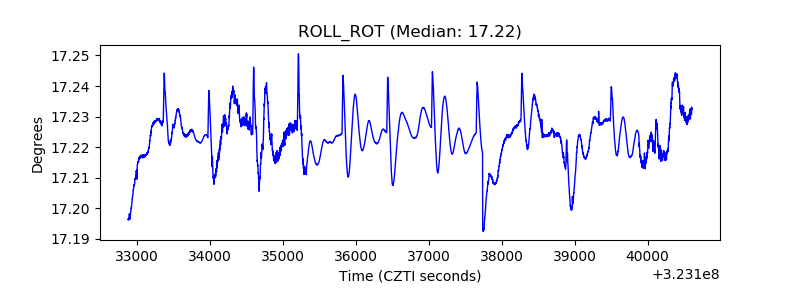 |
| _Roll_DEC | 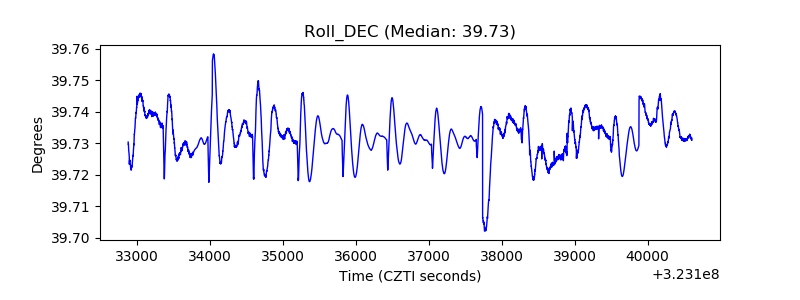 |
| _Roll_RA | 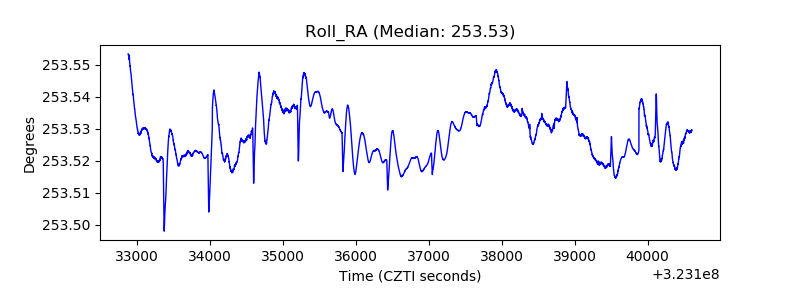 |
| Veto Counter | 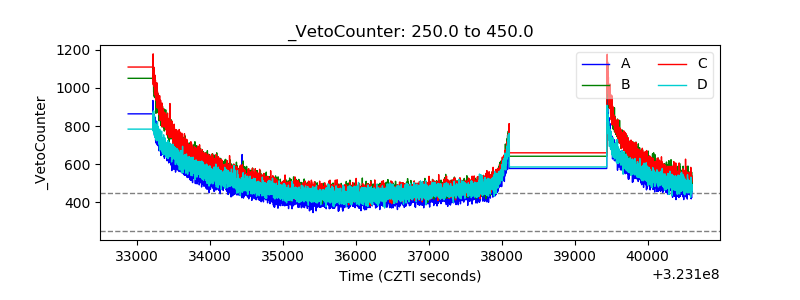 |