| Param | Original file | Final file |
|---|---|---|
| Filename | modeM0/AS1A07_145T01_9000003594_24333cztM0_level2.evt | modeM0/AS1A07_145T01_9000003594_24333cztM0_level2_quad_clean.evt |
| Size (bytes) | 529,963,200 | 104,832,000 |
| Size | 505.4 MB | 100.0 MB |
| Events in quadrant A | 3,268,881 | 683,673 |
| Events in quadrant B | 3,328,676 | 712,719 |
| Events in quadrant C | 4,925,132 | 672,066 |
| Events in quadrant D | 4,080,091 | 646,402 |
| Mode M0 | |||
|---|---|---|---|
| Quadrant | BADHDUFLAG | Total packets | Discarded packets |
| A | 0 | 13883 | 2 |
| B | 0 | 13938 | 2 |
| C | 0 | 19408 | 2 |
| D | 0 | 16479 | 2 |
| Mode M9 | |||
|---|---|---|---|
| Quadrant | BADHDUFLAG | Total packets | Discarded packets |
| A | 0 | 21 | 0 |
| B | 0 | 22 | 0 |
| C | 0 | 22 | 0 |
| D | 0 | 22 | 0 |
| Mode SS | |||
|---|---|---|---|
| Quadrant | BADHDUFLAG | Total packets | Discarded packets |
| A | 0 | 132 | 0 |
| B | 0 | 132 | 0 |
| C | 0 | 132 | 0 |
| D | 0 | 132 | 0 |
| Quadrant | Total seconds | Saturated seconds | Saturation percentage |
|---|---|---|---|
| A | 6606 | 26 | 0.393582% |
| B | 6606 | 47 | 0.711474% |
| C | 6606 | 203 | 3.072964% |
| D | 6606 | 80 | 1.211020% |
Noise dominated data is calculated using 1-second bins in cleaned event files. If a bin has >2000 counts, and if more than 50% of those come from <1% of pixels, then it is considered to be noise-dominated and hence unusable.
| Quadrant | # 1 sec bins | Bins with >0 counts | Bins with >2000 counts | High rate bins dominated by noise | Noise dominated (total time) | Noise dominated (detector-on time) | Marked lightcurve |
|---|---|---|---|---|---|---|---|
| A | 7916 | 6607 | 0 | 0 | 0.00% | 0.00% | 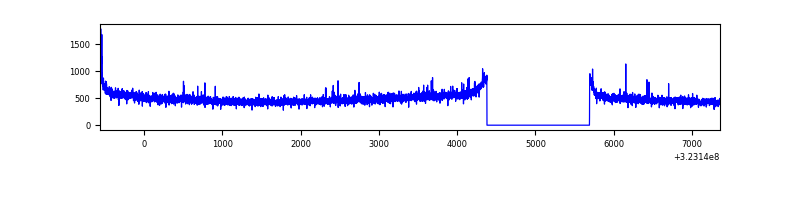 |
| B | 7916 | 6607 | 0 | 0 | 0.00% | 0.00% | 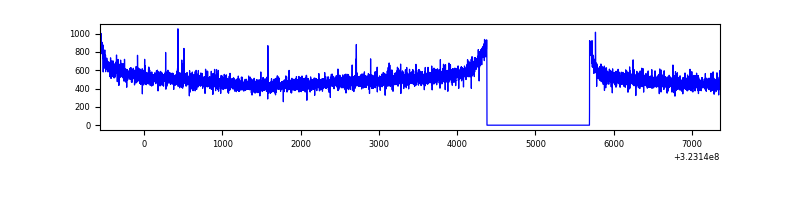 |
| C | 7916 | 6606 | 16 | 16 | 0.20% | 0.24% | 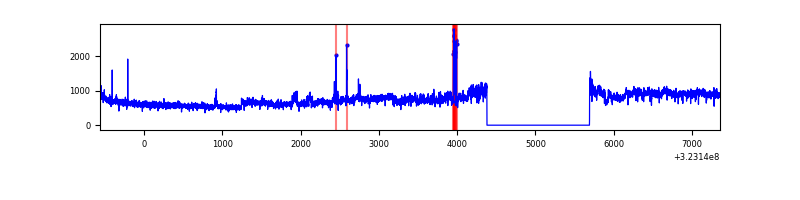 |
| D | 7916 | 6606 | 27 | 27 | 0.34% | 0.41% | 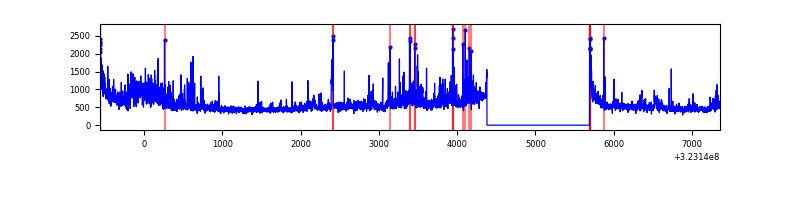 |
Top three noisy pixels from each quadrant. If the there are fewer than three noisy pixels in the level2.evt file, extra rows are filled as -1
| Pixel properties | Quadrant properties | ||||||
|---|---|---|---|---|---|---|---|
| Quadrant | DetID | PixID | Counts | Sigma | Mean | Median | Sigma |
| A | 3 | 1 | 28324 | 165.35 | 841 | 827 | 166.3 |
| A | 13 | 254 | 9959 | 54.91 | 841 | 827 | 166.3 |
| A | 0 | 226 | 7202 | 38.34 | 841 | 827 | 166.3 |
| B | 12 | 111 | 18909 | 113.24 | 849 | 829 | 159.7 |
| B | 11 | 111 | 16598 | 98.77 | 849 | 829 | 159.7 |
| B | 14 | 111 | 15217 | 90.12 | 849 | 829 | 159.7 |
| C | 7 | 247 | 1496111 | 8006.74 | 809 | 817 | 186.8 |
| C | 14 | 238 | 131136 | 697.81 | 809 | 817 | 186.8 |
| C | 2 | 16 | 123054 | 654.53 | 809 | 817 | 186.8 |
| D | 7 | 223 | 460693 | 2361.83 | 809 | 787 | 194.7 |
| D | 1 | 52 | 177485 | 907.43 | 809 | 787 | 194.7 |
| D | 9 | 35 | 129073 | 658.81 | 809 | 787 | 194.7 |
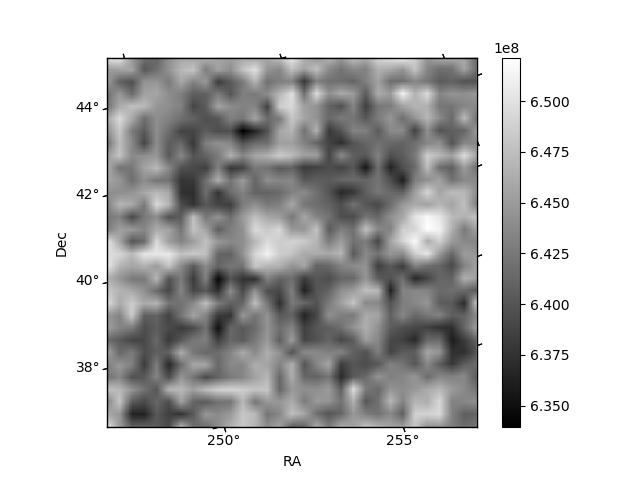
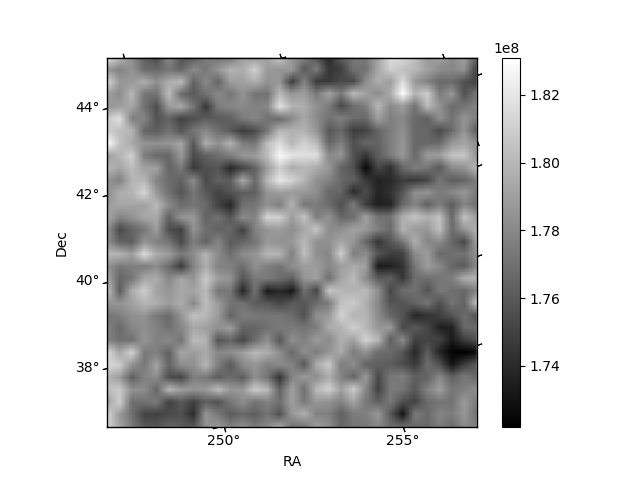
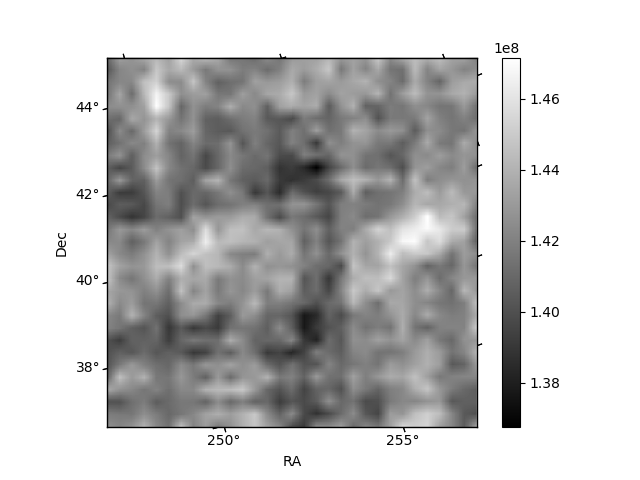
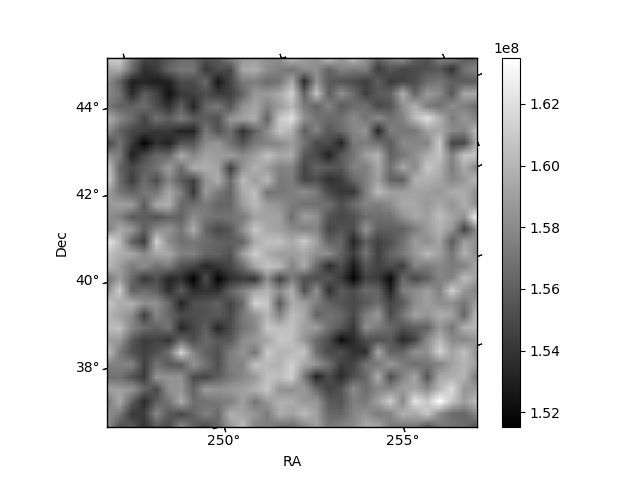
Histogram calculated using DETX and DETY for each event in the final _common_clean file
| Quadrant A | 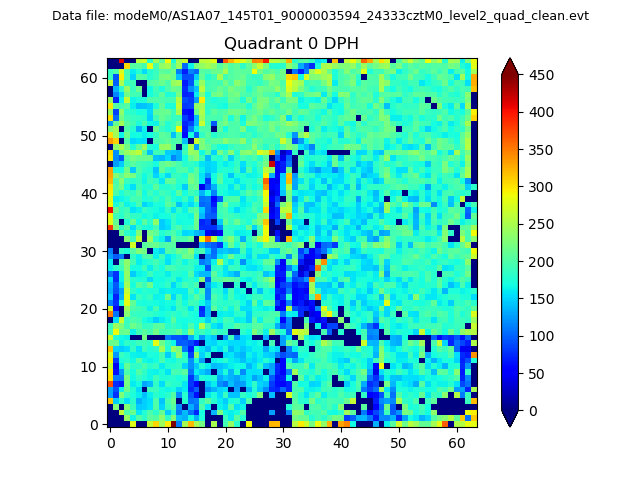 |
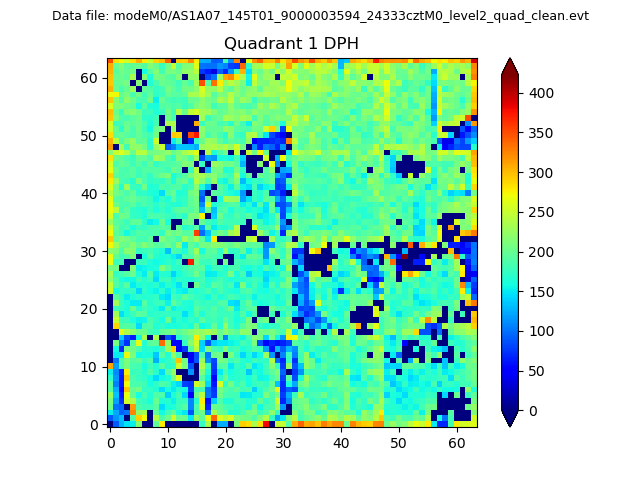 |
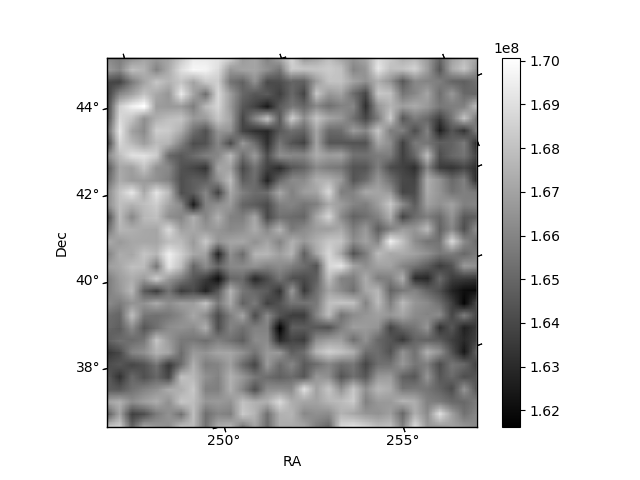
Quadrant B |
|---|---|---|---|
| Quadrant D | 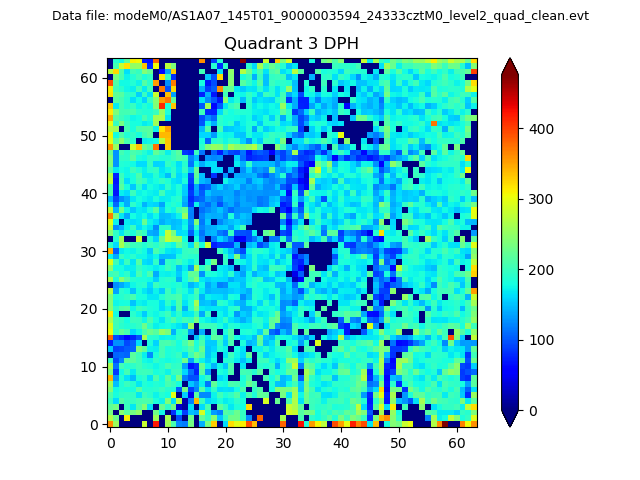 |
 |
Quadrant C |
| Plot type | Count rate plots | Images |
|---|---|---|
| Comparison with Poisson distribution Blue bars denote a histogram of data divided into 1 sec bins. Red curve is a Poisson curve with rate = median count rate of data. |
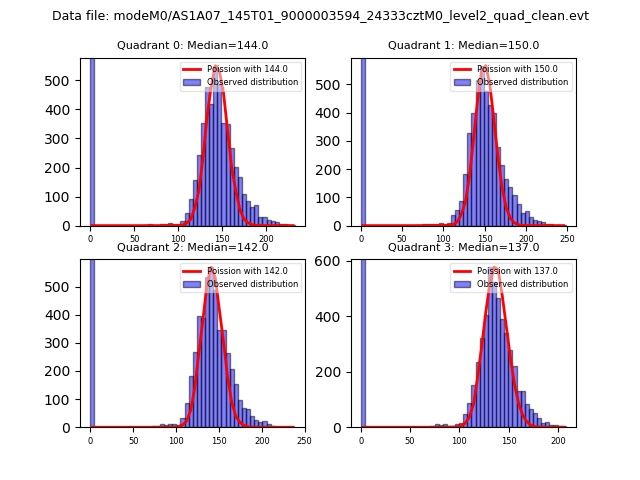 |
 |
| Quadrant-wise count rates Data is divided into 100 sec bins |
 |
|
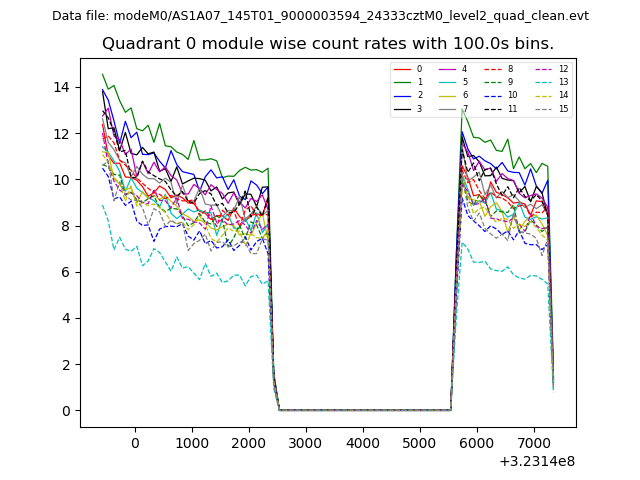
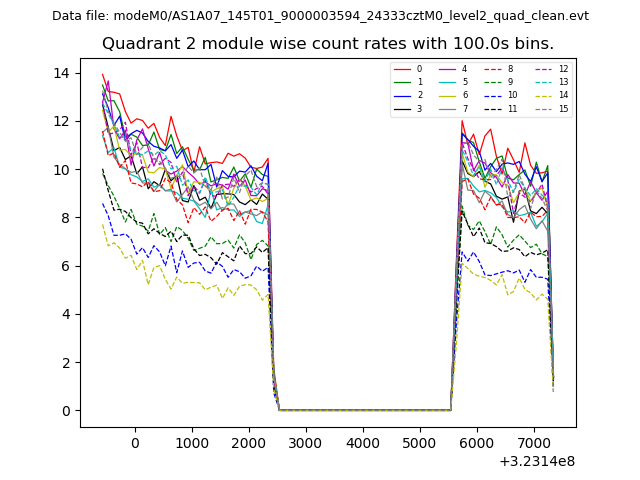
| Module-wise count rates for Quadrant A Data is divided into 100 sec bins |
 |
 |
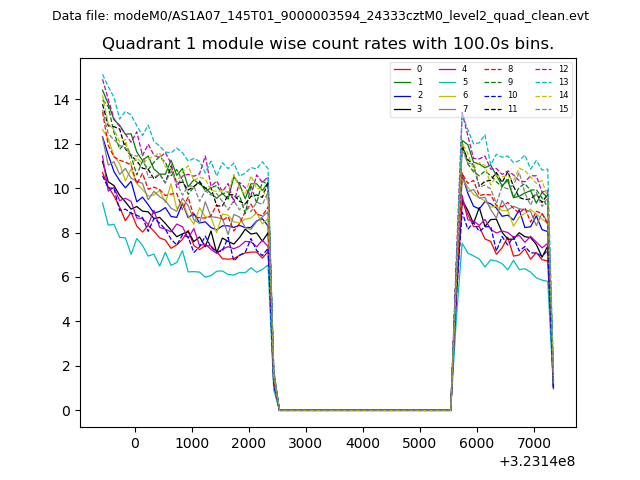
| Module-wise count rates for Quadrant B Data is divided into 100 sec bins |
 |
 |
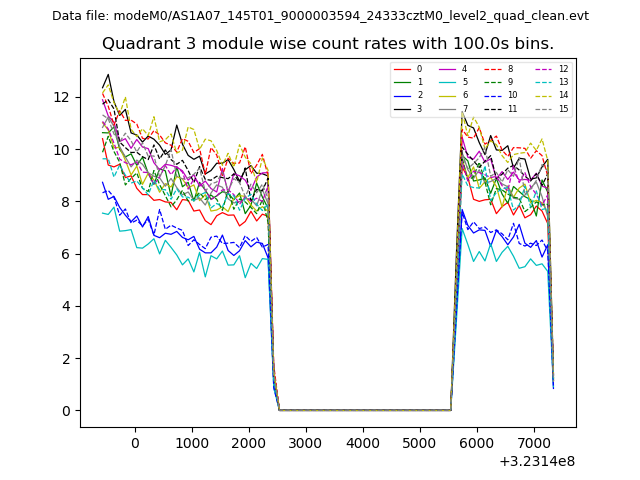
| Module-wise count rates for Quadrant C Data is divided into 100 sec bins |
 |
 |
| Module-wise count rates for Quadrant D Data is divided into 100 sec bins |
 |
 |
| Parameter | Plot |
|---|---|
| CZT HV Monitor | 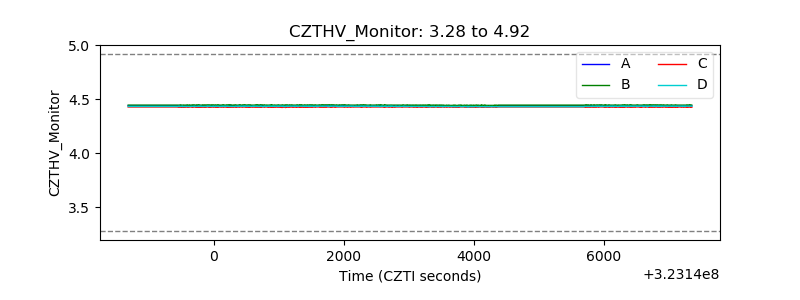 |
| D_VDD | 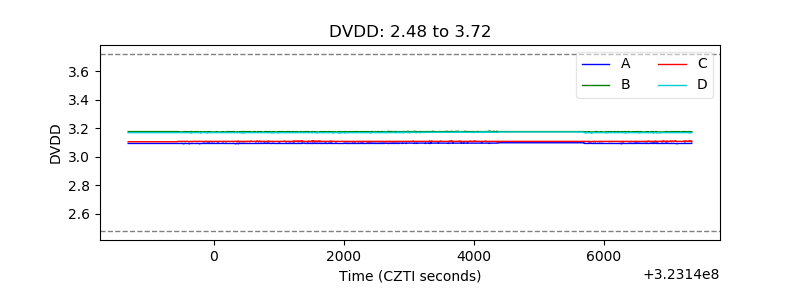 |
| Temperature 1 | 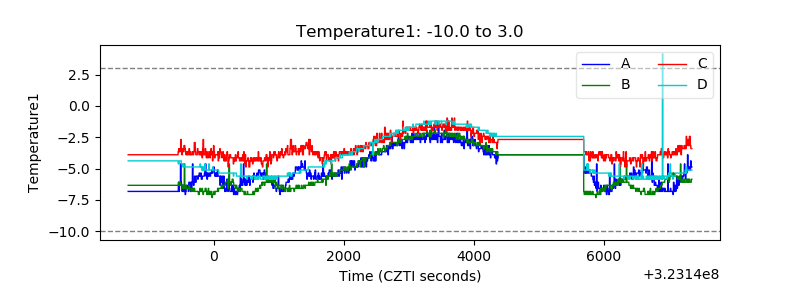 |
| Veto HV Monitor | 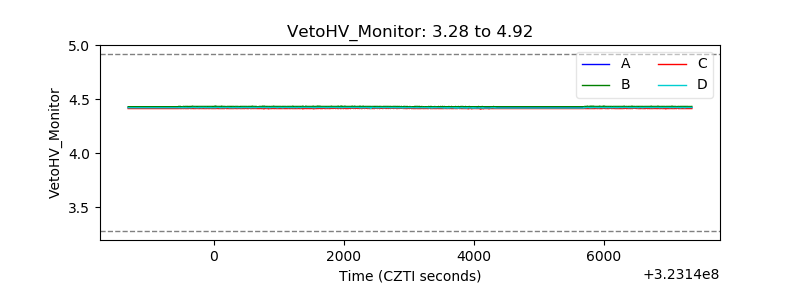 |
| Veto LLD | 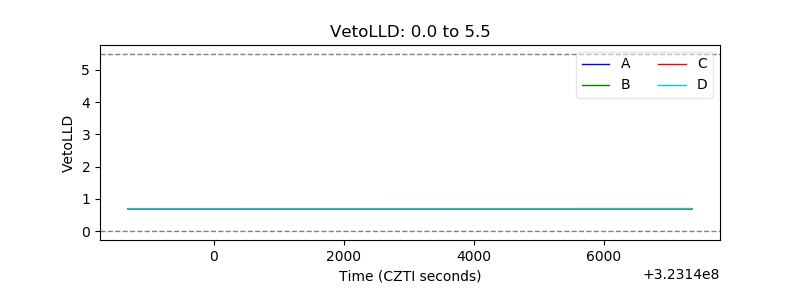 |
| Alpha Counter | 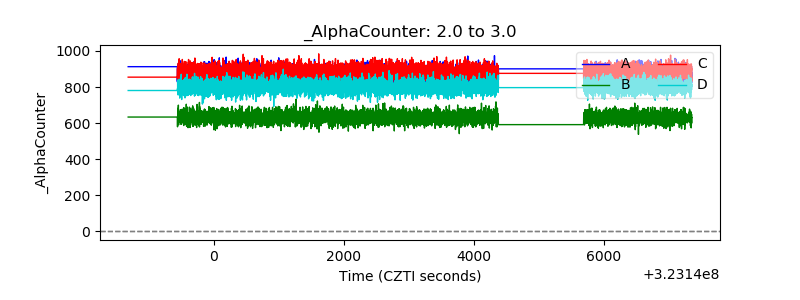 |
| _CPM_Rate | 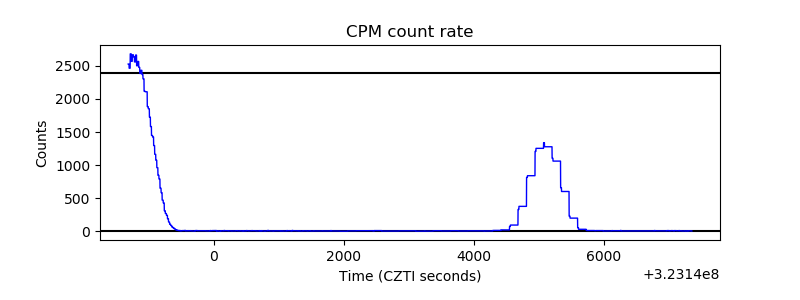 |
| CZT Counter | 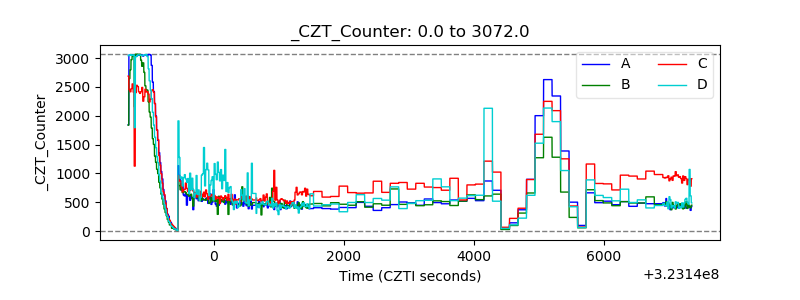 |
| +2.5 Volts monitor | 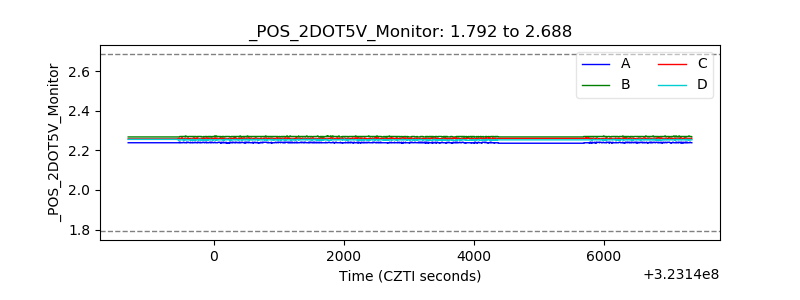 |
| +5 Volts monitor |  |
| _ROLL_ROT | 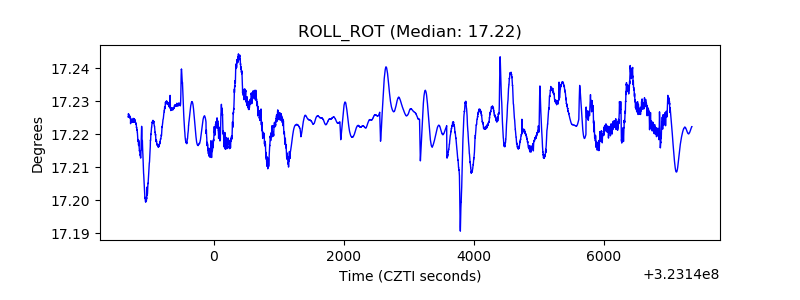 |
| _Roll_DEC |  |
| _Roll_RA | 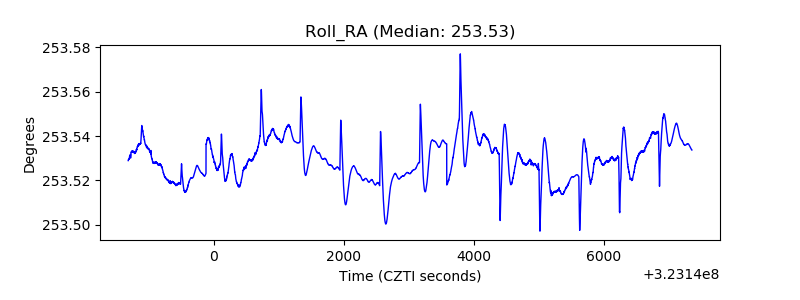 |
| Veto Counter | 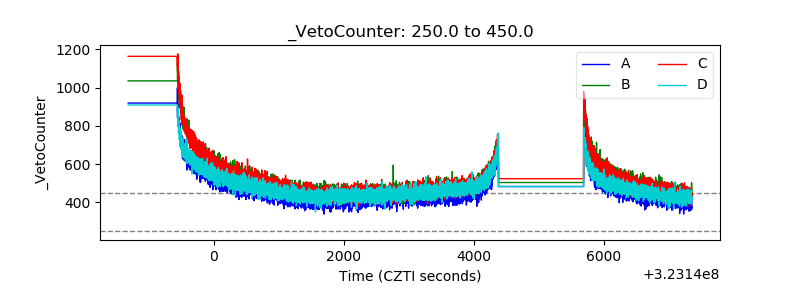 |