| Param | Original file | Final file |
|---|---|---|
| Filename | modeM0/AS1A07_145T01_9000003594_24334cztM0_level2.evt | modeM0/AS1A07_145T01_9000003594_24334cztM0_level2_quad_clean.evt |
| Size (bytes) | 558,959,040 | 99,083,520 |
| Size | 533.1 MB | 94.5 MB |
| Events in quadrant A | 3,246,131 | 640,409 |
| Events in quadrant B | 3,328,958 | 660,919 |
| Events in quadrant C | 5,684,146 | 618,531 |
| Events in quadrant D | 4,210,017 | 608,507 |
| Mode M0 | |||
|---|---|---|---|
| Quadrant | BADHDUFLAG | Total packets | Discarded packets |
| A | 0 | 14013 | 4 |
| B | 0 | 14130 | 6 |
| C | 0 | 21503 | 7 |
| D | 0 | 17019 | 6 |
| Mode M9 | |||
|---|---|---|---|
| Quadrant | BADHDUFLAG | Total packets | Discarded packets |
| A | 0 | 12 | 0 |
| B | 0 | 13 | 0 |
| C | 0 | 13 | 0 |
| D | 0 | 13 | 0 |
| Mode SS | |||
|---|---|---|---|
| Quadrant | BADHDUFLAG | Total packets | Discarded packets |
| A | 0 | 136 | 0 |
| B | 0 | 136 | 0 |
| C | 0 | 136 | 0 |
| D | 0 | 136 | 0 |
| Quadrant | Total seconds | Saturated seconds | Saturation percentage |
|---|---|---|---|
| A | 6781 | 27 | 0.398171% |
| B | 6780 | 62 | 0.914454% |
| C | 6780 | 210 | 3.097345% |
| D | 6780 | 180 | 2.654867% |
Noise dominated data is calculated using 1-second bins in cleaned event files. If a bin has >2000 counts, and if more than 50% of those come from <1% of pixels, then it is considered to be noise-dominated and hence unusable.
| Quadrant | # 1 sec bins | Bins with >0 counts | Bins with >2000 counts | High rate bins dominated by noise | Noise dominated (total time) | Noise dominated (detector-on time) | Marked lightcurve |
|---|---|---|---|---|---|---|---|
| A | 7852 | 6782 | 0 | 0 | 0.00% | 0.00% | 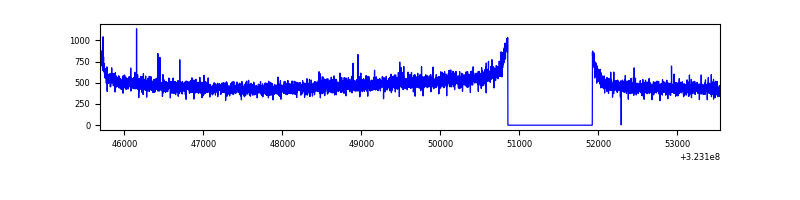 |
| B | 7852 | 6781 | 0 | 0 | 0.00% | 0.00% | 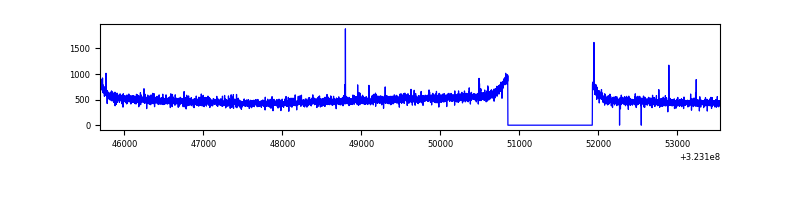 |
| C | 7852 | 6782 | 3 | 3 | 0.04% | 0.04% | 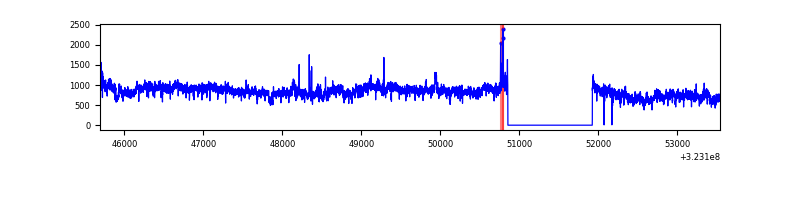 |
| D | 7852 | 6781 | 58 | 58 | 0.74% | 0.86% | 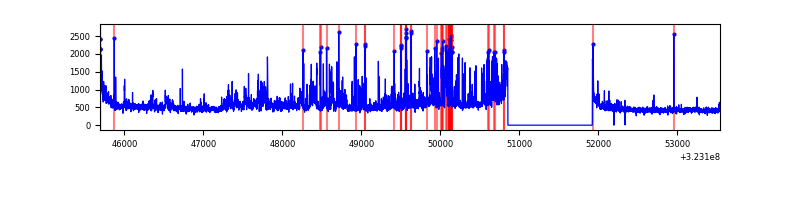 |
Top three noisy pixels from each quadrant. If the there are fewer than three noisy pixels in the level2.evt file, extra rows are filled as -1
| Pixel properties | Quadrant properties | ||||||
|---|---|---|---|---|---|---|---|
| Quadrant | DetID | PixID | Counts | Sigma | Mean | Median | Sigma |
| A | 13 | 254 | 10134 | 55.92 | 842 | 825 | 166.5 |
| A | 3 | 137 | 7407 | 39.54 | 842 | 825 | 166.5 |
| A | 0 | 226 | 7217 | 38.39 | 842 | 825 | 166.5 |
| B | 12 | 111 | 19609 | 117.17 | 844 | 823 | 160.3 |
| B | 11 | 111 | 17232 | 102.34 | 844 | 823 | 160.3 |
| B | 14 | 111 | 15577 | 92.02 | 844 | 823 | 160.3 |
| C | 7 | 247 | 2335194 | 12498.69 | 804 | 811 | 186.8 |
| C | 14 | 238 | 128504 | 683.69 | 804 | 811 | 186.8 |
| C | 2 | 16 | 63557 | 335.95 | 804 | 811 | 186.8 |
| D | 7 | 238 | 678721 | 3455.43 | 808 | 782 | 196.2 |
| D | 1 | 52 | 138602 | 702.46 | 808 | 782 | 196.2 |
| D | 7 | 223 | 133144 | 674.64 | 808 | 782 | 196.2 |
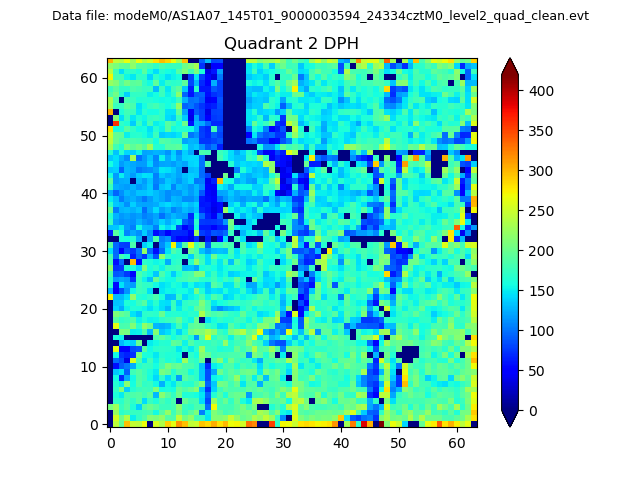
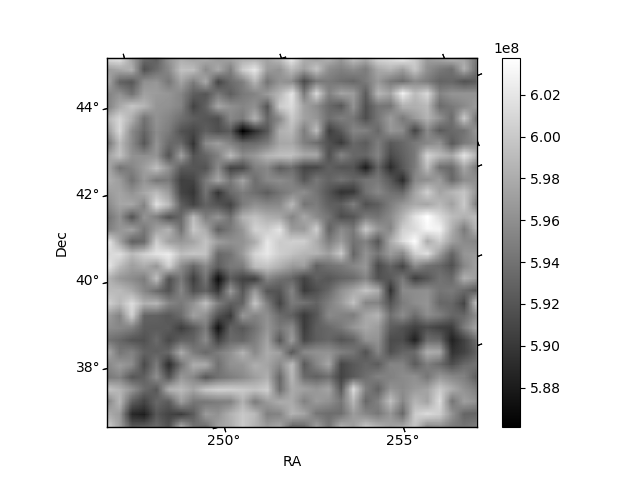
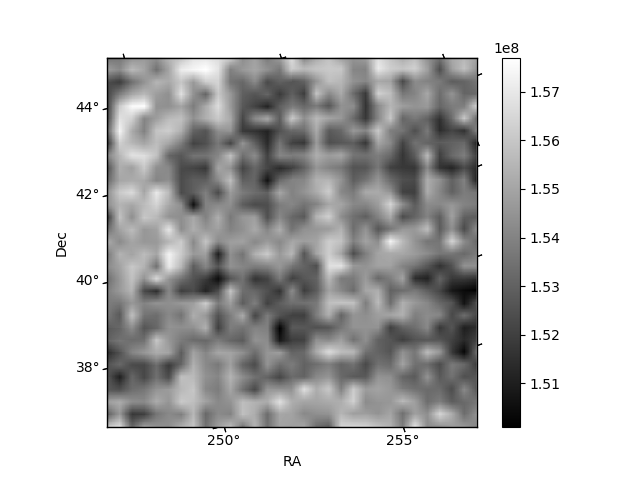
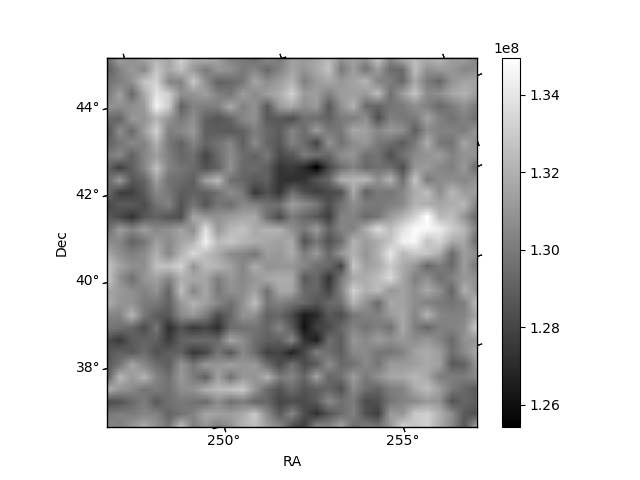
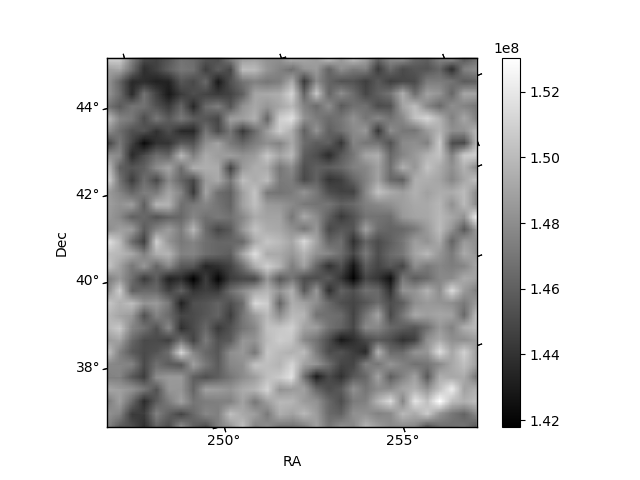
Histogram calculated using DETX and DETY for each event in the final _common_clean file
| Quadrant A | 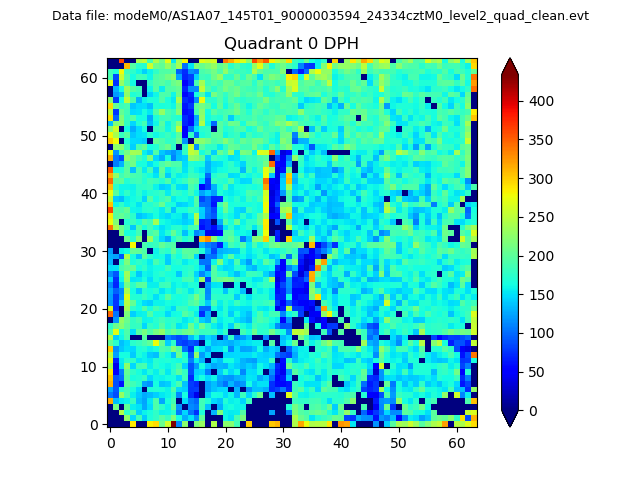 |
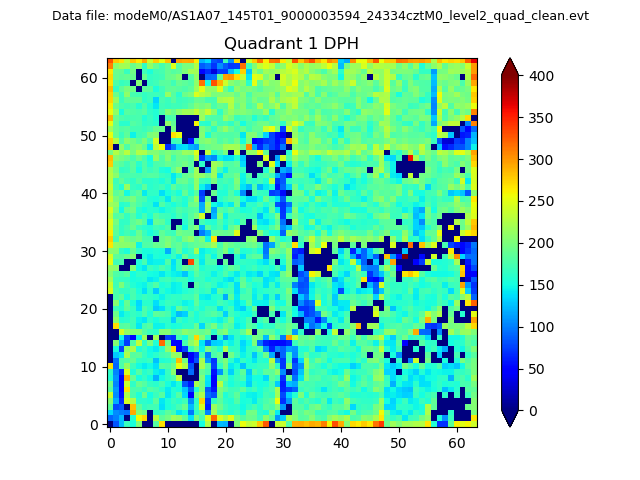 |
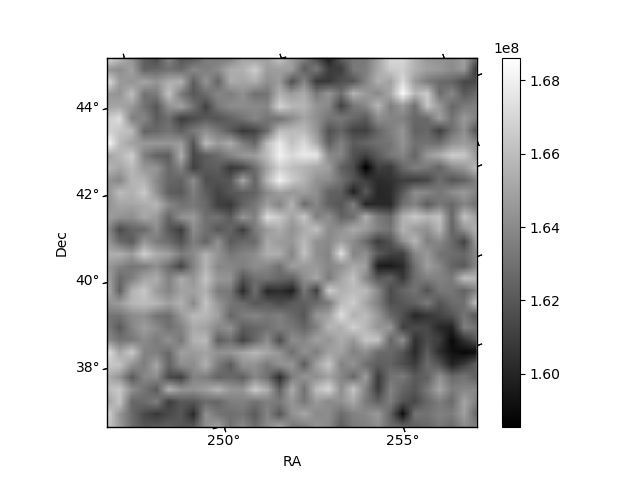
Quadrant B |
|---|---|---|---|
| Quadrant D | 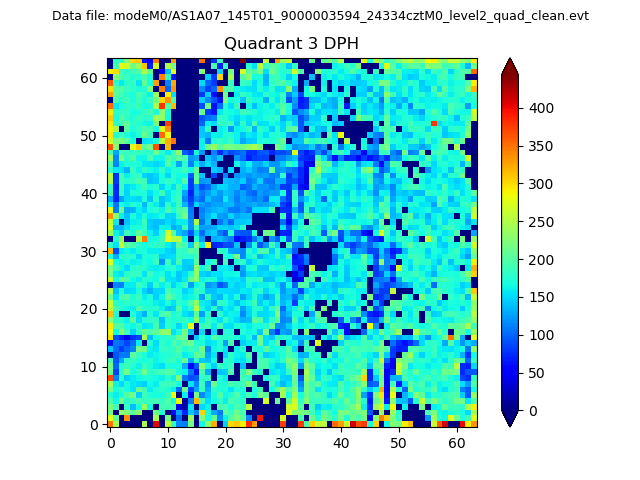 |
 |
Quadrant C |
| Plot type | Count rate plots | Images |
|---|---|---|
| Comparison with Poisson distribution Blue bars denote a histogram of data divided into 1 sec bins. Red curve is a Poisson curve with rate = median count rate of data. |
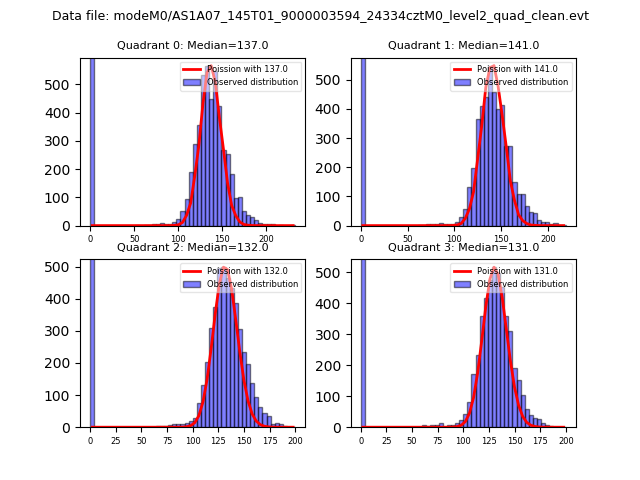 |
 |
| Quadrant-wise count rates Data is divided into 100 sec bins |
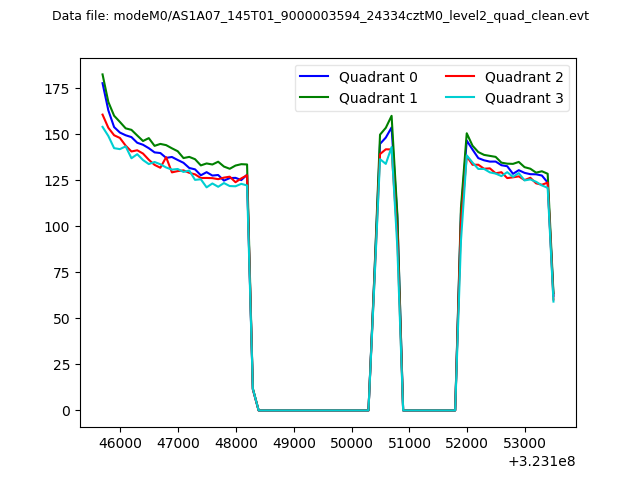 |
|
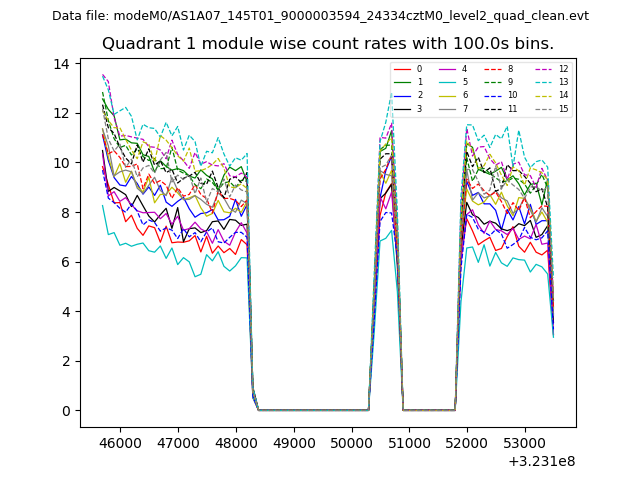
| Module-wise count rates for Quadrant A Data is divided into 100 sec bins |
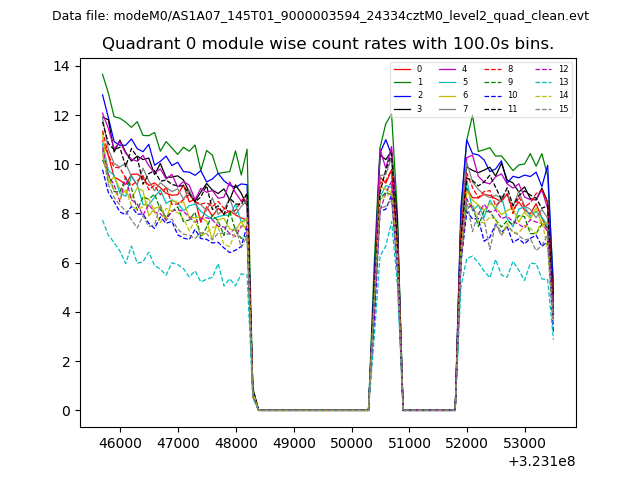 |
 |
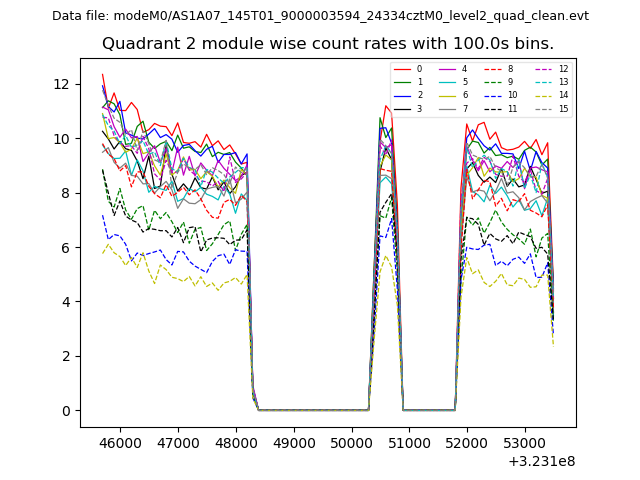
| Module-wise count rates for Quadrant B Data is divided into 100 sec bins |
 |
 |
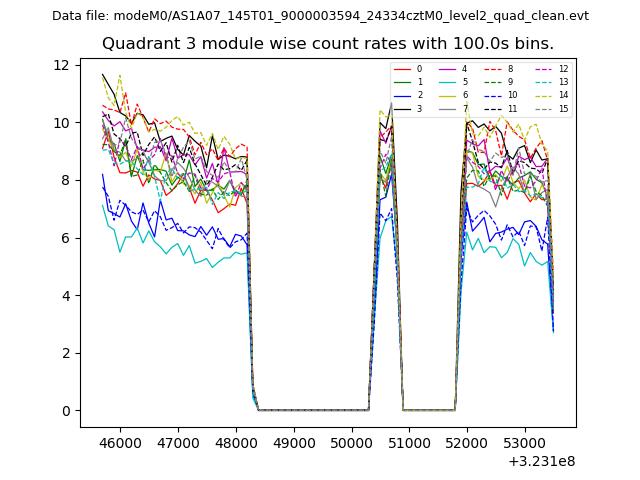
| Module-wise count rates for Quadrant C Data is divided into 100 sec bins |
 |
 |
| Module-wise count rates for Quadrant D Data is divided into 100 sec bins |
 |
 |
| Parameter | Plot |
|---|---|
| CZT HV Monitor | 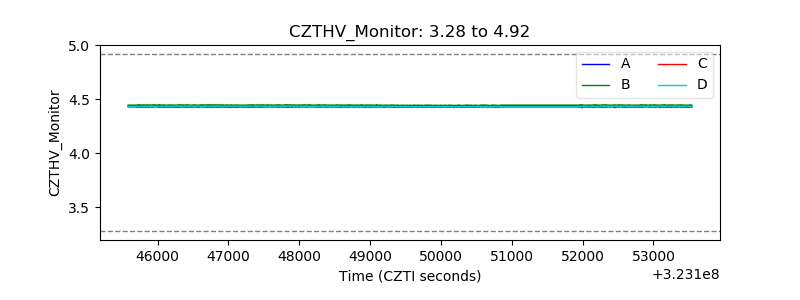 |
| D_VDD | 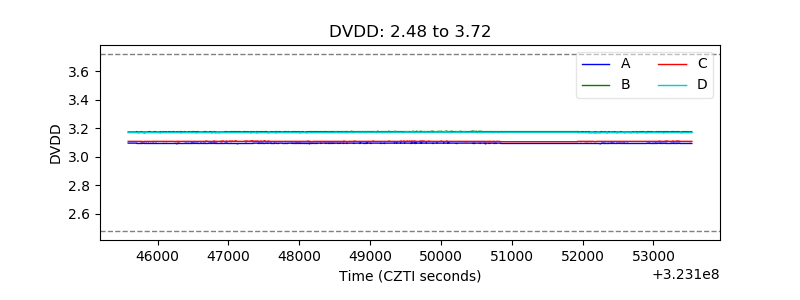 |
| Temperature 1 | 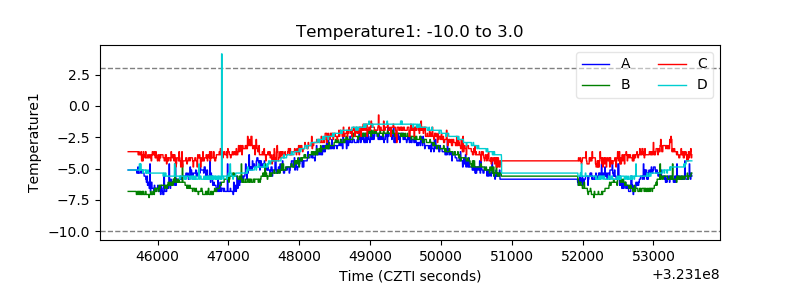 |
| Veto HV Monitor | 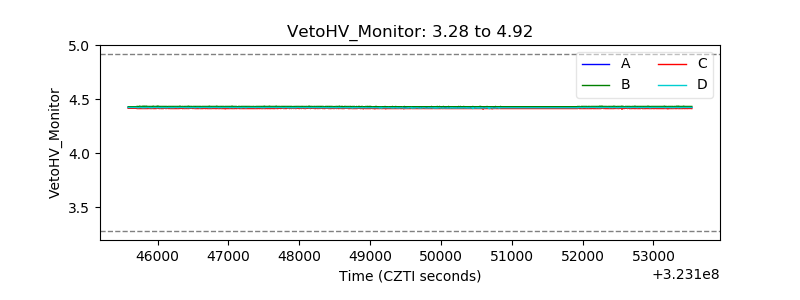 |
| Veto LLD | 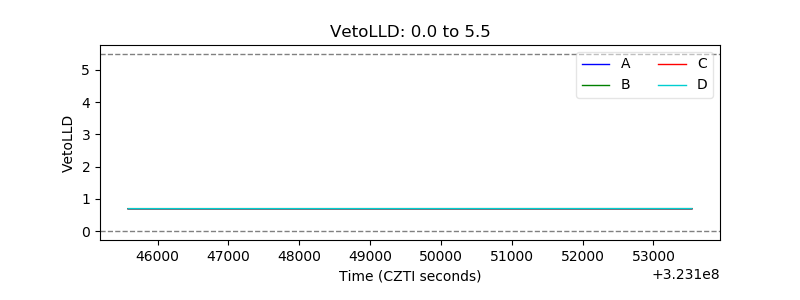 |
| Alpha Counter | 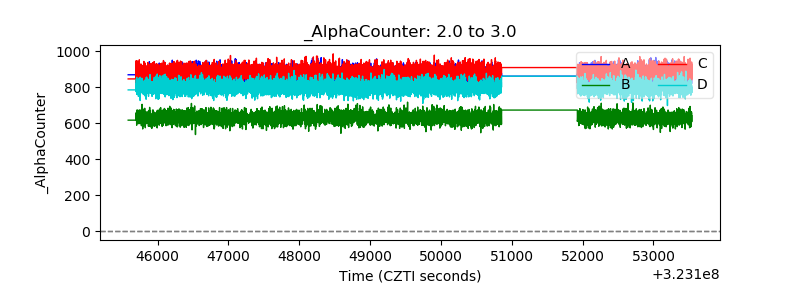 |
| _CPM_Rate | 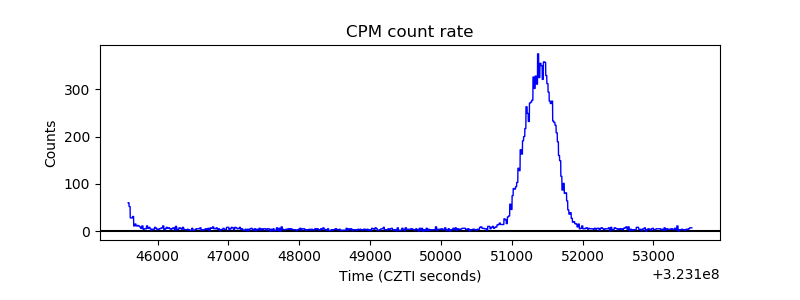 |
| CZT Counter | 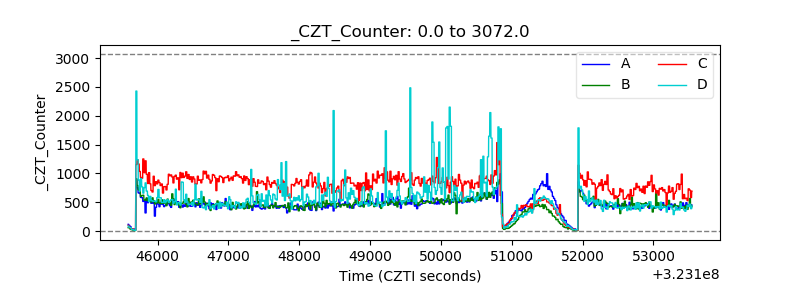 |
| +2.5 Volts monitor |  |
| +5 Volts monitor | 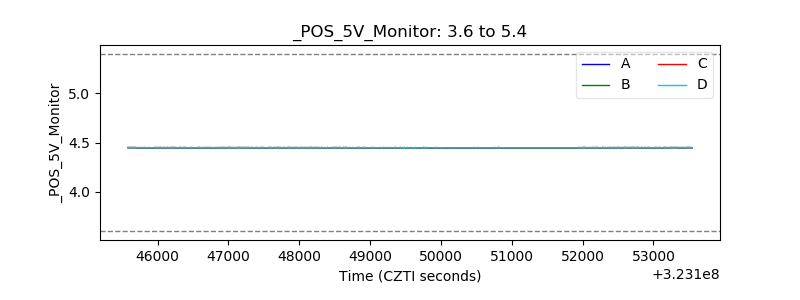 |
| _ROLL_ROT | 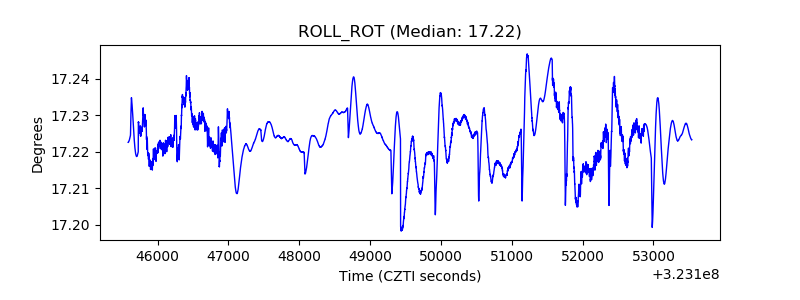 |
| _Roll_DEC | 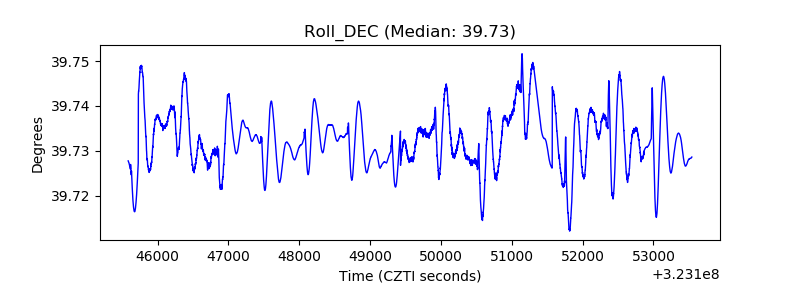 |
| _Roll_RA | 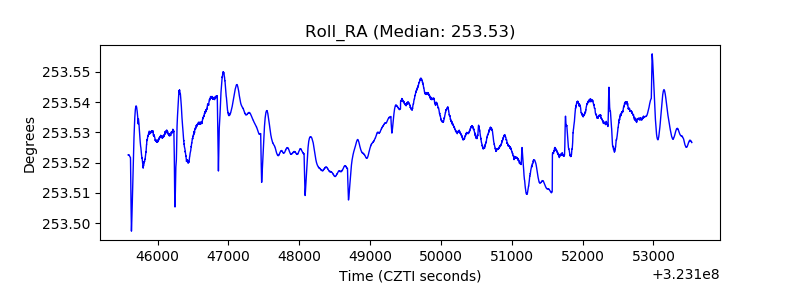 |
| Veto Counter | 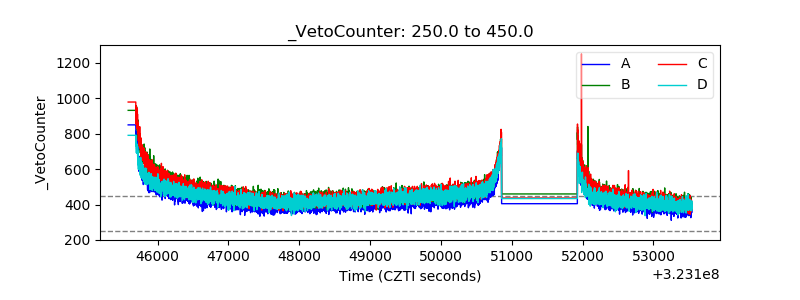 |