| Param | Original file | Final file |
|---|---|---|
| Filename | modeM0/AS1A07_145T01_9000003594_24335cztM0_level2.evt | modeM0/AS1A07_145T01_9000003594_24335cztM0_level2_quad_clean.evt |
| Size (bytes) | 501,220,800 | 83,136,960 |
| Size | 478.0 MB | 79.3 MB |
| Events in quadrant A | 2,907,185 | 525,784 |
| Events in quadrant B | 2,959,022 | 542,217 |
| Events in quadrant C | 5,258,139 | 509,332 |
| Events in quadrant D | 3,635,382 | 507,947 |
| Mode M0 | |||
|---|---|---|---|
| Quadrant | BADHDUFLAG | Total packets | Discarded packets |
| A | 0 | 12677 | 5 |
| B | 0 | 12772 | 7 |
| C | 0 | 20041 | 19 |
| D | 0 | 15082 | 13 |
| Mode M9 | |||
|---|---|---|---|
| Quadrant | BADHDUFLAG | Total packets | Discarded packets |
| A | 0 | 7 | 0 |
| B | 0 | 7 | 0 |
| C | 0 | 7 | 0 |
| D | 0 | 7 | 0 |
| Mode SS | |||
|---|---|---|---|
| Quadrant | BADHDUFLAG | Total packets | Discarded packets |
| A | 0 | 124 | 0 |
| B | 0 | 124 | 0 |
| C | 0 | 124 | 0 |
| D | 0 | 124 | 0 |
| Quadrant | Total seconds | Saturated seconds | Saturation percentage |
|---|---|---|---|
| A | 6198 | 73 | 1.177799% |
| B | 6198 | 99 | 1.597289% |
| C | 6196 | 255 | 4.115558% |
| D | 6196 | 96 | 1.549387% |
Noise dominated data is calculated using 1-second bins in cleaned event files. If a bin has >2000 counts, and if more than 50% of those come from <1% of pixels, then it is considered to be noise-dominated and hence unusable.
| Quadrant | # 1 sec bins | Bins with >0 counts | Bins with >2000 counts | High rate bins dominated by noise | Noise dominated (total time) | Noise dominated (detector-on time) | Marked lightcurve |
|---|---|---|---|---|---|---|---|
| A | 6864 | 6198 | 0 | 0 | 0.00% | 0.00% | 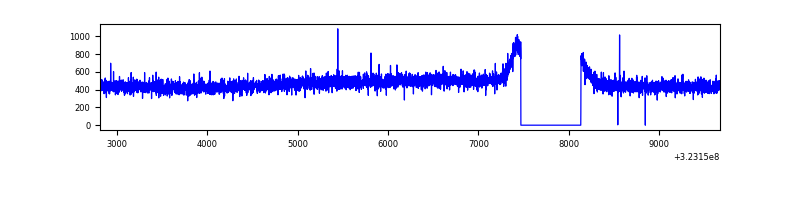 |
| B | 6865 | 6199 | 0 | 0 | 0.00% | 0.00% | 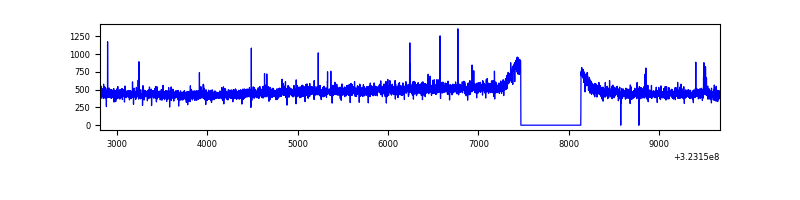 |
| C | 6866 | 6200 | 26 | 26 | 0.38% | 0.42% | 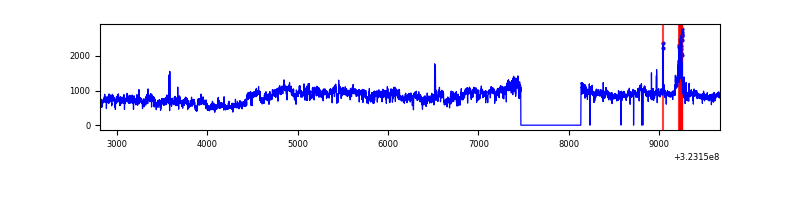 |
| D | 6865 | 6200 | 34 | 34 | 0.50% | 0.55% | 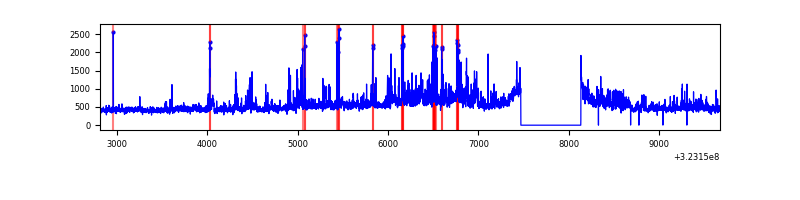 |
Top three noisy pixels from each quadrant. If the there are fewer than three noisy pixels in the level2.evt file, extra rows are filled as -1
| Pixel properties | Quadrant properties | ||||||
|---|---|---|---|---|---|---|---|
| Quadrant | DetID | PixID | Counts | Sigma | Mean | Median | Sigma |
| A | 13 | 254 | 8806 | 52.8 | 754 | 738 | 152.8 |
| A | 3 | 137 | 7031 | 41.18 | 754 | 738 | 152.8 |
| A | 0 | 226 | 6397 | 37.03 | 754 | 738 | 152.8 |
| B | 12 | 111 | 17746 | 118.35 | 751 | 733 | 143.8 |
| B | 11 | 111 | 15849 | 105.15 | 751 | 733 | 143.8 |
| B | 14 | 111 | 14197 | 93.66 | 751 | 733 | 143.8 |
| C | 7 | 247 | 2219054 | 13269.24 | 715 | 718 | 167.2 |
| C | 2 | 16 | 123861 | 736.59 | 715 | 718 | 167.2 |
| C | 14 | 238 | 114864 | 682.78 | 715 | 718 | 167.2 |
| D | 7 | 238 | 388757 | 2164.45 | 730 | 708 | 179.3 |
| D | 8 | 195 | 276185 | 1536.55 | 730 | 708 | 179.3 |
| D | 7 | 223 | 102297 | 566.64 | 730 | 708 | 179.3 |
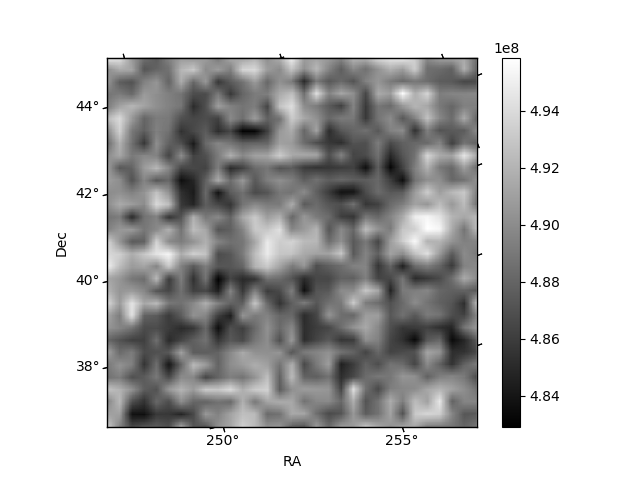
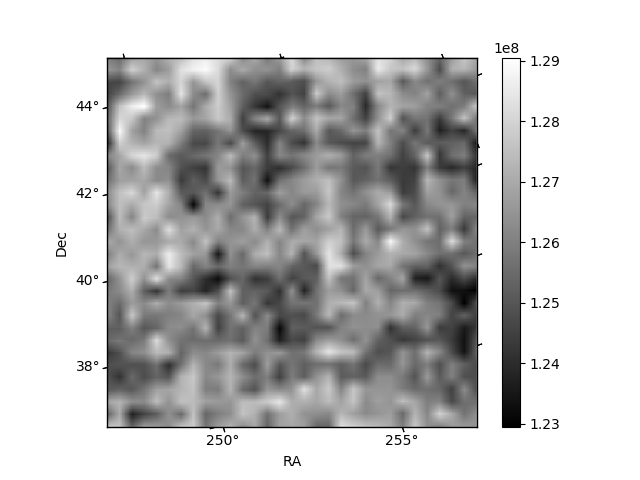
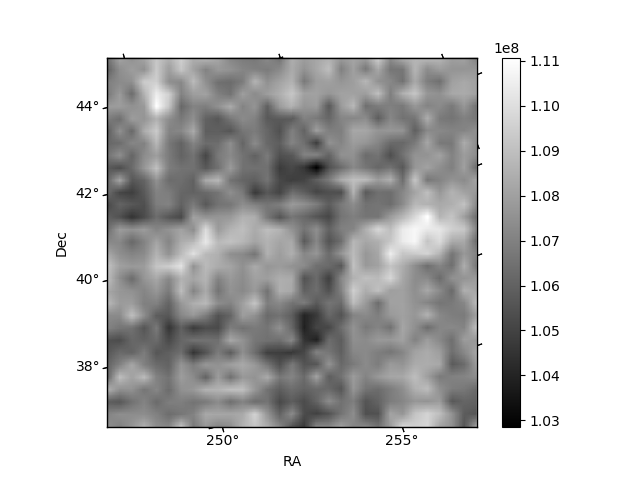
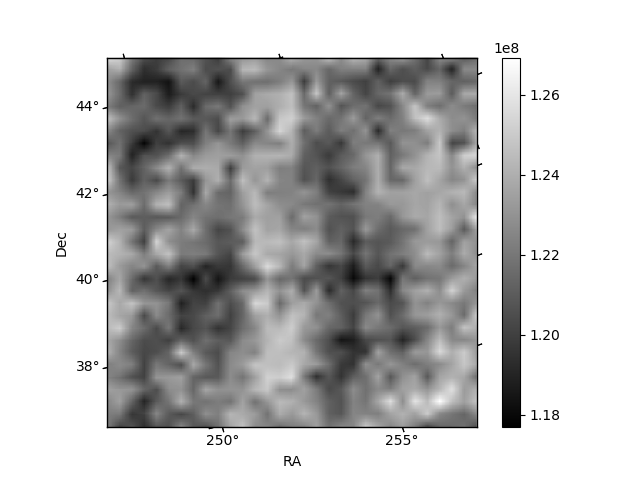
Histogram calculated using DETX and DETY for each event in the final _common_clean file
| Quadrant A | 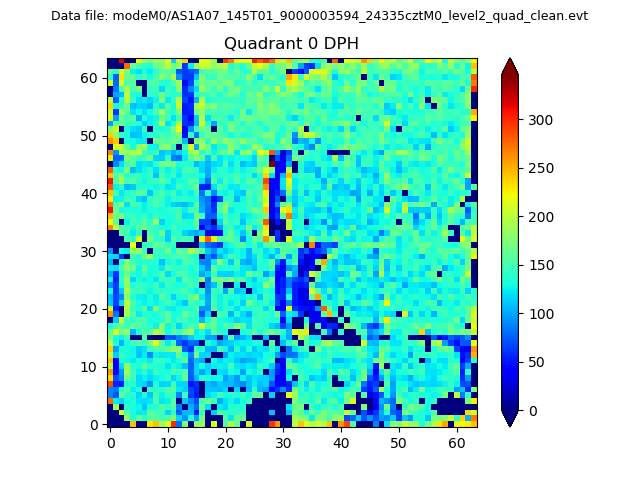 |
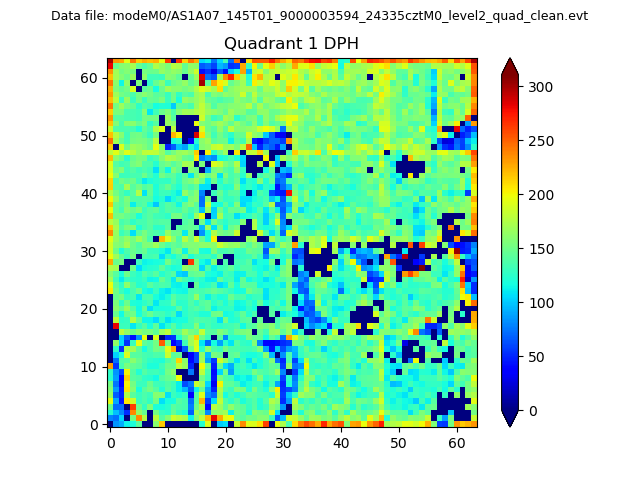 |
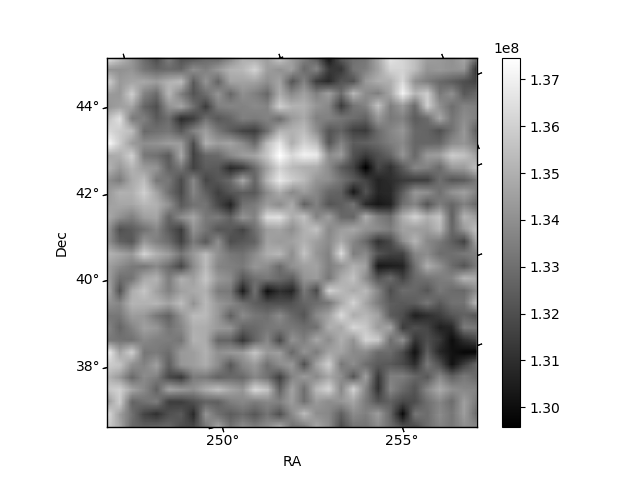
Quadrant B |
|---|---|---|---|
| Quadrant D | 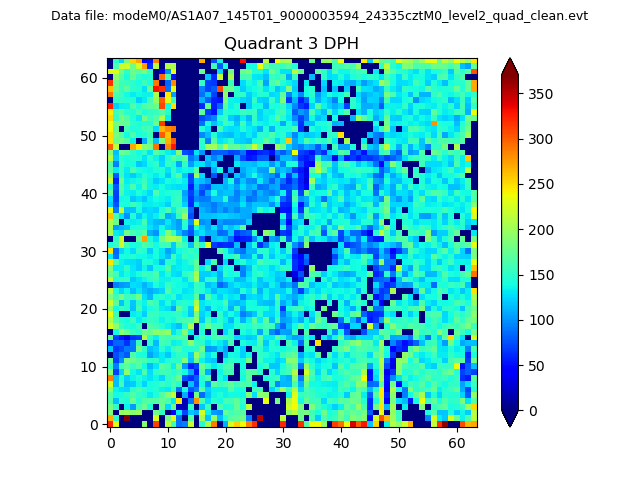 |
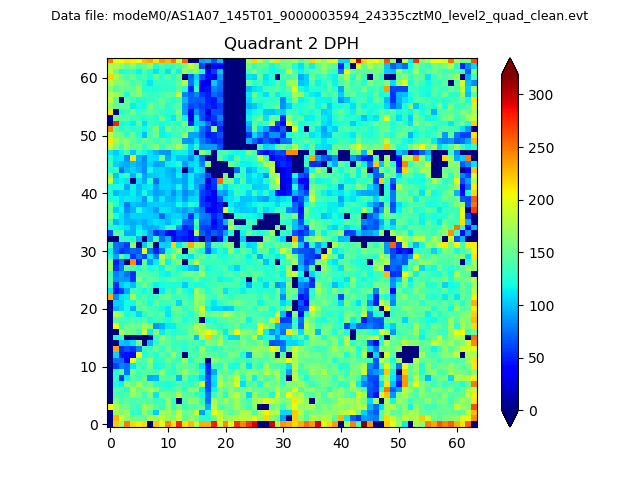 |
Quadrant C |
| Plot type | Count rate plots | Images |
|---|---|---|
| Comparison with Poisson distribution Blue bars denote a histogram of data divided into 1 sec bins. Red curve is a Poisson curve with rate = median count rate of data. |
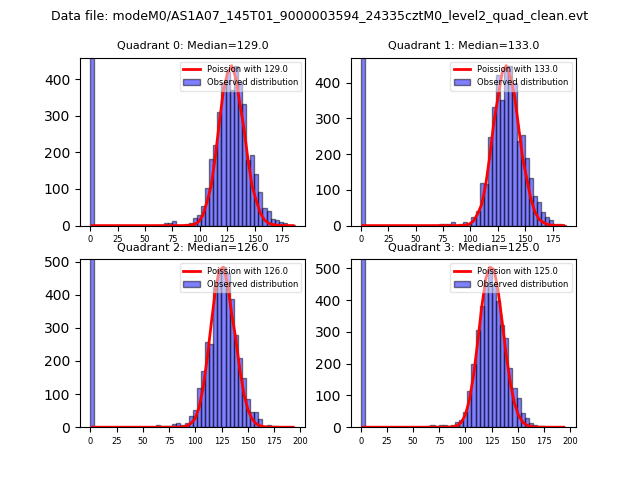 |
 |
| Quadrant-wise count rates Data is divided into 100 sec bins |
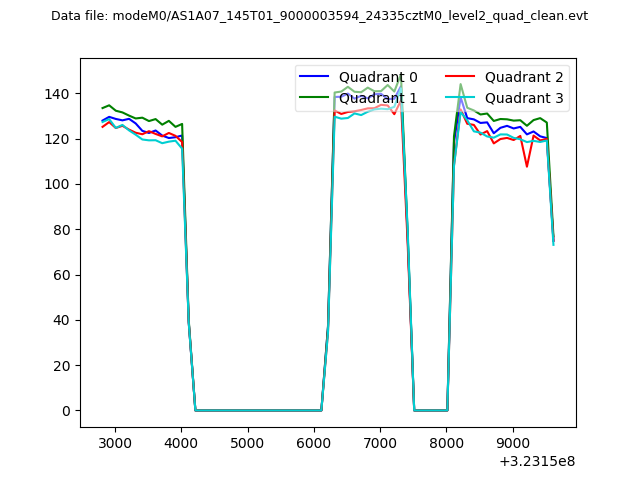 |
|
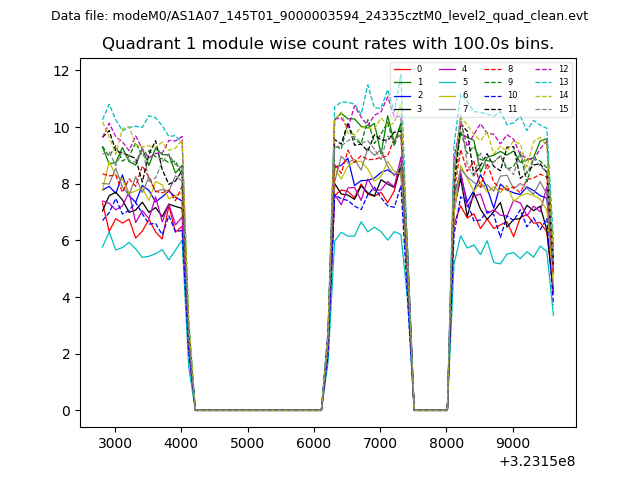
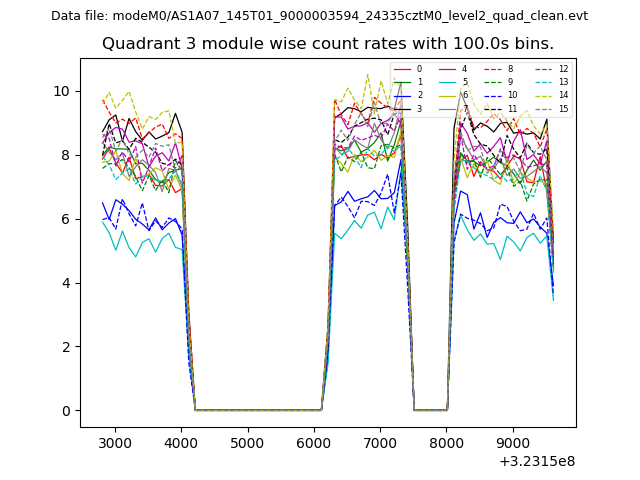
| Module-wise count rates for Quadrant A Data is divided into 100 sec bins |
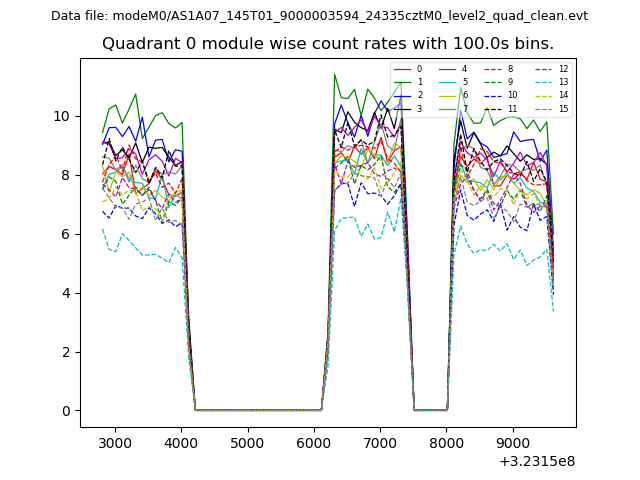 |
 |
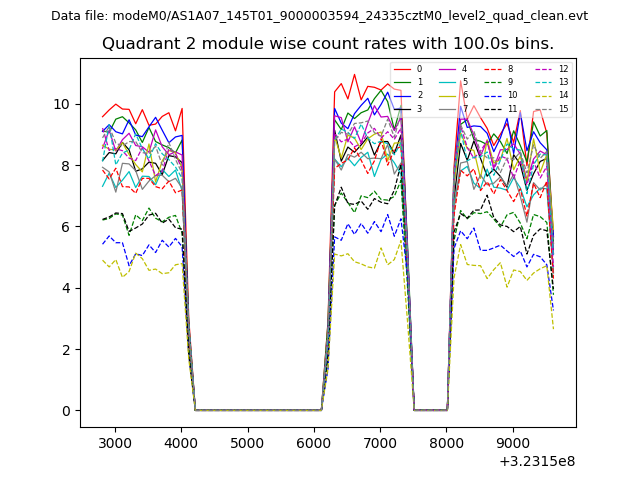
| Module-wise count rates for Quadrant B Data is divided into 100 sec bins |
 |
 |
| Module-wise count rates for Quadrant C Data is divided into 100 sec bins |
 |
 |
| Module-wise count rates for Quadrant D Data is divided into 100 sec bins |
 |
 |
| Parameter | Plot |
|---|---|
| CZT HV Monitor | 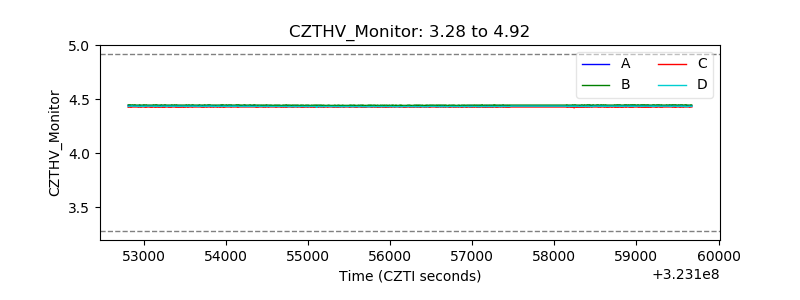 |
| D_VDD | 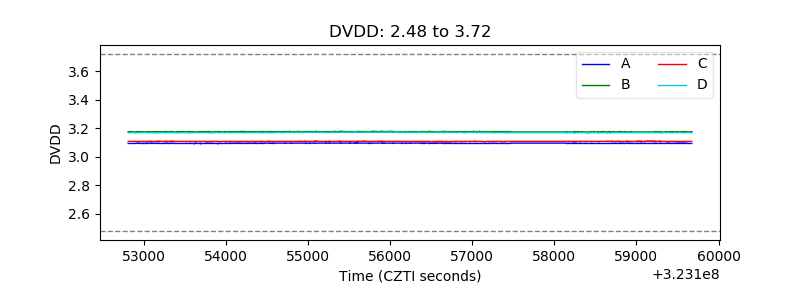 |
| Temperature 1 | 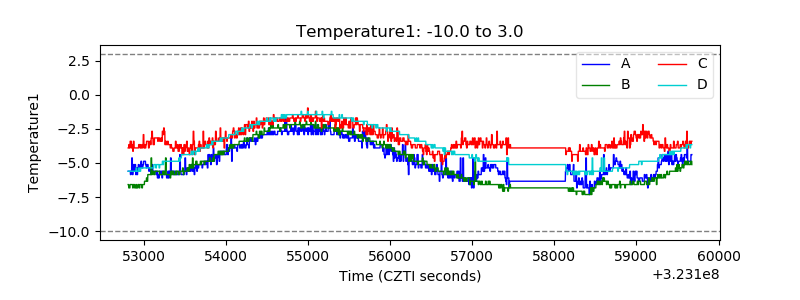 |
| Veto HV Monitor | 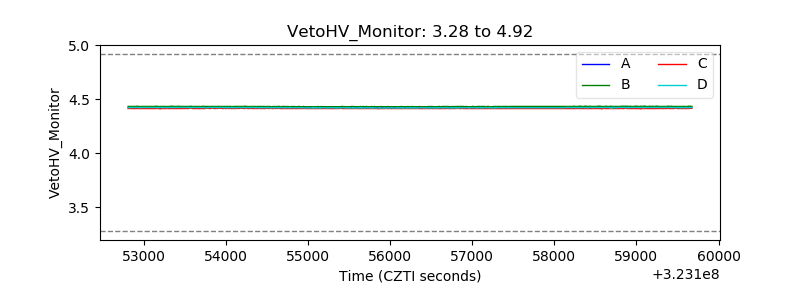 |
| Veto LLD | 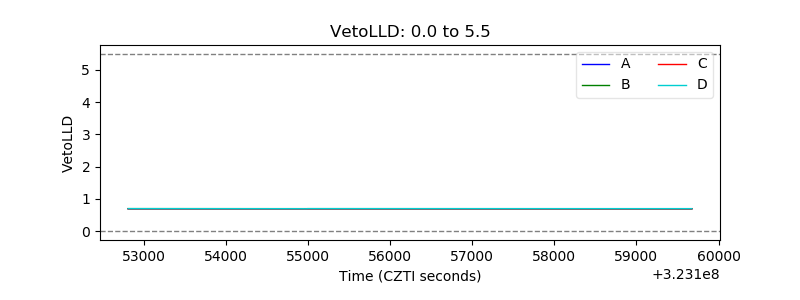 |
| Alpha Counter | 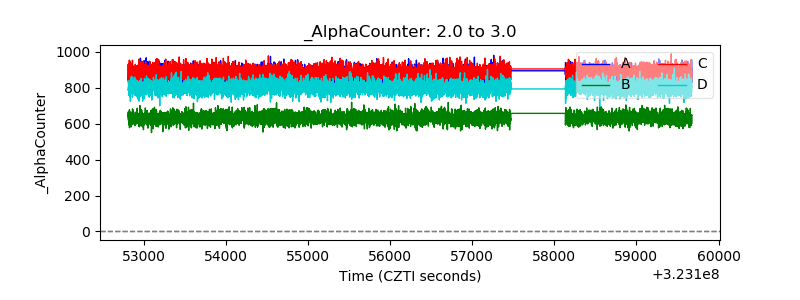 |
| _CPM_Rate | 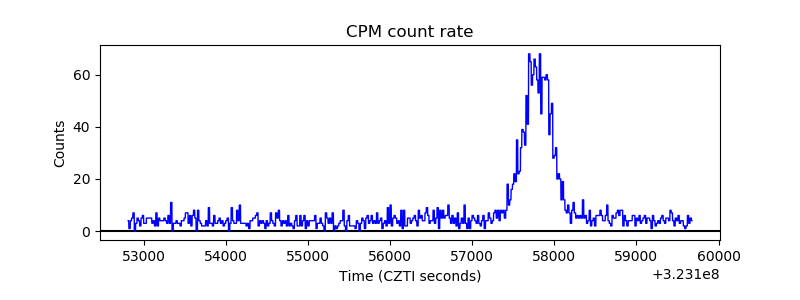 |
| CZT Counter |  |
| +2.5 Volts monitor |  |
| +5 Volts monitor | 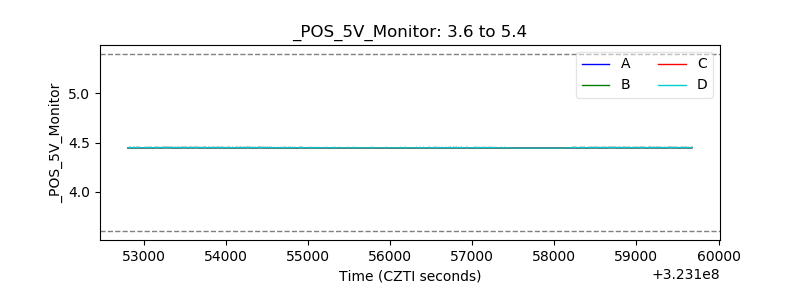 |
| _ROLL_ROT | 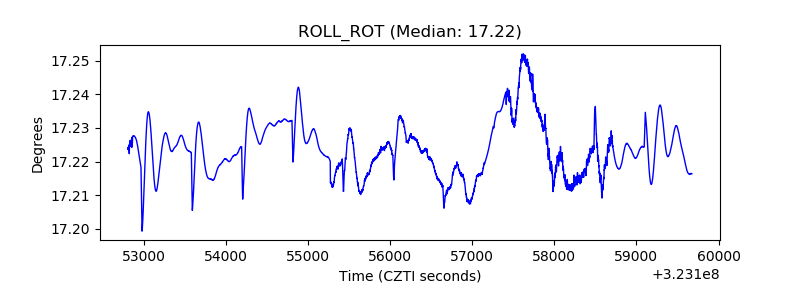 |
| _Roll_DEC | 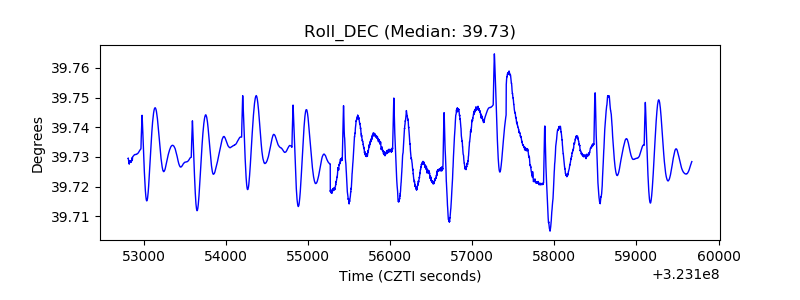 |
| _Roll_RA | 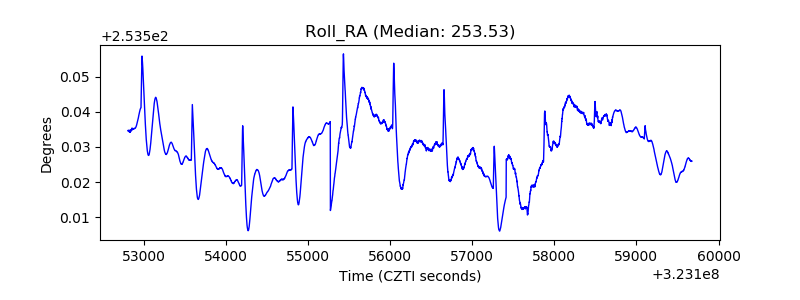 |
| Veto Counter | 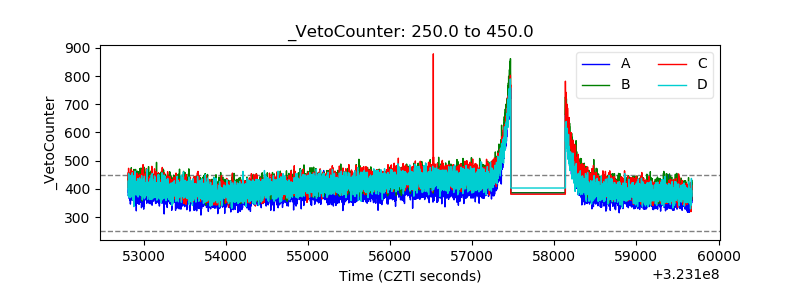 |