| Param | Original file | Final file |
|---|---|---|
| Filename | modeM0/AS1A07_145T01_9000003594_24337cztM0_level2.evt | modeM0/AS1A07_145T01_9000003594_24337cztM0_level2_quad_clean.evt |
| Size (bytes) | 651,237,120 | 86,990,400 |
| Size | 621.1 MB | 83.0 MB |
| Events in quadrant A | 3,286,547 | 543,785 |
| Events in quadrant B | 3,344,989 | 562,173 |
| Events in quadrant C | 6,569,097 | 522,545 |
| Events in quadrant D | 6,047,186 | 516,280 |
| Mode M0 | |||
|---|---|---|---|
| Quadrant | BADHDUFLAG | Total packets | Discarded packets |
| A | 0 | 14423 | 1 |
| B | 0 | 14485 | 1 |
| C | 0 | 24534 | 1 |
| D | 0 | 22794 | 8 |
| Mode M9 | |||
|---|---|---|---|
| Quadrant | BADHDUFLAG | Total packets | Discarded packets |
| A | 0 | 2 | 0 |
| B | 0 | 2 | 0 |
| C | 0 | 2 | 0 |
| D | 0 | 2 | 0 |
| Mode SS | |||
|---|---|---|---|
| Quadrant | BADHDUFLAG | Total packets | Discarded packets |
| A | 0 | 142 | 0 |
| B | 0 | 142 | 0 |
| C | 0 | 142 | 0 |
| D | 0 | 142 | 0 |
| Quadrant | Total seconds | Saturated seconds | Saturation percentage |
|---|---|---|---|
| A | 7029 | 226 | 3.215251% |
| B | 7029 | 231 | 3.286385% |
| C | 7029 | 410 | 5.832978% |
| D | 7029 | 869 | 12.363067% |
Noise dominated data is calculated using 1-second bins in cleaned event files. If a bin has >2000 counts, and if more than 50% of those come from <1% of pixels, then it is considered to be noise-dominated and hence unusable.
| Quadrant | # 1 sec bins | Bins with >0 counts | Bins with >2000 counts | High rate bins dominated by noise | Noise dominated (total time) | Noise dominated (detector-on time) | Marked lightcurve |
|---|---|---|---|---|---|---|---|
| A | 7153 | 7029 | 0 | 0 | 0.00% | 0.00% | 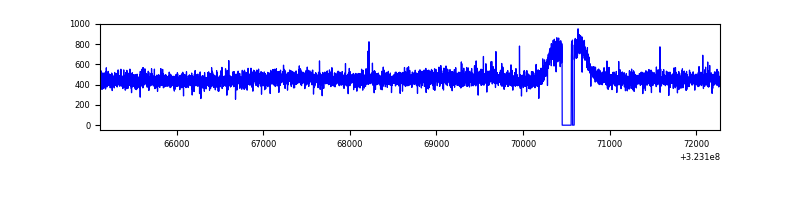 |
| B | 7153 | 7028 | 1 | 1 | 0.01% | 0.01% | 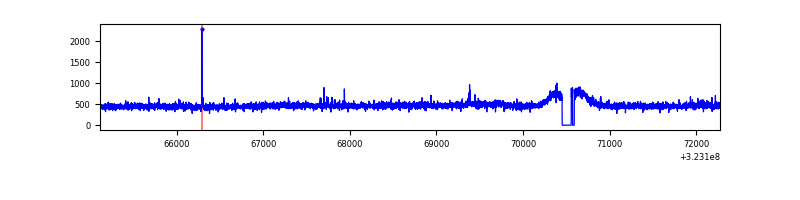 |
| C | 7153 | 7028 | 0 | 0 | 0.00% | 0.00% | 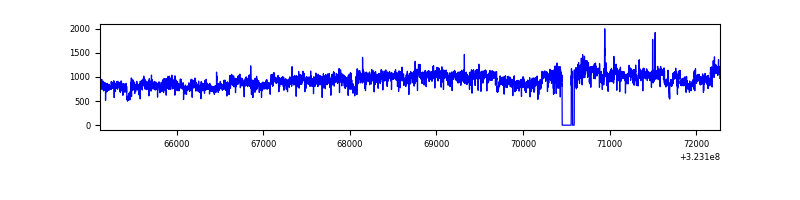 |
| D | 7153 | 7028 | 643 | 643 | 8.99% | 9.15% | 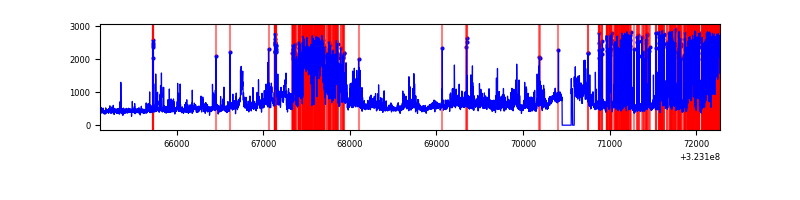 |
Top three noisy pixels from each quadrant. If the there are fewer than three noisy pixels in the level2.evt file, extra rows are filled as -1
| Pixel properties | Quadrant properties | ||||||
|---|---|---|---|---|---|---|---|
| Quadrant | DetID | PixID | Counts | Sigma | Mean | Median | Sigma |
| A | 13 | 254 | 10457 | 55.35 | 852 | 831 | 173.9 |
| A | 3 | 137 | 7984 | 41.13 | 852 | 831 | 173.9 |
| A | 0 | 226 | 7384 | 37.68 | 852 | 831 | 173.9 |
| B | 12 | 111 | 20523 | 119.64 | 849 | 824 | 164.6 |
| B | 11 | 111 | 18628 | 108.13 | 849 | 824 | 164.6 |
| B | 14 | 111 | 16570 | 95.63 | 849 | 824 | 164.6 |
| C | 7 | 247 | 3222710 | 17049.57 | 809 | 811 | 189.0 |
| C | 14 | 238 | 126988 | 667.7 | 809 | 811 | 189.0 |
| C | 2 | 16 | 37921 | 196.38 | 809 | 811 | 189.0 |
| D | 7 | 238 | 2239774 | 11416.67 | 802 | 774 | 196.1 |
| D | 8 | 195 | 514086 | 2617.38 | 802 | 774 | 196.1 |
| D | 12 | 233 | 182045 | 924.3 | 802 | 774 | 196.1 |
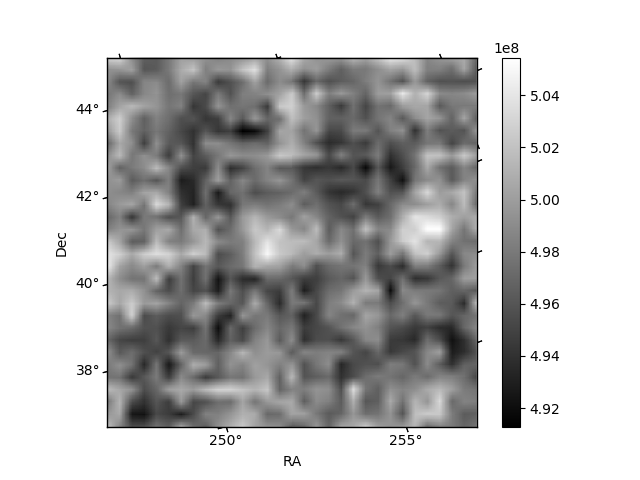
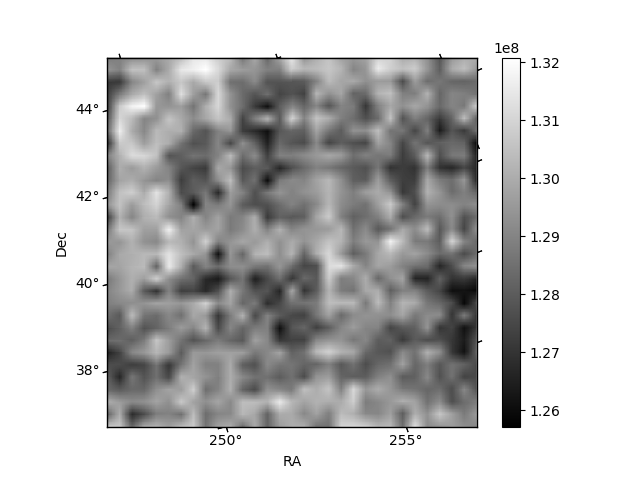
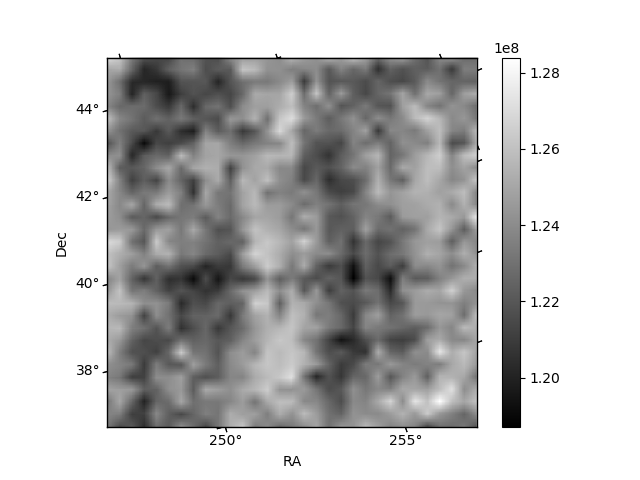
Histogram calculated using DETX and DETY for each event in the final _common_clean file
| Quadrant A | 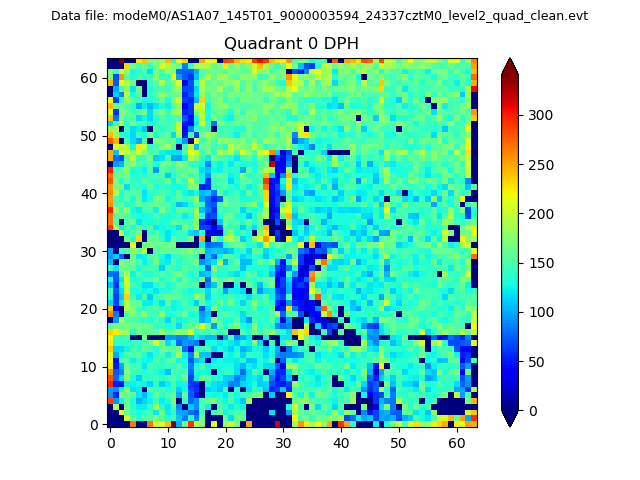 |
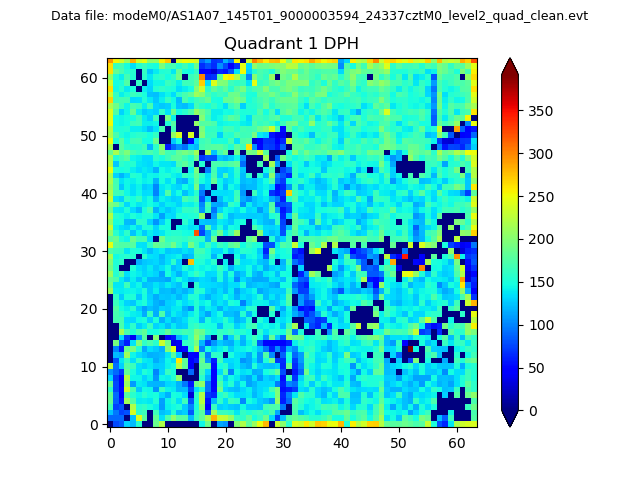 |
Quadrant B |
|---|---|---|---|
| Quadrant D |  |
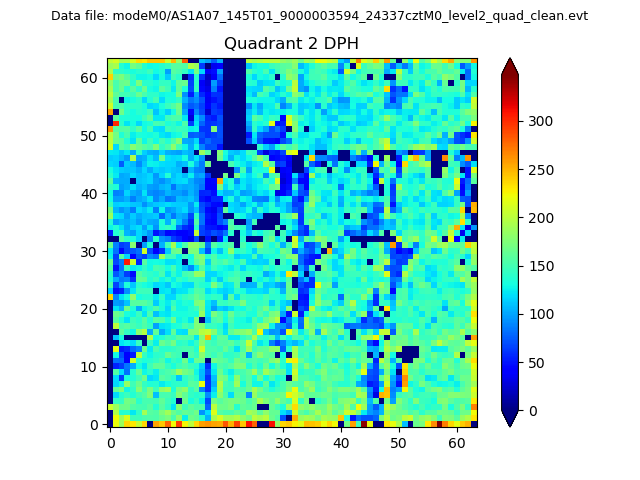 |
Quadrant C |
| Plot type | Count rate plots | Images |
|---|---|---|
| Comparison with Poisson distribution Blue bars denote a histogram of data divided into 1 sec bins. Red curve is a Poisson curve with rate = median count rate of data. |
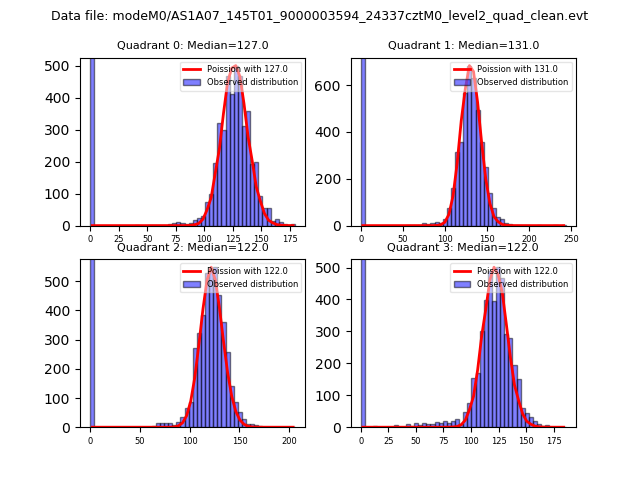 |
 |
| Quadrant-wise count rates Data is divided into 100 sec bins |
 |
|
| Module-wise count rates for Quadrant A Data is divided into 100 sec bins |
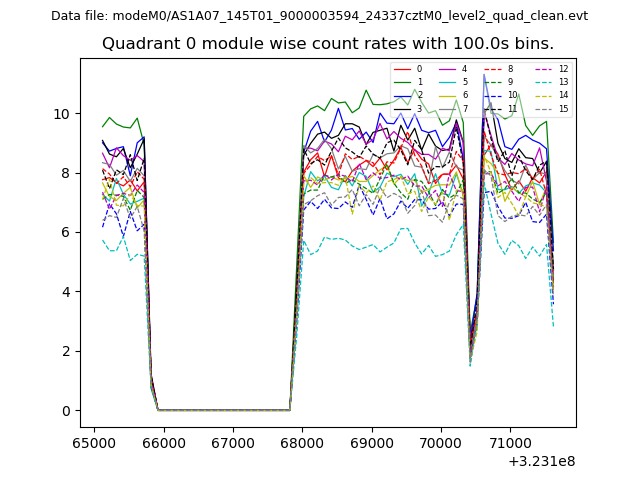 |
 |
| Module-wise count rates for Quadrant B Data is divided into 100 sec bins |
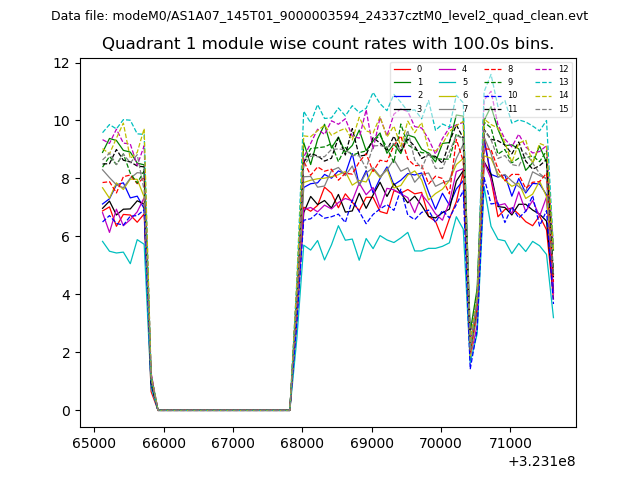 |
 |
| Module-wise count rates for Quadrant C Data is divided into 100 sec bins |
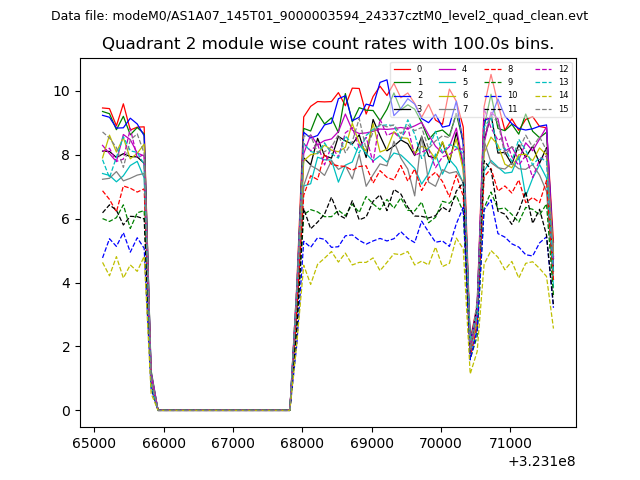 |
 |
| Module-wise count rates for Quadrant D Data is divided into 100 sec bins |
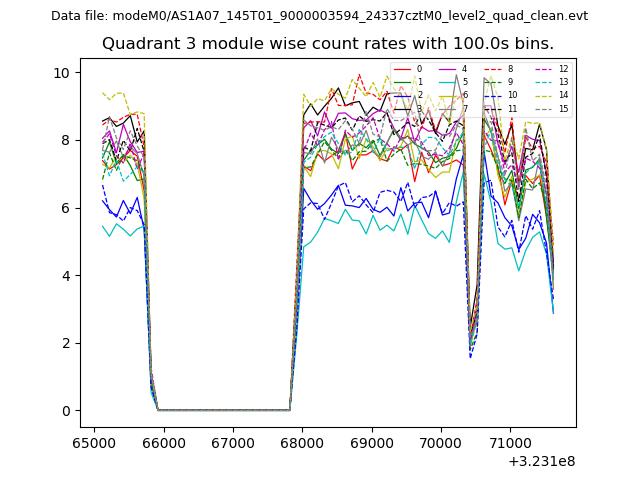 |
 |
| Parameter | Plot |
|---|---|
| CZT HV Monitor | 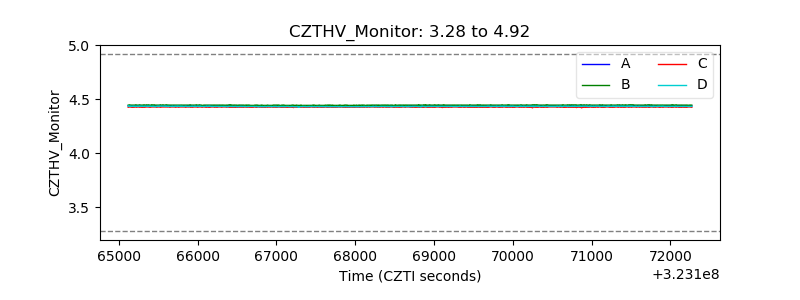 |
| D_VDD | 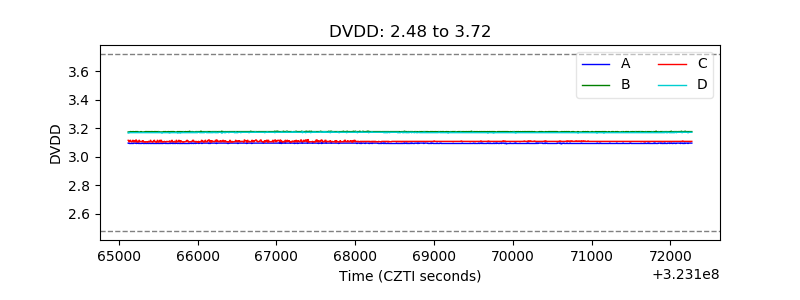 |
| Temperature 1 | 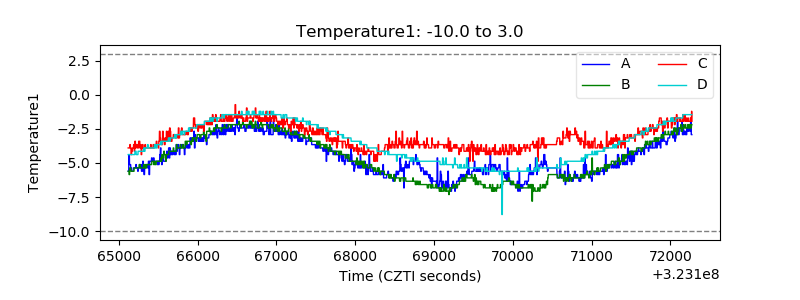 |
| Veto HV Monitor | 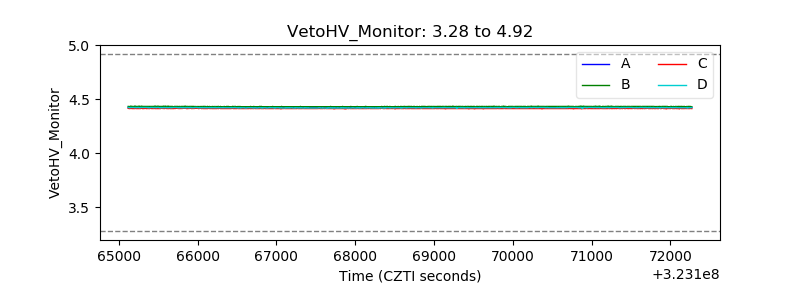 |
| Veto LLD | 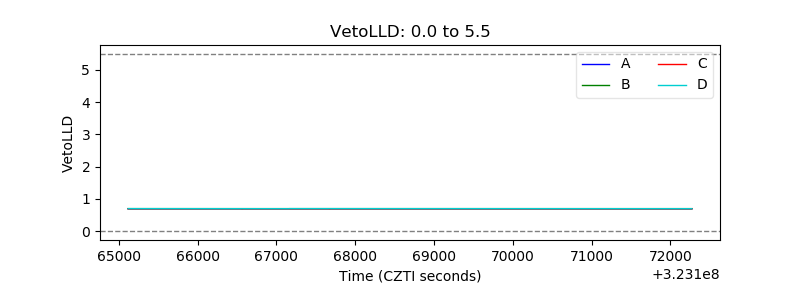 |
| Alpha Counter |  |
| _CPM_Rate | 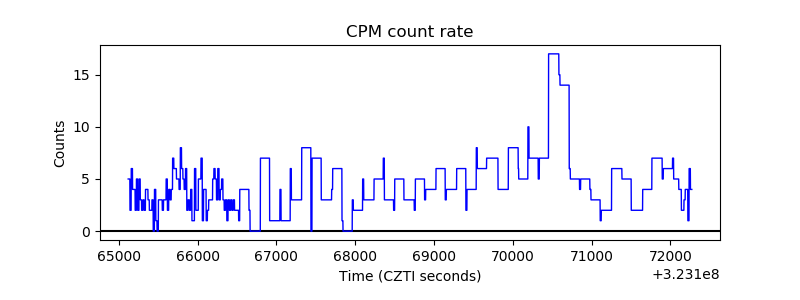 |
| CZT Counter |  |
| +2.5 Volts monitor |  |
| +5 Volts monitor |  |
| _ROLL_ROT | 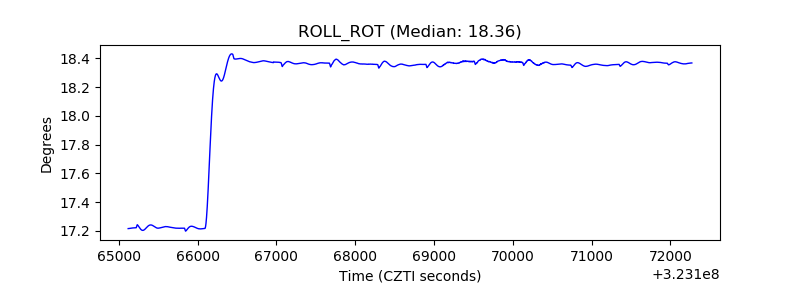 |
| _Roll_DEC | 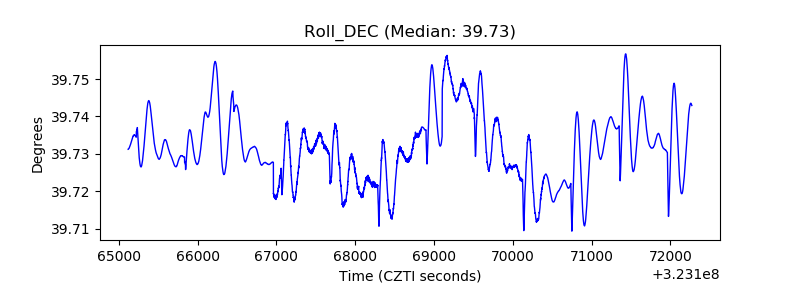 |
| _Roll_RA |  |
| Veto Counter | 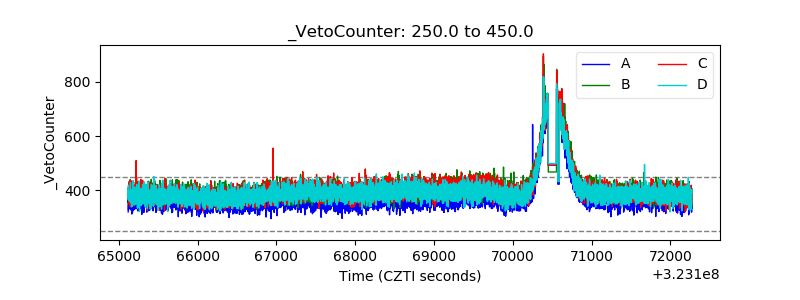 |