| Param | Original file | Final file |
|---|---|---|
| Filename | modeM0/AS1A07_145T01_9000003594_24340cztM0_level2.evt | modeM0/AS1A07_145T01_9000003594_24340cztM0_level2_quad_clean.evt |
| Size (bytes) | 1,656,987,840 | 219,214,080 |
| Size | 1.5 GB | 209.1 MB |
| Events in quadrant A | 8,810,883 | 1,356,445 |
| Events in quadrant B | 8,989,807 | 1,391,168 |
| Events in quadrant C | 18,873,001 | 1,291,367 |
| Events in quadrant D | 12,244,031 | 1,305,865 |
| Mode M0 | |||
|---|---|---|---|
| Quadrant | BADHDUFLAG | Total packets | Discarded packets |
| A | 0 | 38360 | 3 |
| B | 0 | 38573 | 3 |
| C | 0 | 69819 | 3 |
| D | 0 | 48603 | 3 |
| Mode M9 | |||
|---|---|---|---|
| Quadrant | BADHDUFLAG | Total packets | Discarded packets |
| A | 0 | 16 | 0 |
| B | 0 | 16 | 0 |
| C | 0 | 16 | 0 |
| D | 0 | 16 | 0 |
| Mode SS | |||
|---|---|---|---|
| Quadrant | BADHDUFLAG | Total packets | Discarded packets |
| A | 0 | 382 | 0 |
| B | 0 | 382 | 0 |
| C | 0 | 382 | 0 |
| D | 0 | 382 | 0 |
| Quadrant | Total seconds | Saturated seconds | Saturation percentage |
|---|---|---|---|
| A | 18778 | 247 | 1.315369% |
| B | 18778 | 291 | 1.549686% |
| C | 18778 | 858 | 4.569177% |
| D | 18778 | 881 | 4.691660% |
Noise dominated data is calculated using 1-second bins in cleaned event files. If a bin has >2000 counts, and if more than 50% of those come from <1% of pixels, then it is considered to be noise-dominated and hence unusable.
| Quadrant | # 1 sec bins | Bins with >0 counts | Bins with >2000 counts | High rate bins dominated by noise | Noise dominated (total time) | Noise dominated (detector-on time) | Marked lightcurve |
|---|---|---|---|---|---|---|---|
| A | 20423 | 18779 | 1 | 1 | 0.00% | 0.01% | 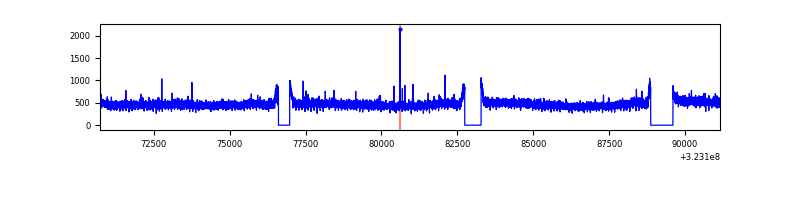 |
| B | 20423 | 18779 | 1 | 1 | 0.00% | 0.01% | 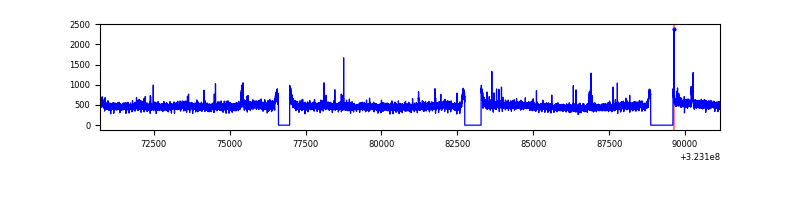 |
| C | 20423 | 18779 | 16 | 16 | 0.08% | 0.09% | 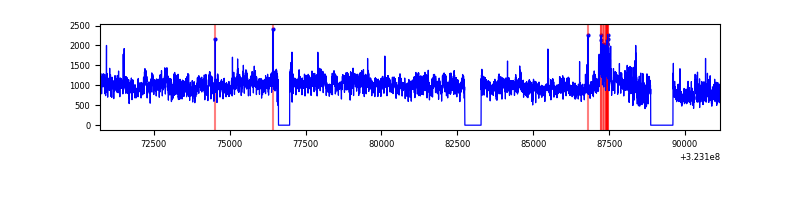 |
| D | 20422 | 18778 | 682 | 682 | 3.34% | 3.63% | 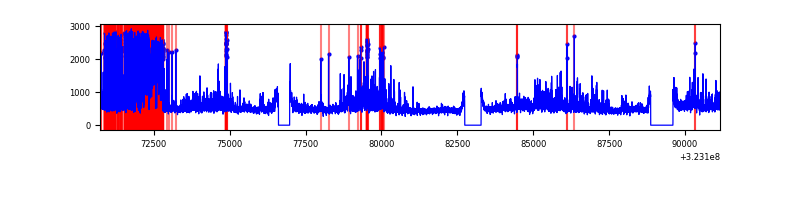 |
Top three noisy pixels from each quadrant. If the there are fewer than three noisy pixels in the level2.evt file, extra rows are filled as -1
| Pixel properties | Quadrant properties | ||||||
|---|---|---|---|---|---|---|---|
| Quadrant | DetID | PixID | Counts | Sigma | Mean | Median | Sigma |
| A | 13 | 254 | 27486 | 55.04 | 2280 | 2226 | 459.0 |
| A | 3 | 137 | 21179 | 41.3 | 2280 | 2226 | 459.0 |
| A | 0 | 226 | 19256 | 37.11 | 2280 | 2226 | 459.0 |
| B | 0 | 230 | 61071 | 134.68 | 2270 | 2210 | 437.0 |
| B | 12 | 111 | 54565 | 119.79 | 2270 | 2210 | 437.0 |
| B | 11 | 111 | 48876 | 106.78 | 2270 | 2210 | 437.0 |
| C | 7 | 247 | 9772424 | 19457.64 | 2162 | 2172 | 502.1 |
| C | 14 | 238 | 339046 | 670.89 | 2162 | 2172 | 502.1 |
| C | 2 | 16 | 268174 | 529.75 | 2162 | 2172 | 502.1 |
| D | 7 | 238 | 2156675 | 4000.22 | 2197 | 2129 | 538.6 |
| D | 8 | 195 | 1185744 | 2197.55 | 2197 | 2129 | 538.6 |
| D | 12 | 218 | 347434 | 641.11 | 2197 | 2129 | 538.6 |
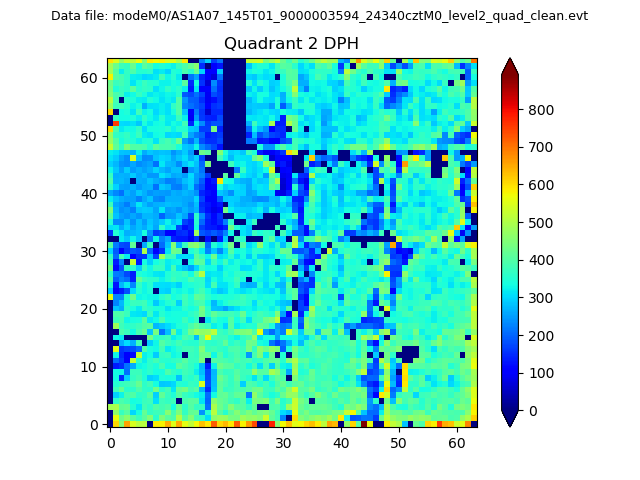
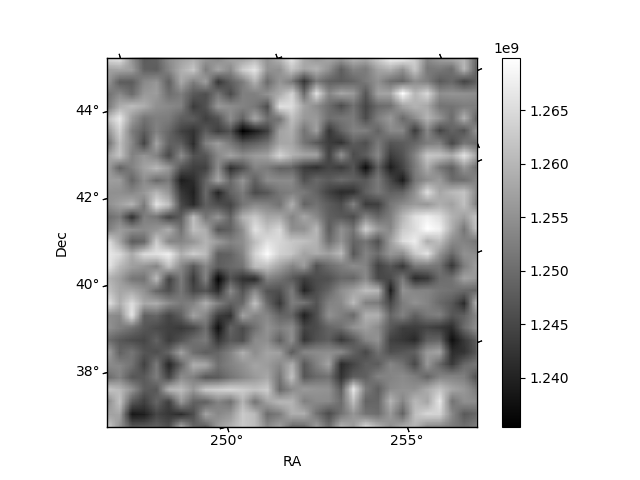
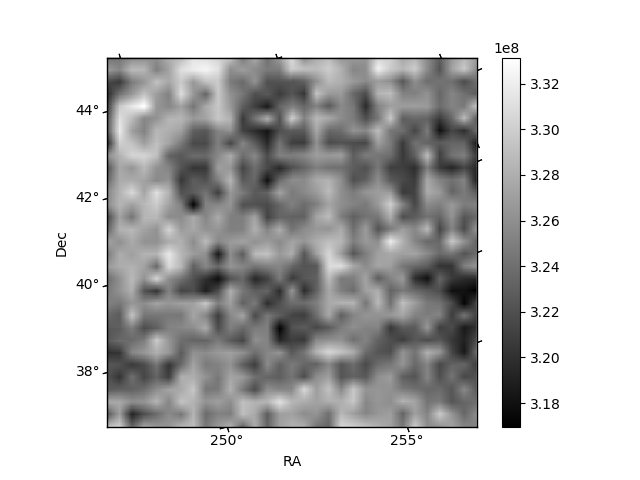
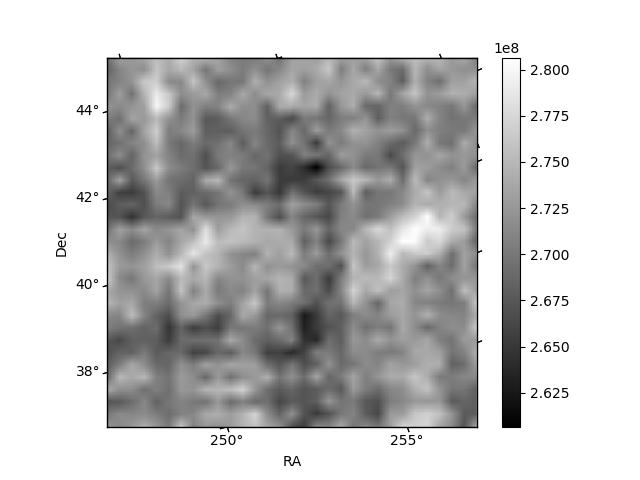
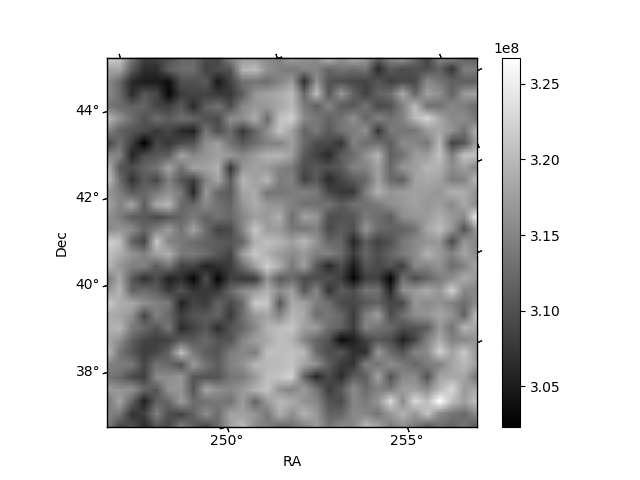
Histogram calculated using DETX and DETY for each event in the final _common_clean file
| Quadrant A | 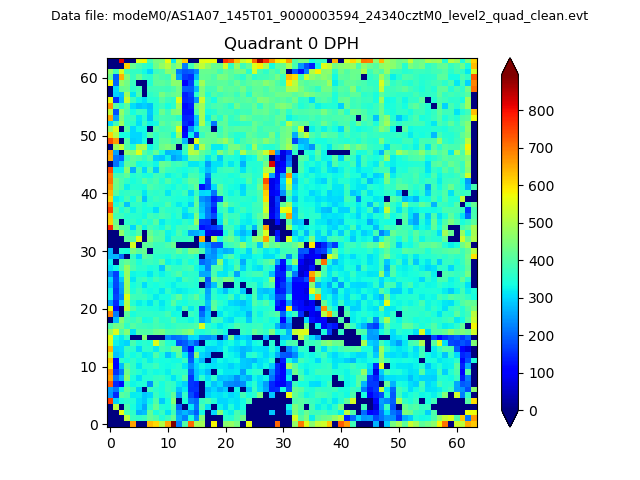 |
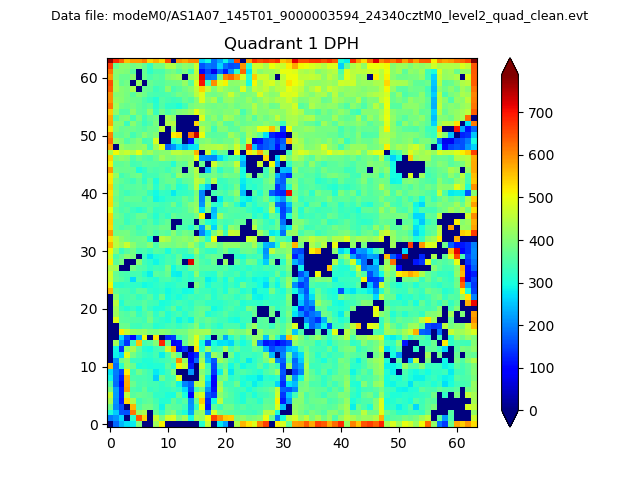 |
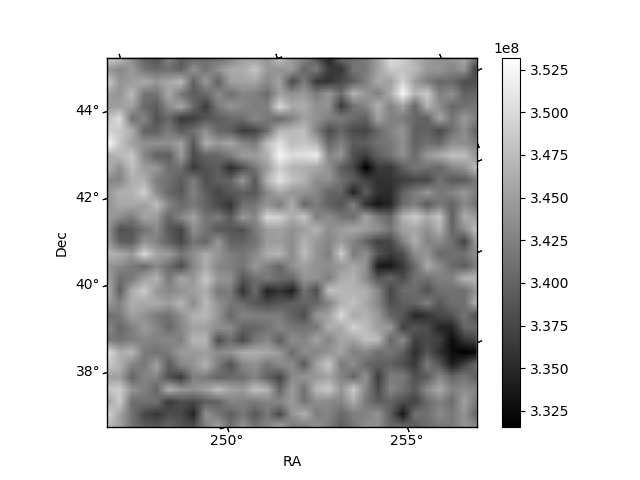
Quadrant B |
|---|---|---|---|
| Quadrant D | 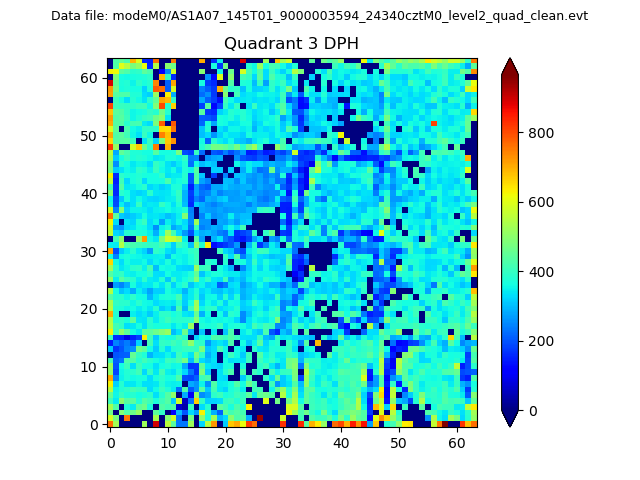 |
 |
Quadrant C |
| Plot type | Count rate plots | Images |
|---|---|---|
| Comparison with Poisson distribution Blue bars denote a histogram of data divided into 1 sec bins. Red curve is a Poisson curve with rate = median count rate of data. |
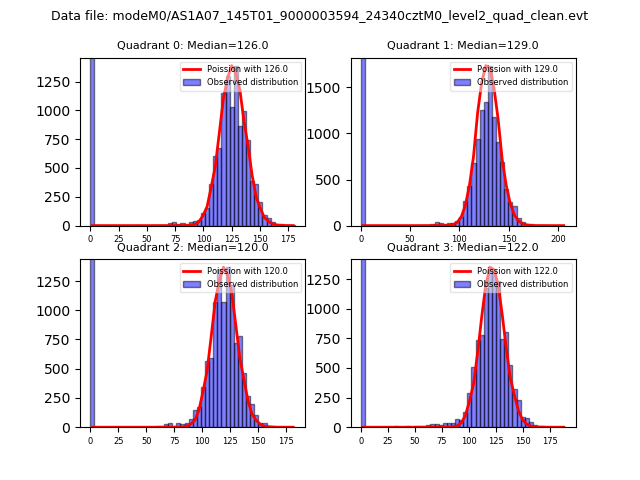 |
 |
| Quadrant-wise count rates Data is divided into 100 sec bins |
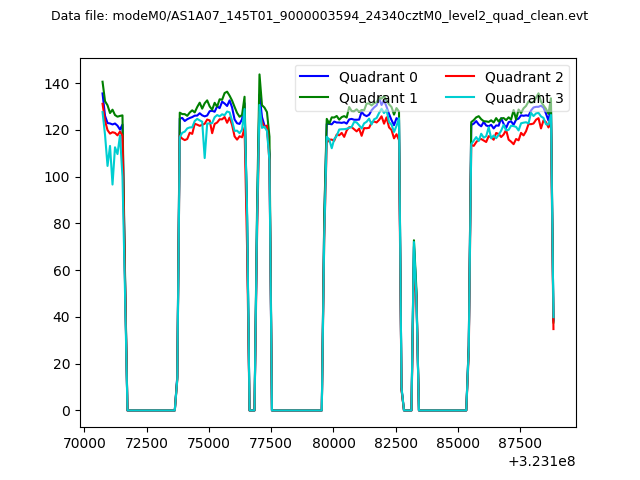 |
|
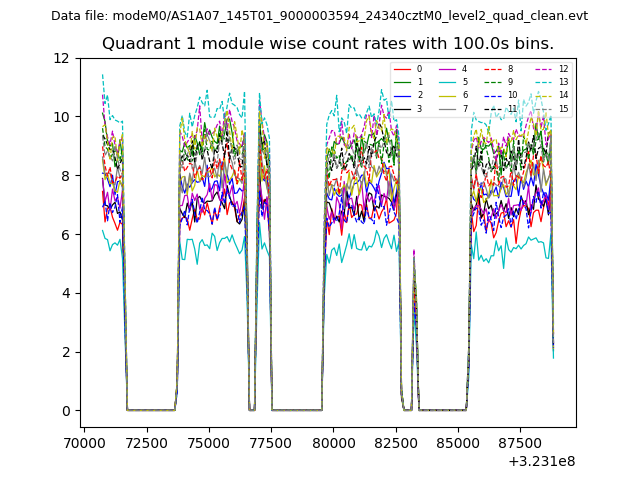
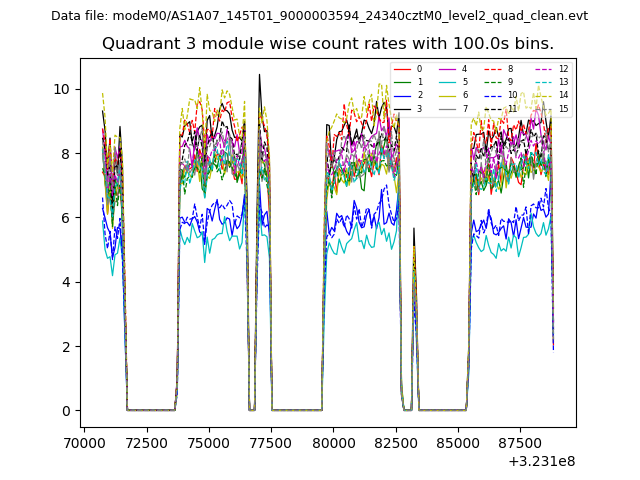
| Module-wise count rates for Quadrant A Data is divided into 100 sec bins |
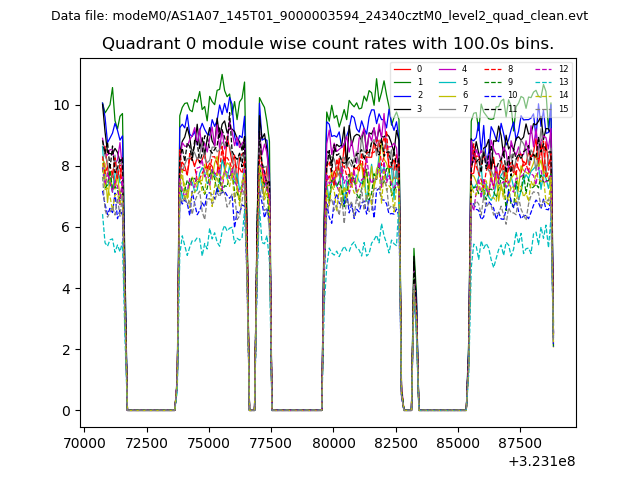 |
 |
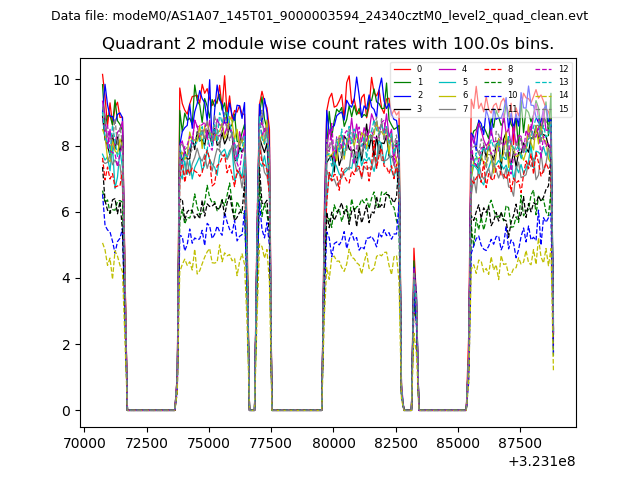
| Module-wise count rates for Quadrant B Data is divided into 100 sec bins |
 |
 |
| Module-wise count rates for Quadrant C Data is divided into 100 sec bins |
 |
 |
| Module-wise count rates for Quadrant D Data is divided into 100 sec bins |
 |
 |
| Parameter | Plot |
|---|---|
| CZT HV Monitor | 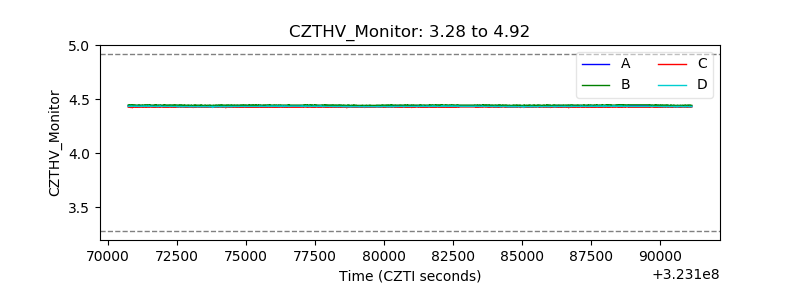 |
| D_VDD | 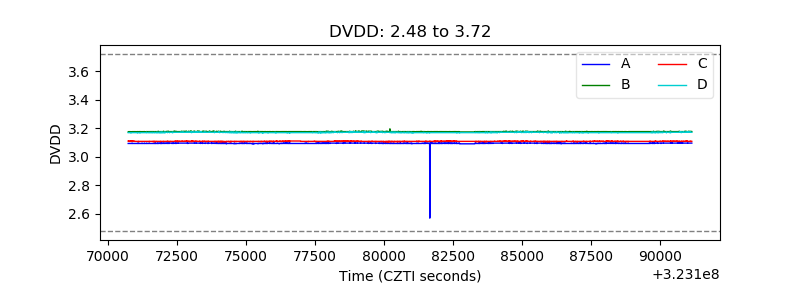 |
| Temperature 1 | 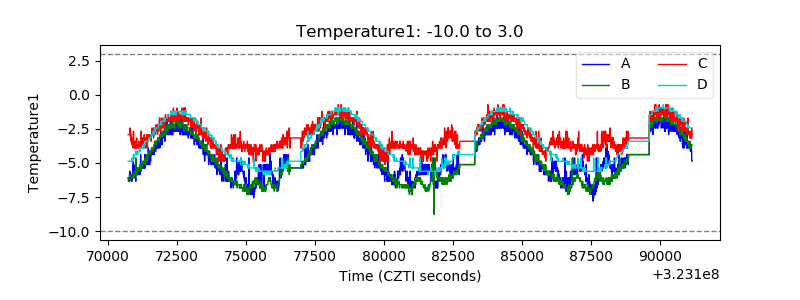 |
| Veto HV Monitor | 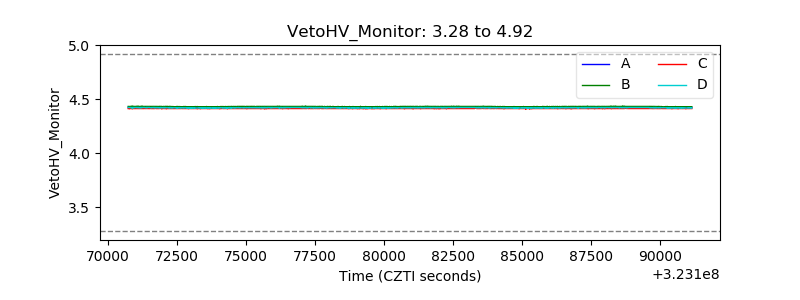 |
| Veto LLD | 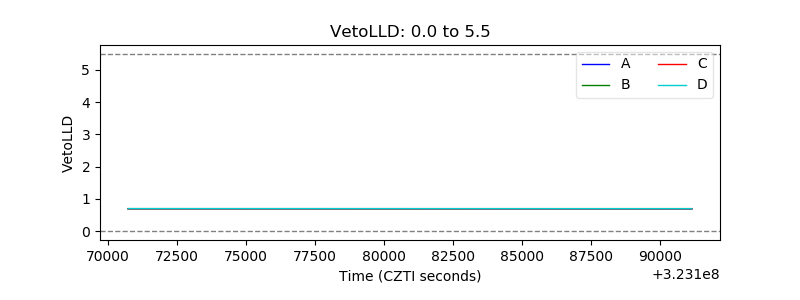 |
| Alpha Counter | 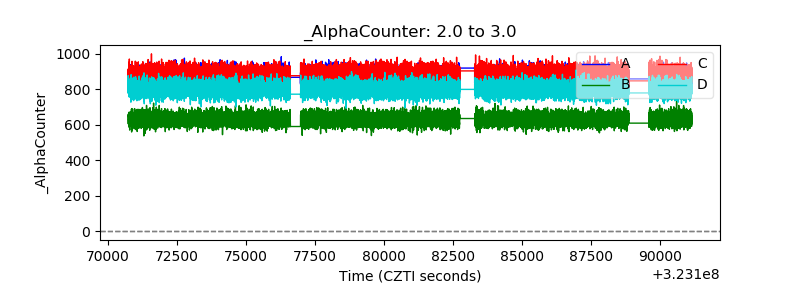 |
| _CPM_Rate | 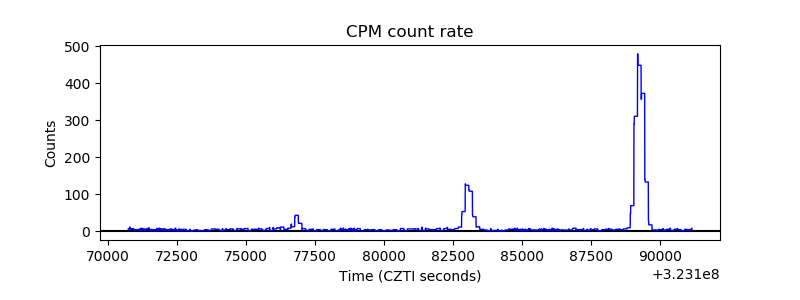 |
| CZT Counter | 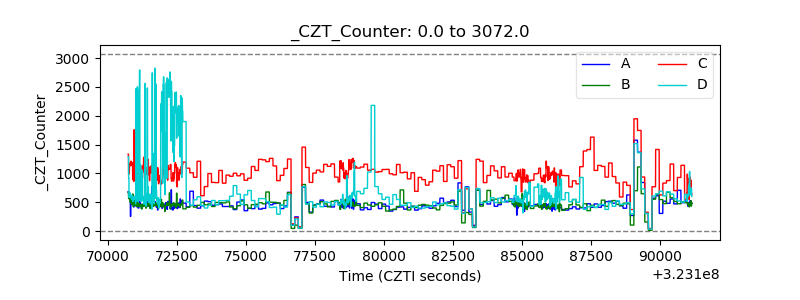 |
| +2.5 Volts monitor |  |
| +5 Volts monitor |  |
| _ROLL_ROT | 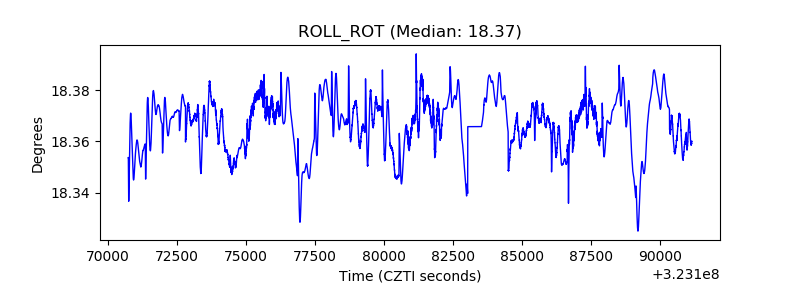 |
| _Roll_DEC | 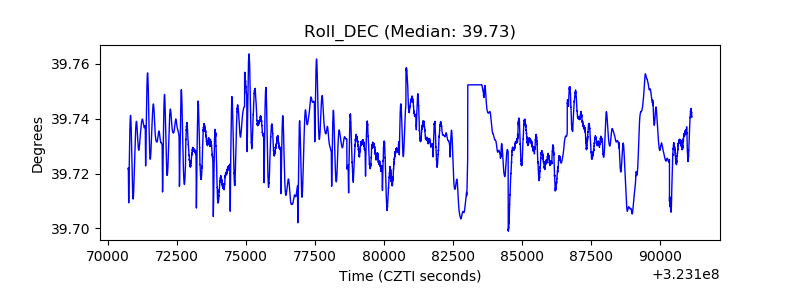 |
| _Roll_RA | 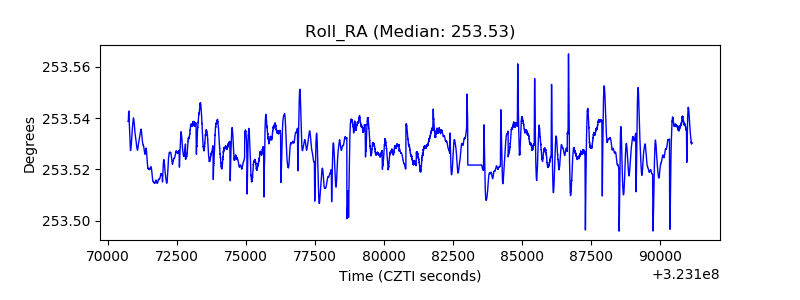 |
| Veto Counter | 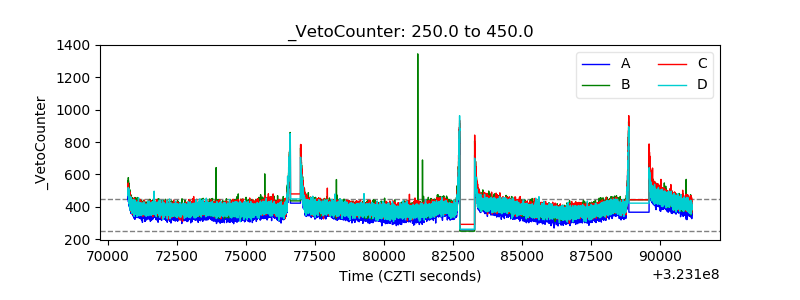 |