| Param | Original file | Final file |
|---|---|---|
| Filename | modeM0/AS1A07_145T01_9000003594_24341cztM0_level2.evt | modeM0/AS1A07_145T01_9000003594_24341cztM0_level2_quad_clean.evt |
| Size (bytes) | 566,245,440 | 80,605,440 |
| Size | 540.0 MB | 76.9 MB |
| Events in quadrant A | 3,427,706 | 495,058 |
| Events in quadrant B | 3,485,943 | 504,550 |
| Events in quadrant C | 4,838,575 | 483,103 |
| Events in quadrant D | 4,922,595 | 470,716 |
| Mode M0 | |||
|---|---|---|---|
| Quadrant | BADHDUFLAG | Total packets | Discarded packets |
| A | 0 | 14672 | 2 |
| B | 0 | 14806 | 2 |
| C | 0 | 19145 | 2 |
| D | 0 | 19449 | 2 |
| Mode M9 | |||
|---|---|---|---|
| Quadrant | BADHDUFLAG | Total packets | Discarded packets |
| A | 0 | 17 | 0 |
| B | 0 | 17 | 0 |
| C | 0 | 17 | 0 |
| D | 0 | 17 | 0 |
| Mode SS | |||
|---|---|---|---|
| Quadrant | BADHDUFLAG | Total packets | Discarded packets |
| A | 0 | 142 | 0 |
| B | 0 | 142 | 0 |
| C | 0 | 142 | 0 |
| D | 0 | 142 | 0 |
| Quadrant | Total seconds | Saturated seconds | Saturation percentage |
|---|---|---|---|
| A | 7001 | 97 | 1.385516% |
| B | 7001 | 113 | 1.614055% |
| C | 7002 | 215 | 3.070551% |
| D | 7002 | 239 | 3.413310% |
Noise dominated data is calculated using 1-second bins in cleaned event files. If a bin has >2000 counts, and if more than 50% of those come from <1% of pixels, then it is considered to be noise-dominated and hence unusable.
| Quadrant | # 1 sec bins | Bins with >0 counts | Bins with >2000 counts | High rate bins dominated by noise | Noise dominated (total time) | Noise dominated (detector-on time) | Marked lightcurve |
|---|---|---|---|---|---|---|---|
| A | 8641 | 7003 | 1 | 1 | 0.01% | 0.01% | 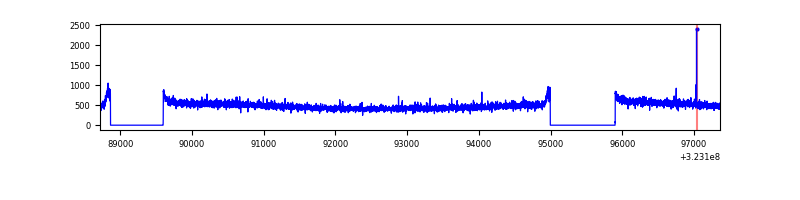 |
| B | 8641 | 7003 | 1 | 1 | 0.01% | 0.01% | 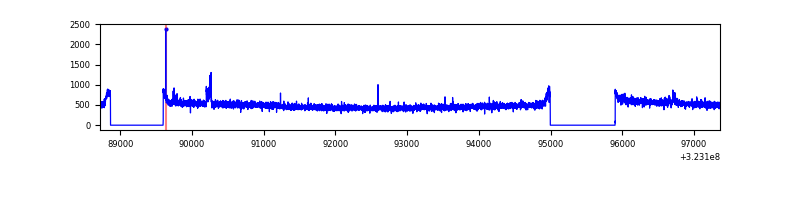 |
| C | 8642 | 7004 | 0 | 0 | 0.00% | 0.00% | 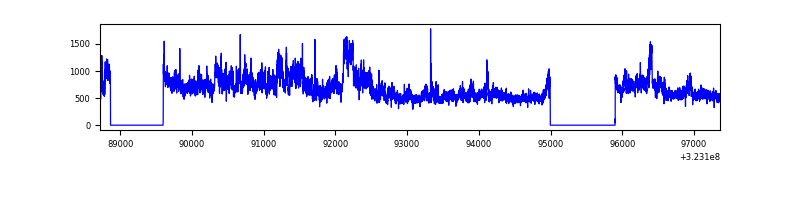 |
| D | 8642 | 7004 | 88 | 88 | 1.02% | 1.26% | 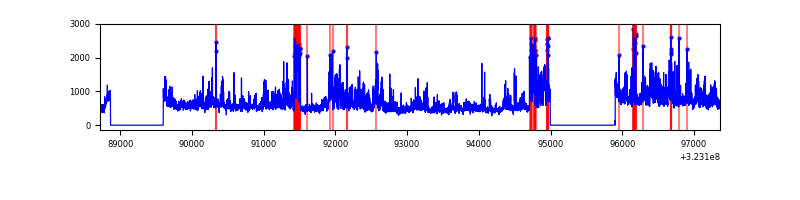 |
Top three noisy pixels from each quadrant. If the there are fewer than three noisy pixels in the level2.evt file, extra rows are filled as -1
| Pixel properties | Quadrant properties | ||||||
|---|---|---|---|---|---|---|---|
| Quadrant | DetID | PixID | Counts | Sigma | Mean | Median | Sigma |
| A | 13 | 254 | 10325 | 52.7 | 886 | 865 | 179.5 |
| A | 3 | 137 | 8142 | 40.54 | 886 | 865 | 179.5 |
| A | 0 | 226 | 7836 | 38.83 | 886 | 865 | 179.5 |
| B | 0 | 190 | 36850 | 213.88 | 880 | 857 | 168.3 |
| B | 12 | 111 | 20513 | 116.8 | 880 | 857 | 168.3 |
| B | 11 | 111 | 18413 | 104.32 | 880 | 857 | 168.3 |
| C | 7 | 247 | 1338197 | 6778.53 | 848 | 853 | 197.3 |
| C | 14 | 238 | 132657 | 668.07 | 848 | 853 | 197.3 |
| C | 2 | 16 | 49749 | 247.84 | 848 | 853 | 197.3 |
| D | 8 | 195 | 819130 | 3899.34 | 858 | 831 | 209.9 |
| D | 7 | 238 | 427765 | 2034.42 | 858 | 831 | 209.9 |
| D | 1 | 52 | 340289 | 1617.58 | 858 | 831 | 209.9 |
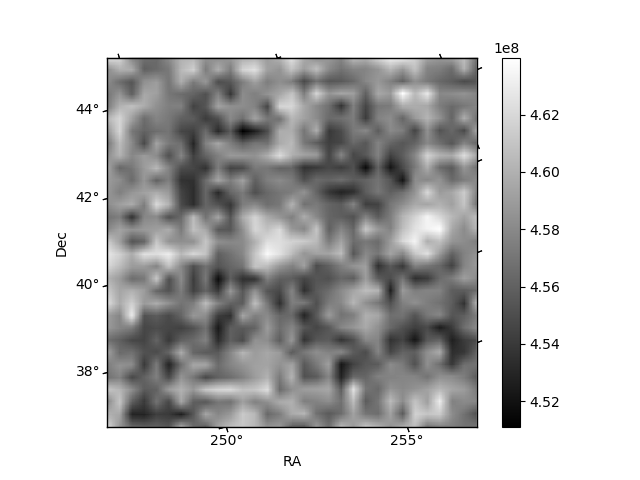
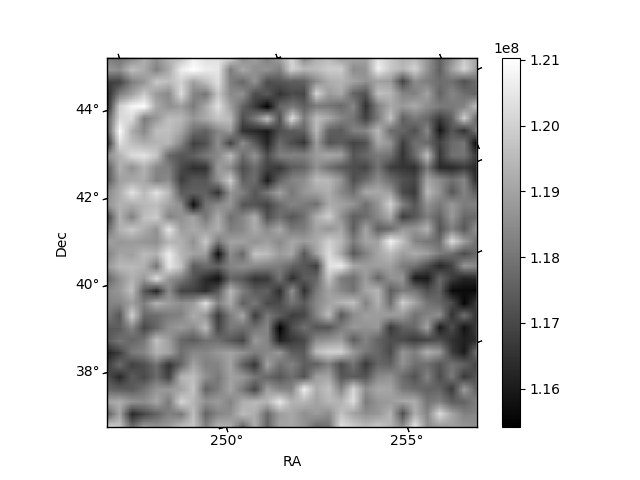
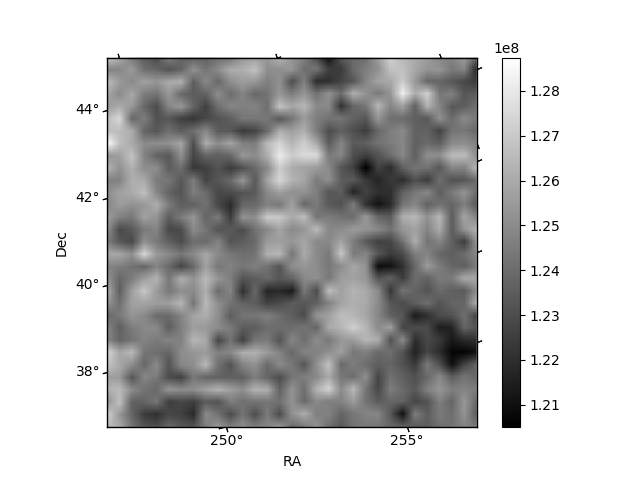
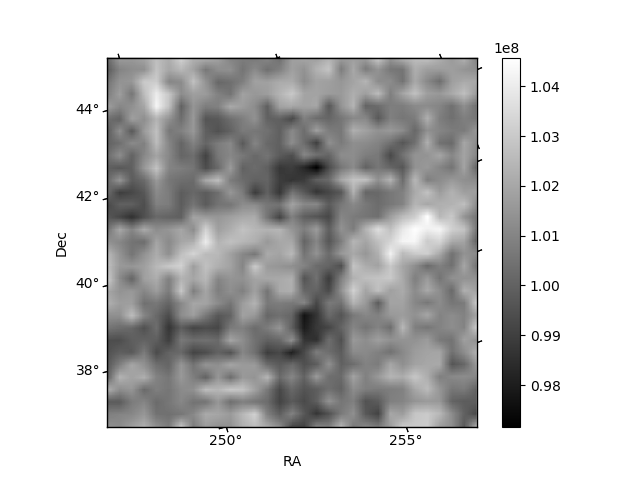
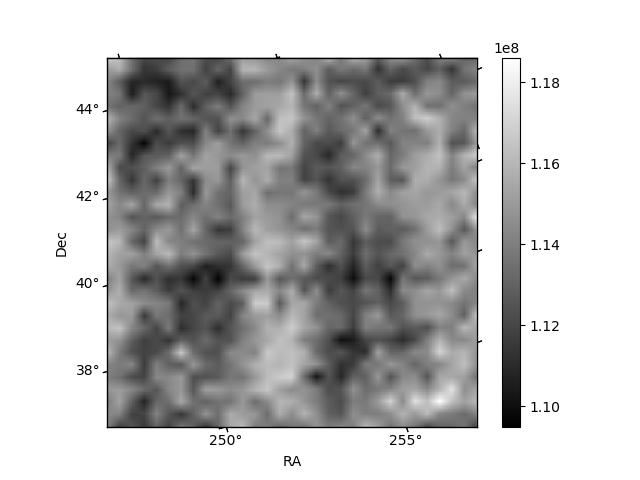
Histogram calculated using DETX and DETY for each event in the final _common_clean file
| Quadrant A | 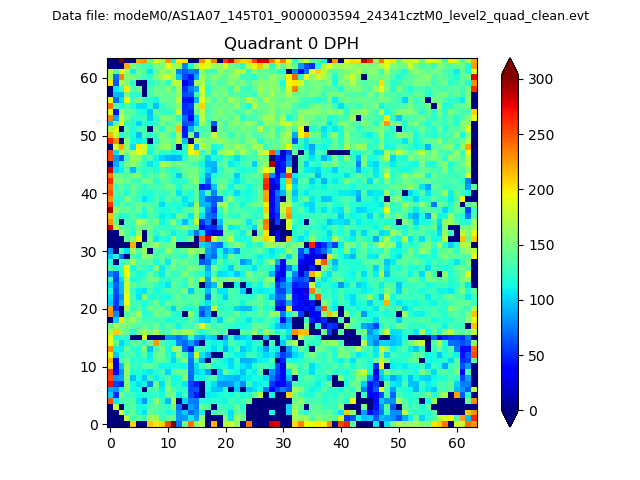 |
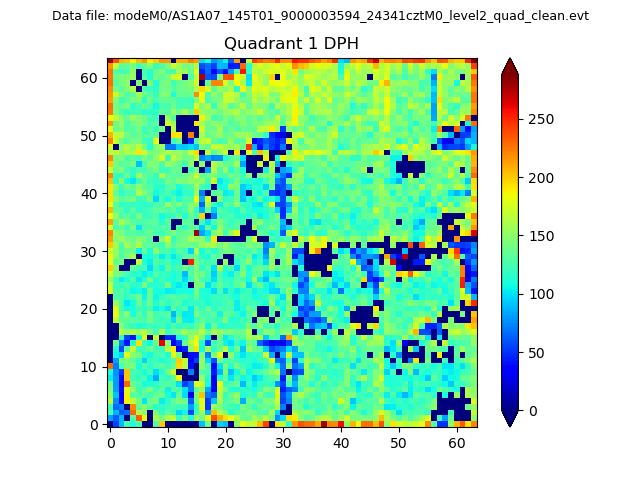 |
Quadrant B |
|---|---|---|---|
| Quadrant D | 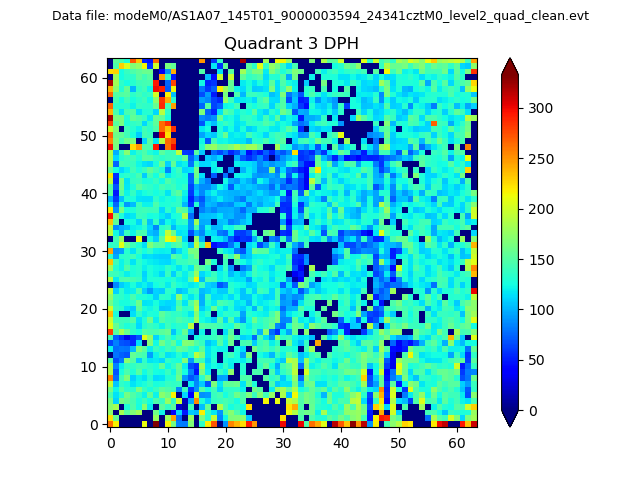 |
 |
Quadrant C |
| Plot type | Count rate plots | Images |
|---|---|---|
| Comparison with Poisson distribution Blue bars denote a histogram of data divided into 1 sec bins. Red curve is a Poisson curve with rate = median count rate of data. |
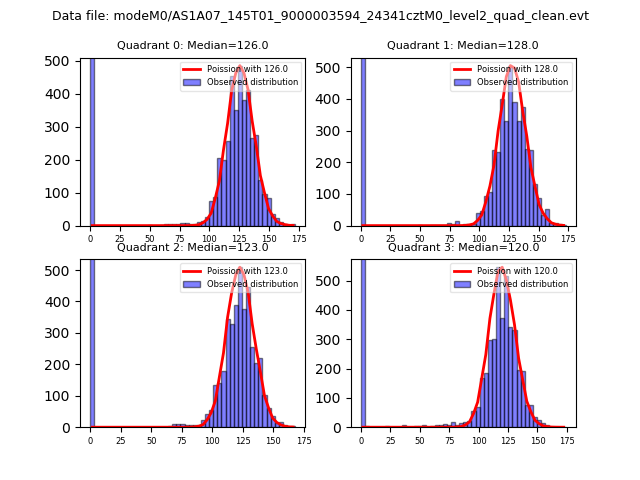 |
 |
| Quadrant-wise count rates Data is divided into 100 sec bins |
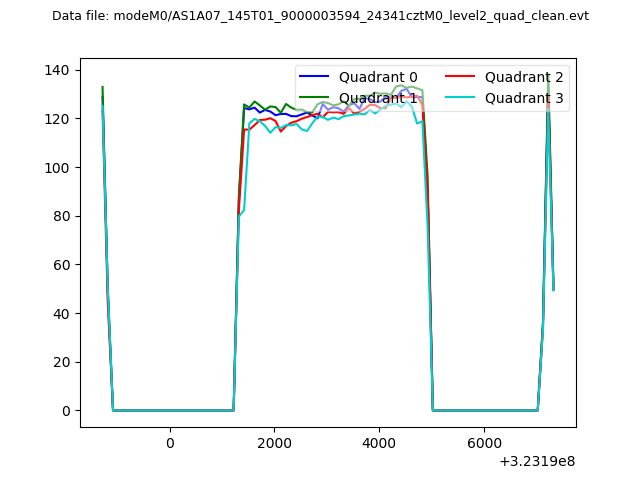 |
|
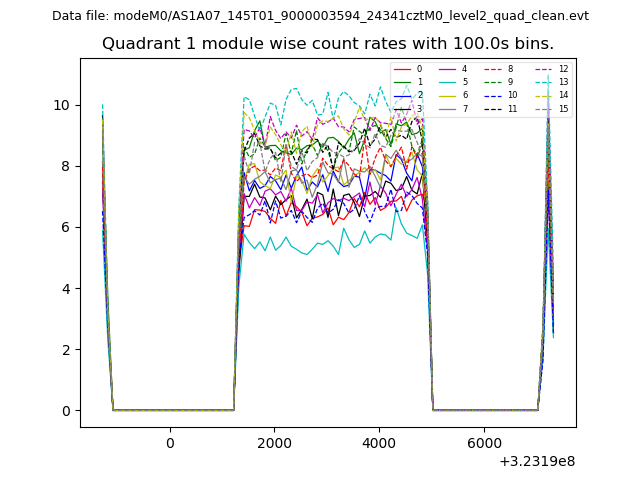
| Module-wise count rates for Quadrant A Data is divided into 100 sec bins |
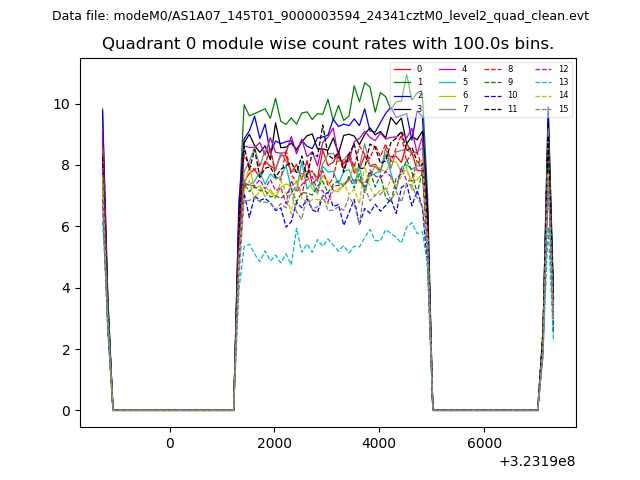 |
 |
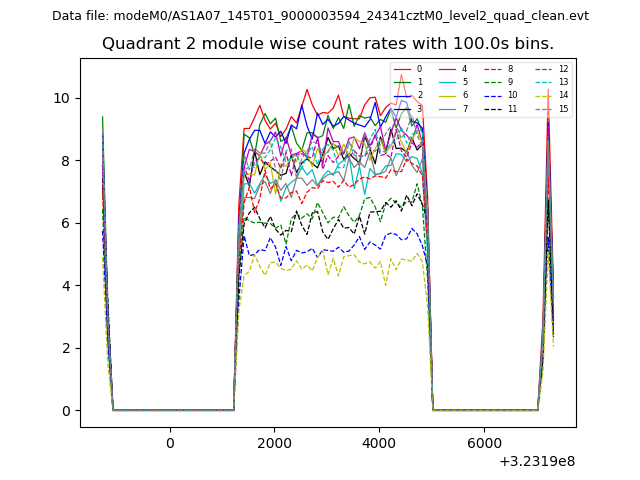
| Module-wise count rates for Quadrant B Data is divided into 100 sec bins |
 |
 |
| Module-wise count rates for Quadrant C Data is divided into 100 sec bins |
 |
 |
| Module-wise count rates for Quadrant D Data is divided into 100 sec bins |
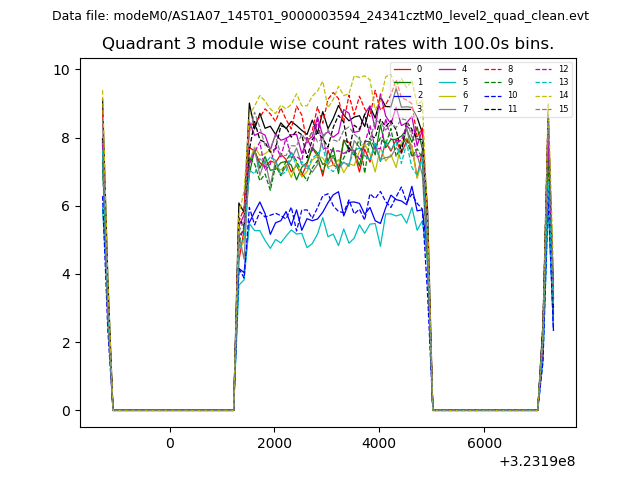 |
 |
| Parameter | Plot |
|---|---|
| CZT HV Monitor | 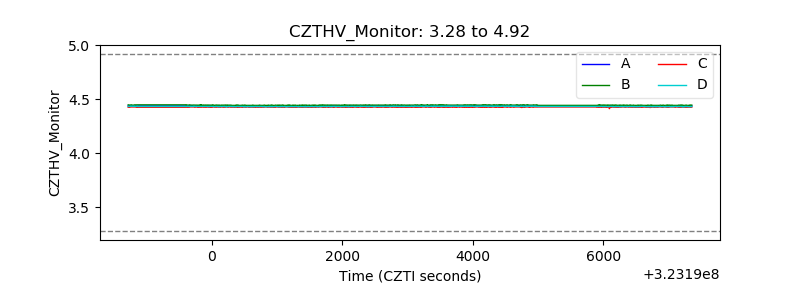 |
| D_VDD | 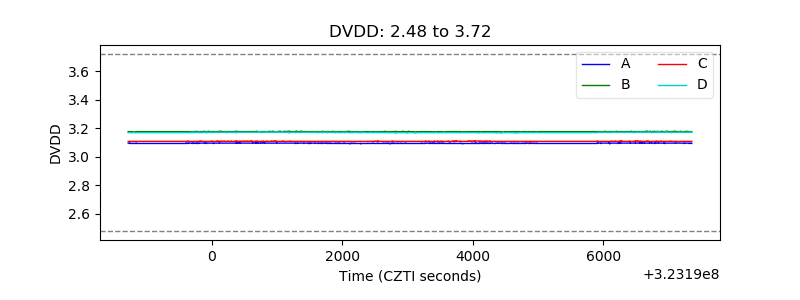 |
| Temperature 1 | 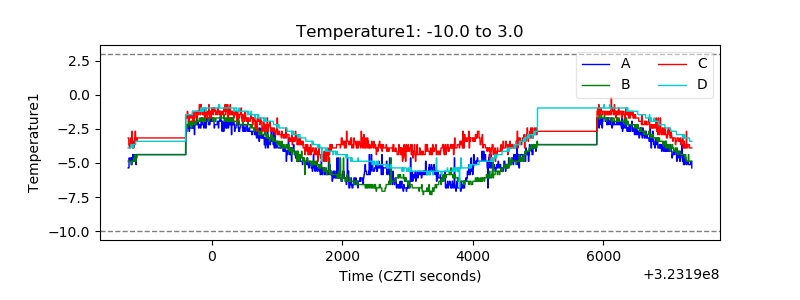 |
| Veto HV Monitor | 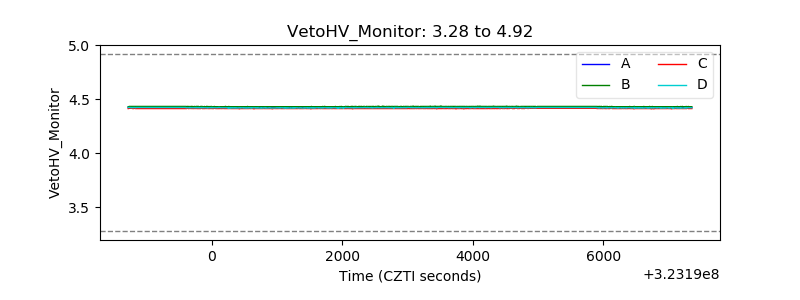 |
| Veto LLD | 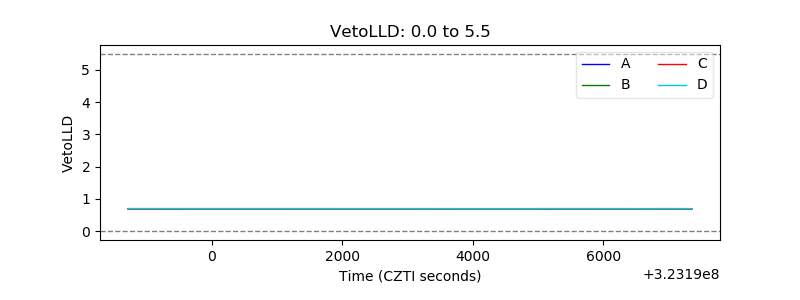 |
| Alpha Counter | 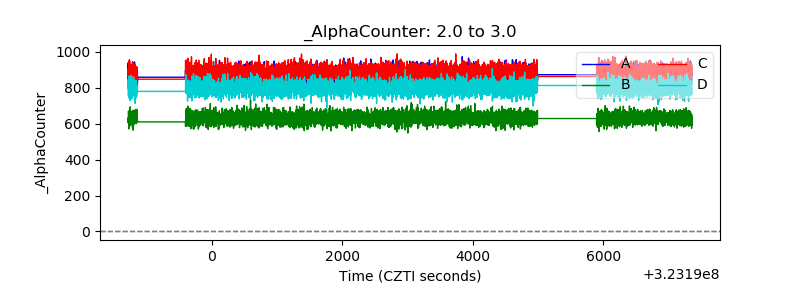 |
| _CPM_Rate | 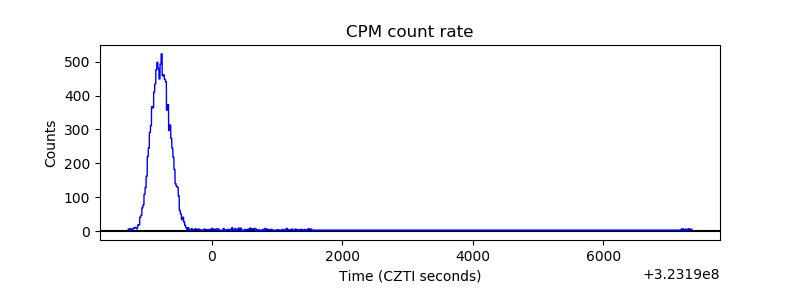 |
| CZT Counter | 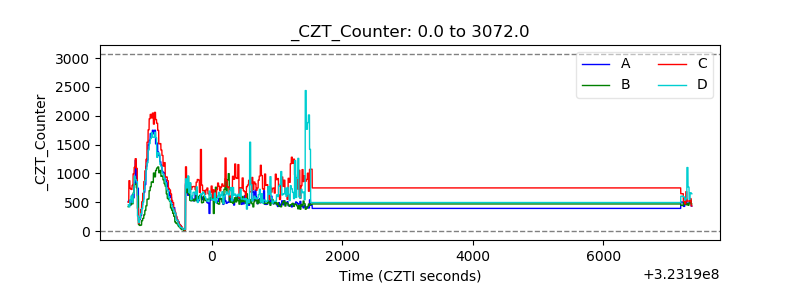 |
| +2.5 Volts monitor |  |
| +5 Volts monitor |  |
| _ROLL_ROT | 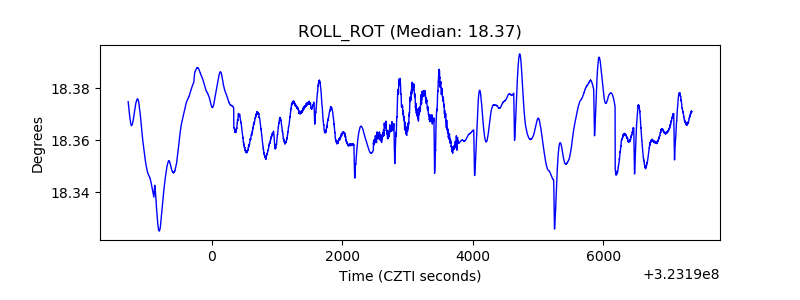 |
| _Roll_DEC | 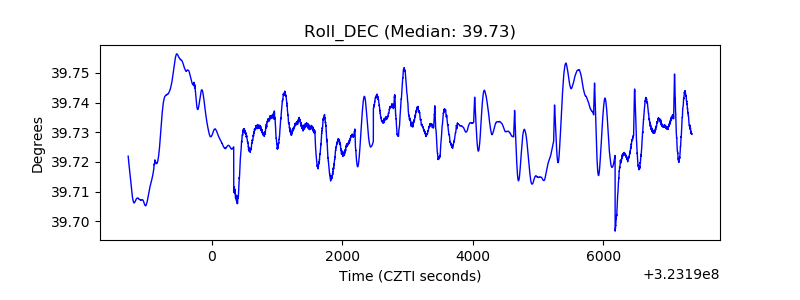 |
| _Roll_RA | 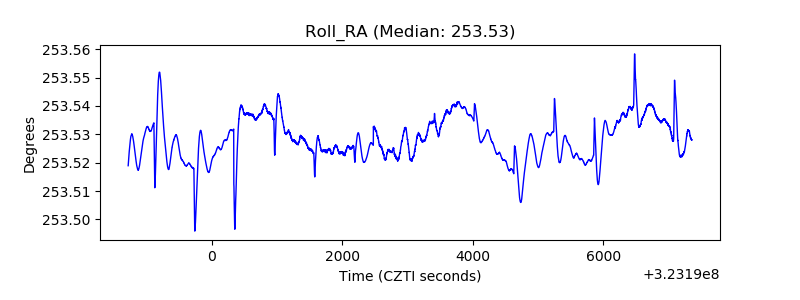 |
| Veto Counter | 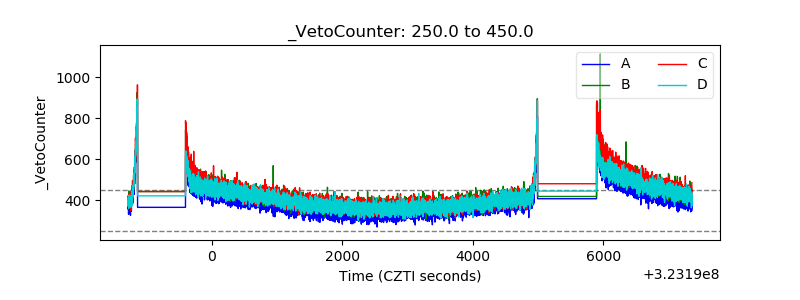 |