| Param | Original file | Final file |
|---|---|---|
| Filename | modeM0/AS1A07_145T01_9000003594_24345cztM0_level2.evt | modeM0/AS1A07_145T01_9000003594_24345cztM0_level2_quad_clean.evt |
| Size (bytes) | 571,271,040 | 110,352,960 |
| Size | 544.8 MB | 105.2 MB |
| Events in quadrant A | 3,146,082 | 731,530 |
| Events in quadrant B | 3,255,017 | 765,302 |
| Events in quadrant C | 4,882,988 | 724,324 |
| Events in quadrant D | 5,599,044 | 689,633 |
| Mode M0 | |||
|---|---|---|---|
| Quadrant | BADHDUFLAG | Total packets | Discarded packets |
| A | 0 | 13348 | 2 |
| B | 0 | 13661 | 3 |
| C | 0 | 19060 | 2 |
| D | 0 | 20999 | 2 |
| Mode M9 | |||
|---|---|---|---|
| Quadrant | BADHDUFLAG | Total packets | Discarded packets |
| A | 0 | 14 | 0 |
| B | 0 | 15 | 0 |
| C | 0 | 15 | 0 |
| D | 0 | 15 | 0 |
| Mode SS | |||
|---|---|---|---|
| Quadrant | BADHDUFLAG | Total packets | Discarded packets |
| A | 0 | 126 | 0 |
| B | 0 | 126 | 0 |
| C | 0 | 126 | 0 |
| D | 0 | 126 | 0 |
| Quadrant | Total seconds | Saturated seconds | Saturation percentage |
|---|---|---|---|
| A | 6178 | 31 | 0.501781% |
| B | 6177 | 38 | 0.615185% |
| C | 6177 | 203 | 3.286385% |
| D | 6177 | 363 | 5.876639% |
Noise dominated data is calculated using 1-second bins in cleaned event files. If a bin has >2000 counts, and if more than 50% of those come from <1% of pixels, then it is considered to be noise-dominated and hence unusable.
| Quadrant | # 1 sec bins | Bins with >0 counts | Bins with >2000 counts | High rate bins dominated by noise | Noise dominated (total time) | Noise dominated (detector-on time) | Marked lightcurve |
|---|---|---|---|---|---|---|---|
| A | 7468 | 6179 | 0 | 0 | 0.00% | 0.00% | 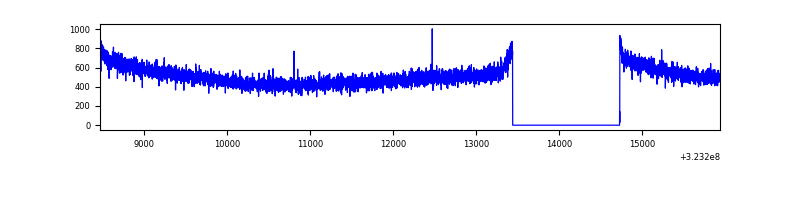 |
| B | 7467 | 6178 | 0 | 0 | 0.00% | 0.00% | 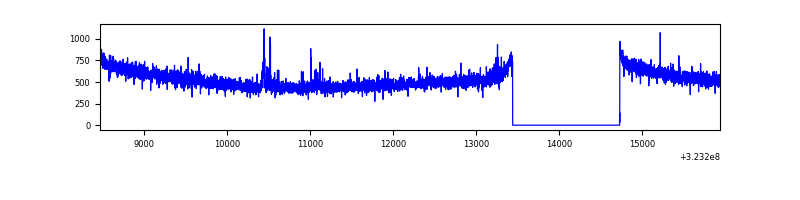 |
| C | 7467 | 6178 | 2 | 2 | 0.03% | 0.03% | 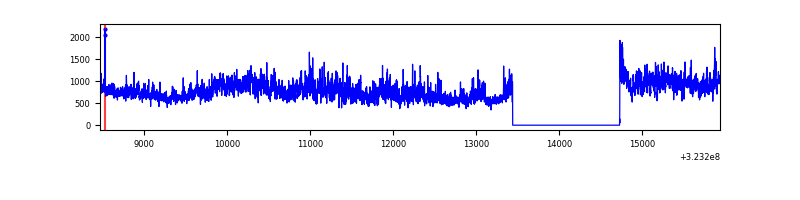 |
| D | 7467 | 6178 | 228 | 228 | 3.05% | 3.69% | 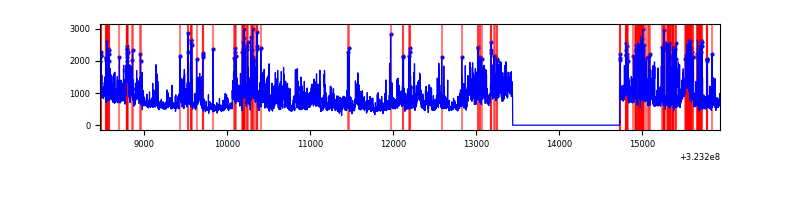 |
Top three noisy pixels from each quadrant. If the there are fewer than three noisy pixels in the level2.evt file, extra rows are filled as -1
| Pixel properties | Quadrant properties | ||||||
|---|---|---|---|---|---|---|---|
| Quadrant | DetID | PixID | Counts | Sigma | Mean | Median | Sigma |
| A | 13 | 254 | 9153 | 51.28 | 816 | 802 | 162.8 |
| A | 3 | 137 | 7027 | 38.23 | 816 | 802 | 162.8 |
| A | 0 | 226 | 6766 | 36.62 | 816 | 802 | 162.8 |
| B | 0 | 230 | 23046 | 144.99 | 826 | 808 | 153.4 |
| B | 12 | 111 | 17984 | 111.99 | 826 | 808 | 153.4 |
| B | 11 | 111 | 16293 | 100.96 | 826 | 808 | 153.4 |
| C | 7 | 247 | 1584667 | 8618.77 | 802 | 809 | 183.8 |
| C | 14 | 238 | 130573 | 706.13 | 802 | 809 | 183.8 |
| C | 2 | 16 | 22333 | 117.13 | 802 | 809 | 183.8 |
| D | 8 | 195 | 1478186 | 7728.52 | 791 | 772 | 191.2 |
| D | 1 | 52 | 815304 | 4260.91 | 791 | 772 | 191.2 |
| D | 7 | 238 | 159372 | 829.65 | 791 | 772 | 191.2 |
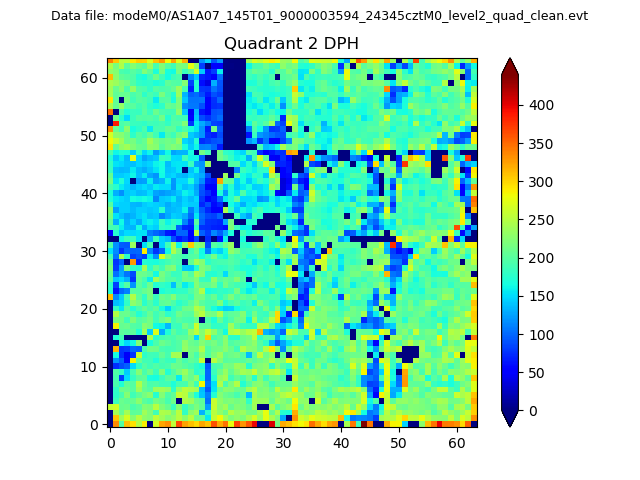
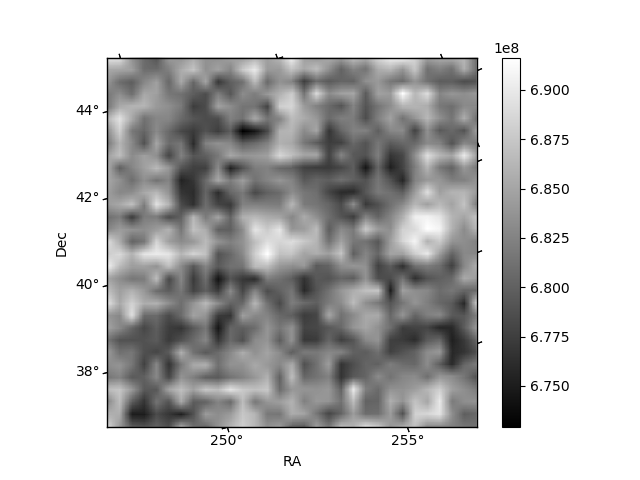
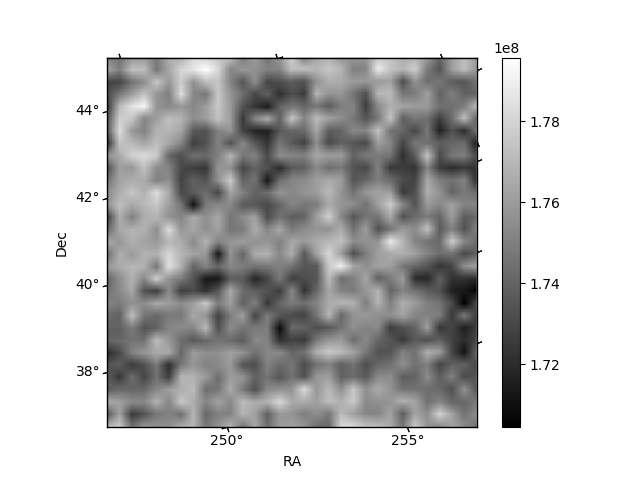
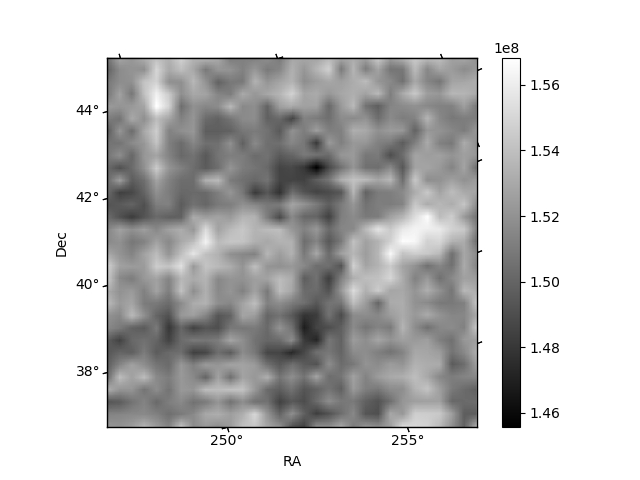
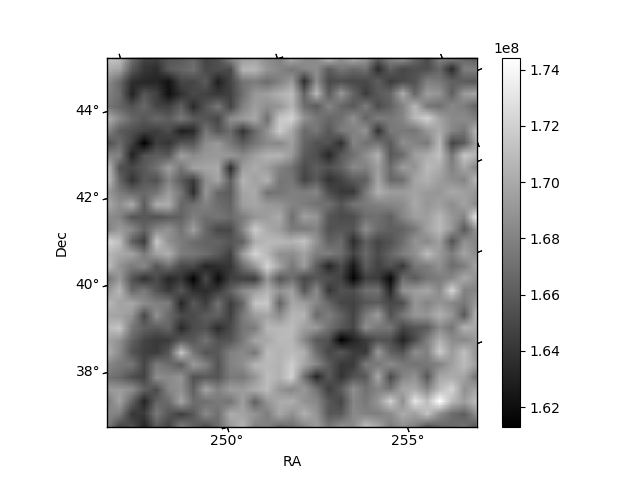
Histogram calculated using DETX and DETY for each event in the final _common_clean file
| Quadrant A | 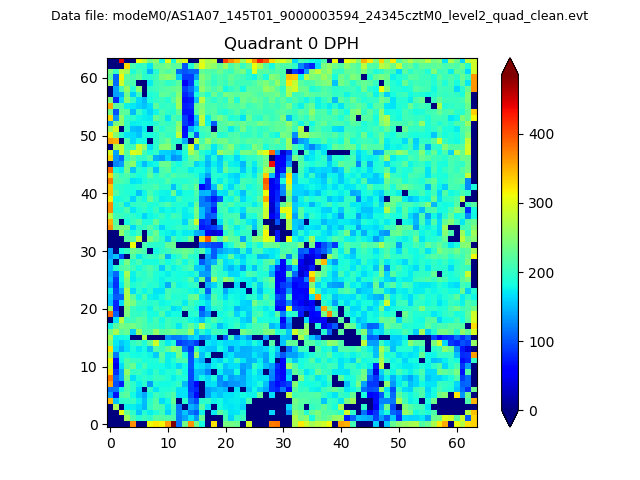 |
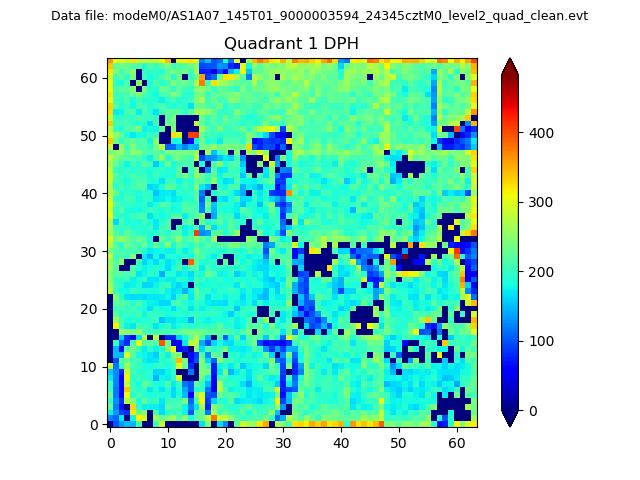 |
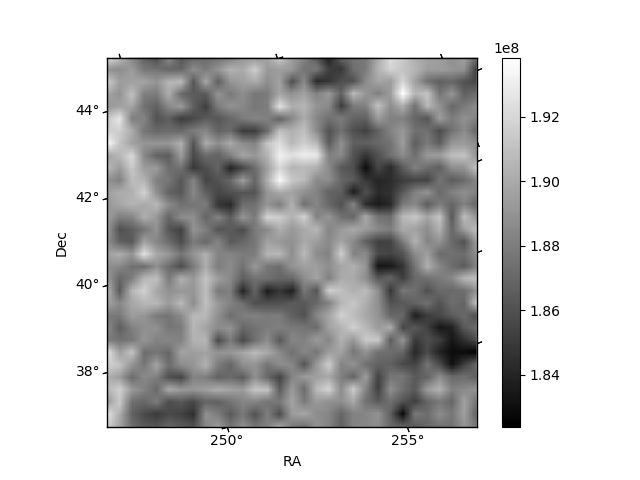
Quadrant B |
|---|---|---|---|
| Quadrant D | 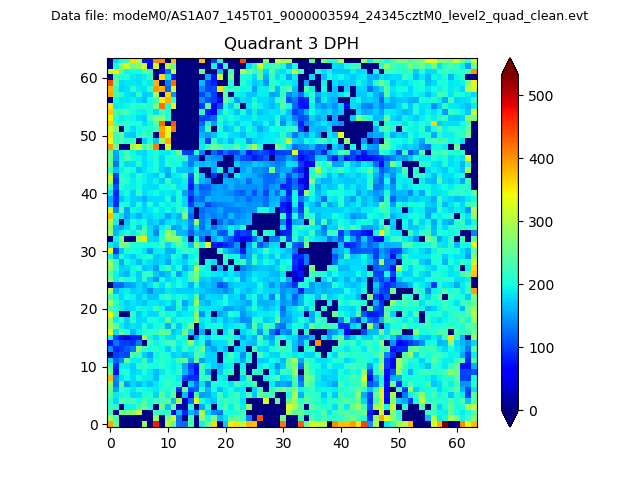 |
 |
Quadrant C |
| Plot type | Count rate plots | Images |
|---|---|---|
| Comparison with Poisson distribution Blue bars denote a histogram of data divided into 1 sec bins. Red curve is a Poisson curve with rate = median count rate of data. |
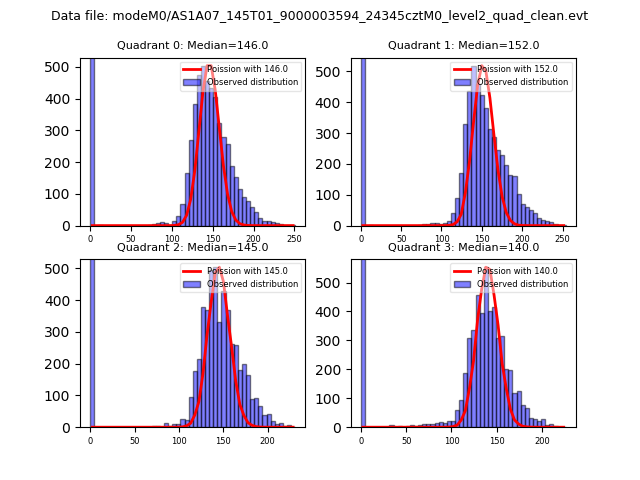 |
 |
| Quadrant-wise count rates Data is divided into 100 sec bins |
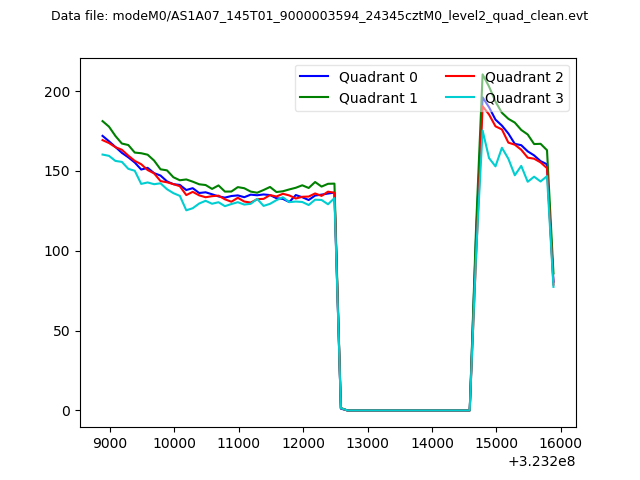 |
|
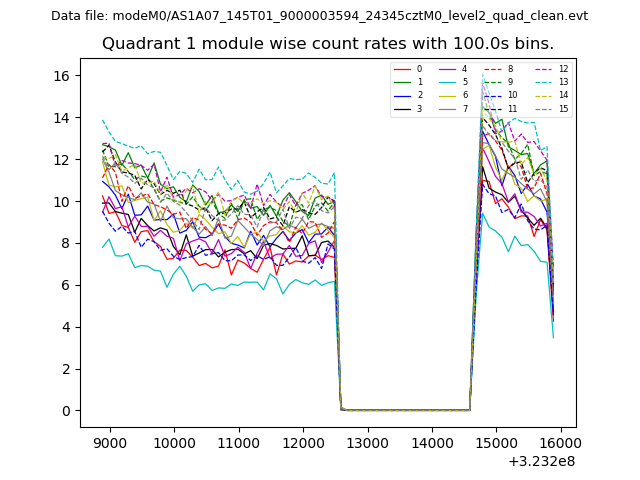
| Module-wise count rates for Quadrant A Data is divided into 100 sec bins |
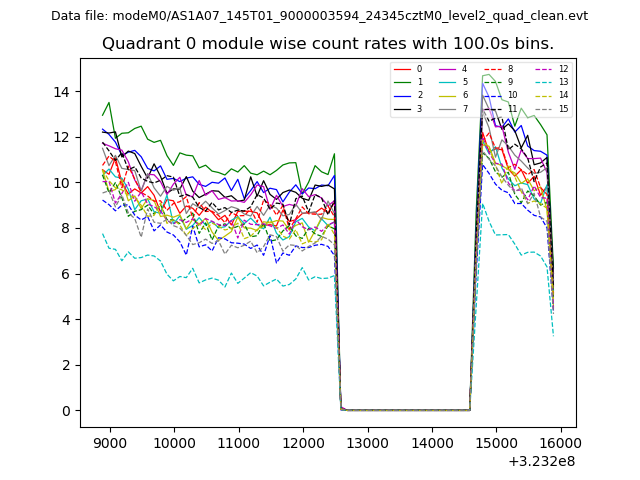 |
 |
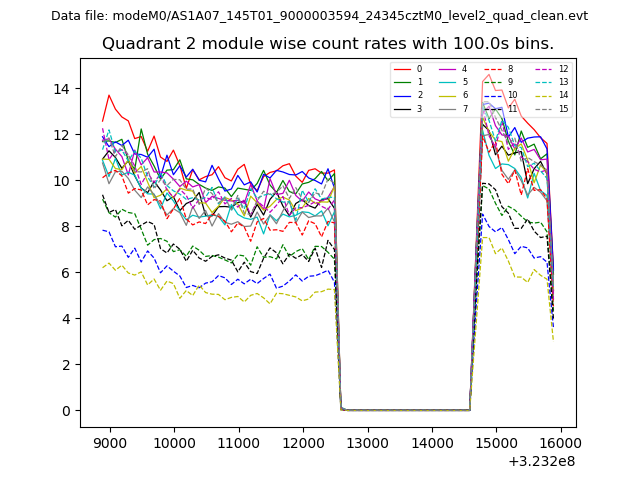
| Module-wise count rates for Quadrant B Data is divided into 100 sec bins |
 |
 |
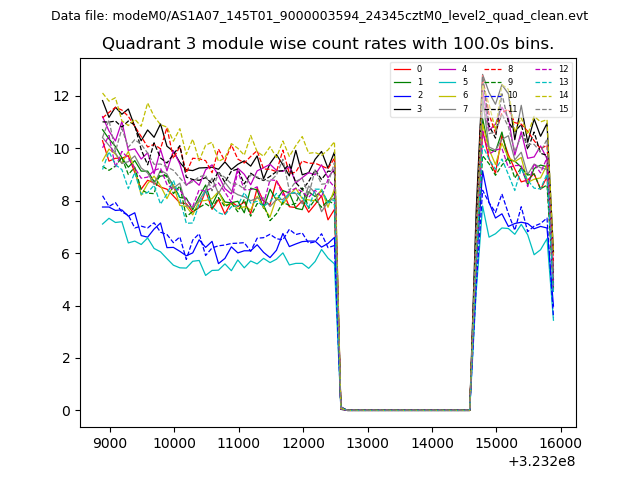
| Module-wise count rates for Quadrant C Data is divided into 100 sec bins |
 |
 |
| Module-wise count rates for Quadrant D Data is divided into 100 sec bins |
 |
 |
| Parameter | Plot |
|---|---|
| CZT HV Monitor | 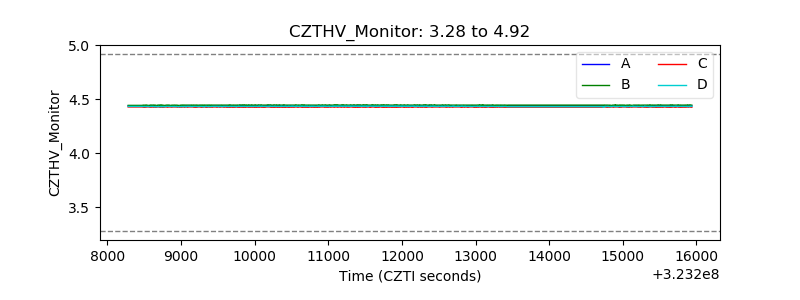 |
| D_VDD | 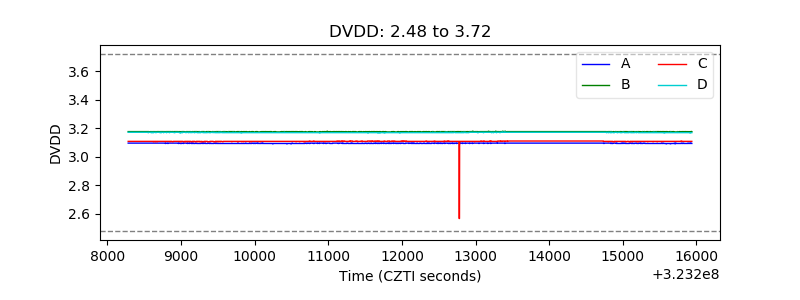 |
| Temperature 1 |  |
| Veto HV Monitor | 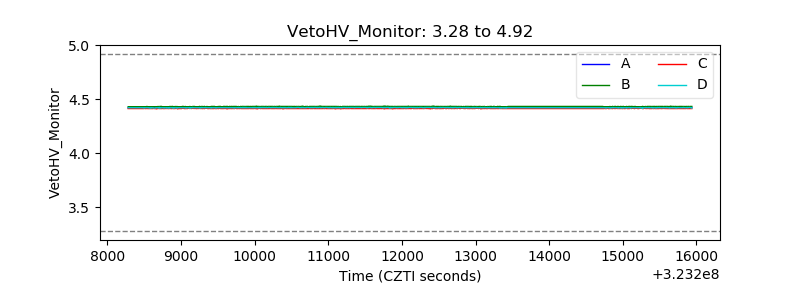 |
| Veto LLD | 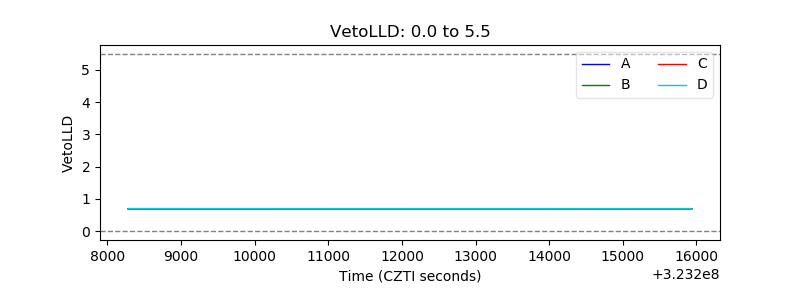 |
| Alpha Counter | 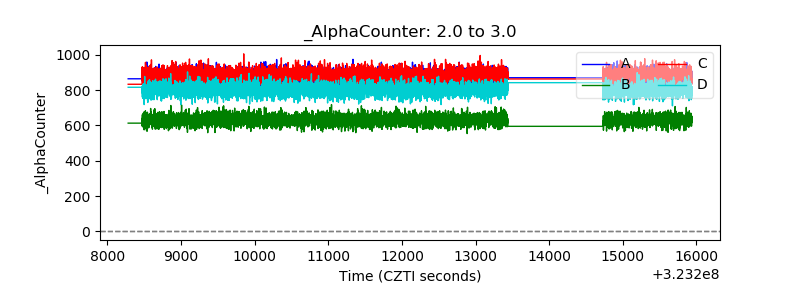 |
| _CPM_Rate | 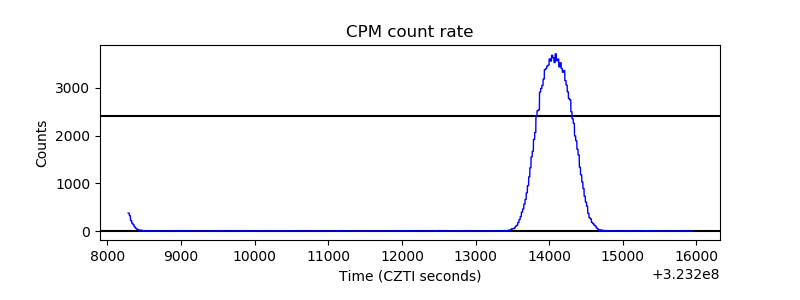 |
| CZT Counter | 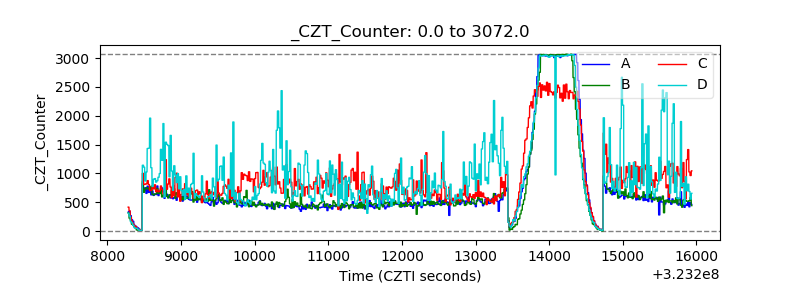 |
| +2.5 Volts monitor |  |
| +5 Volts monitor |  |
| _ROLL_ROT | 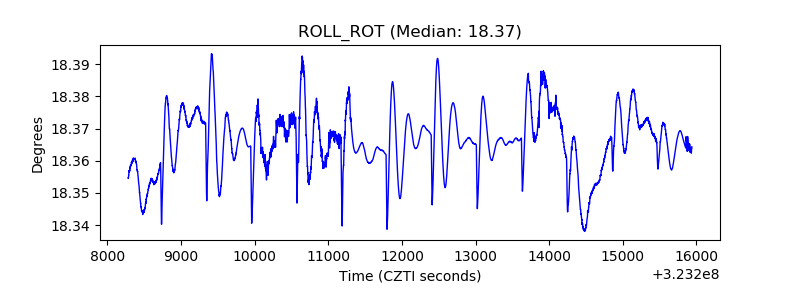 |
| _Roll_DEC | 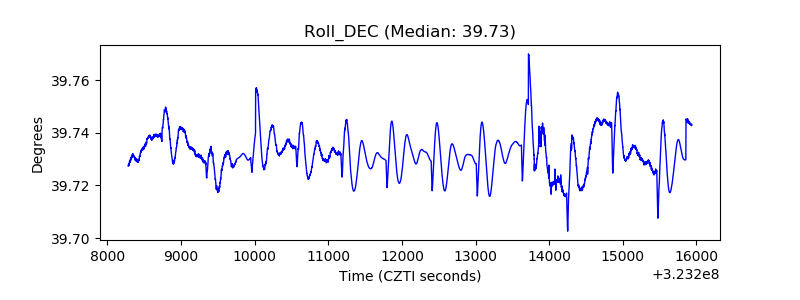 |
| _Roll_RA | 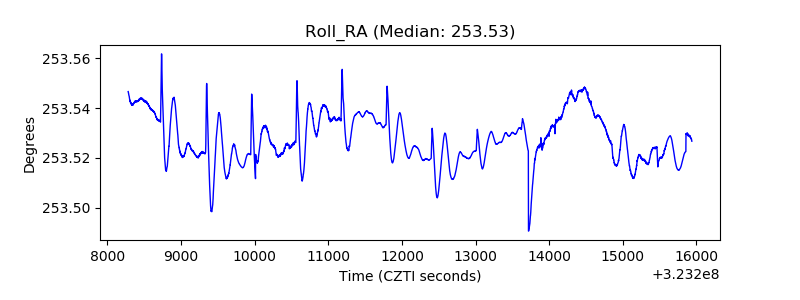 |
| Veto Counter | 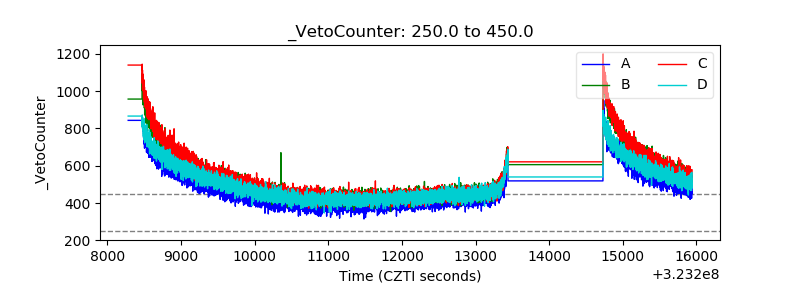 |