| Param | Original file | Final file |
|---|---|---|
| Filename | modeM0/AS1A07_145T01_9000003594_24346cztM0_level2.evt | modeM0/AS1A07_145T01_9000003594_24346cztM0_level2_quad_clean.evt |
| Size (bytes) | 582,344,640 | 113,209,920 |
| Size | 555.4 MB | 108.0 MB |
| Events in quadrant A | 3,113,255 | 757,414 |
| Events in quadrant B | 3,207,146 | 796,121 |
| Events in quadrant C | 5,389,623 | 747,961 |
| Events in quadrant D | 5,512,631 | 699,782 |
| Mode M0 | |||
|---|---|---|---|
| Quadrant | BADHDUFLAG | Total packets | Discarded packets |
| A | 0 | 13101 | 2 |
| B | 0 | 13371 | 2 |
| C | 0 | 20334 | 2 |
| D | 0 | 20659 | 2 |
| Mode M9 | |||
|---|---|---|---|
| Quadrant | BADHDUFLAG | Total packets | Discarded packets |
| A | 0 | 18 | 0 |
| B | 0 | 19 | 0 |
| C | 0 | 19 | 0 |
| D | 0 | 19 | 0 |
| Mode SS | |||
|---|---|---|---|
| Quadrant | BADHDUFLAG | Total packets | Discarded packets |
| A | 0 | 126 | 0 |
| B | 0 | 126 | 0 |
| C | 0 | 126 | 0 |
| D | 0 | 126 | 0 |
| Quadrant | Total seconds | Saturated seconds | Saturation percentage |
|---|---|---|---|
| A | 6114 | 18 | 0.294406% |
| B | 6114 | 29 | 0.474321% |
| C | 6114 | 236 | 3.859993% |
| D | 6114 | 448 | 7.327445% |
Noise dominated data is calculated using 1-second bins in cleaned event files. If a bin has >2000 counts, and if more than 50% of those come from <1% of pixels, then it is considered to be noise-dominated and hence unusable.
| Quadrant | # 1 sec bins | Bins with >0 counts | Bins with >2000 counts | High rate bins dominated by noise | Noise dominated (total time) | Noise dominated (detector-on time) | Marked lightcurve |
|---|---|---|---|---|---|---|---|
| A | 7479 | 6115 | 0 | 0 | 0.00% | 0.00% | 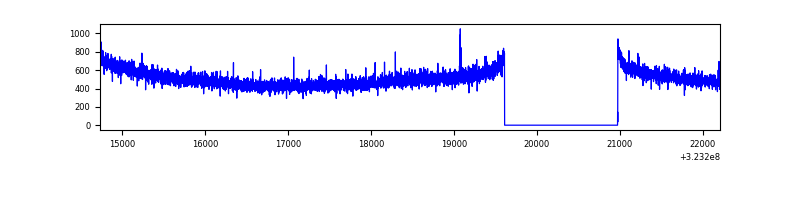 |
| B | 7479 | 6115 | 0 | 0 | 0.00% | 0.00% | 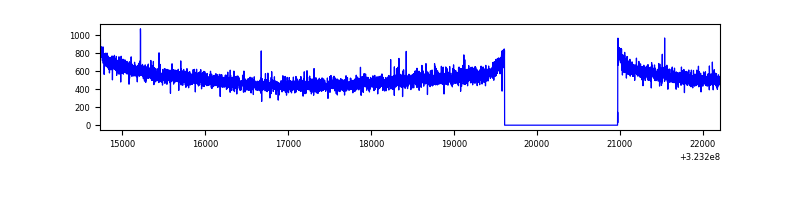 |
| C | 7479 | 6115 | 0 | 0 | 0.00% | 0.00% | 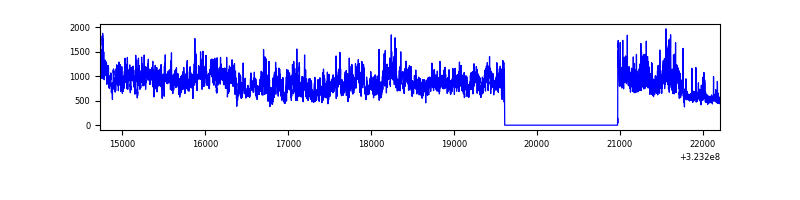 |
| D | 7479 | 6115 | 367 | 367 | 4.91% | 6.00% | 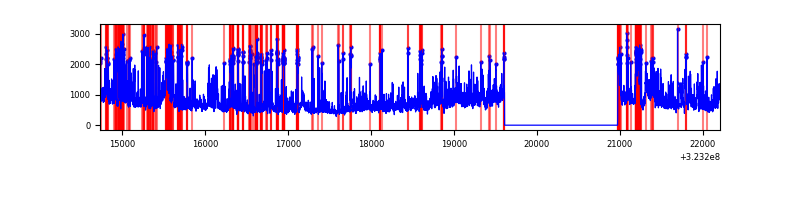 |
Top three noisy pixels from each quadrant. If the there are fewer than three noisy pixels in the level2.evt file, extra rows are filled as -1
| Pixel properties | Quadrant properties | ||||||
|---|---|---|---|---|---|---|---|
| Quadrant | DetID | PixID | Counts | Sigma | Mean | Median | Sigma |
| A | 2 | 79 | 11091 | 64.16 | 805 | 791 | 160.5 |
| A | 13 | 254 | 8958 | 50.88 | 805 | 791 | 160.5 |
| A | 0 | 226 | 6905 | 38.09 | 805 | 791 | 160.5 |
| B | 12 | 111 | 17887 | 111.57 | 818 | 801 | 153.1 |
| B | 11 | 111 | 16029 | 99.44 | 818 | 801 | 153.1 |
| B | 14 | 111 | 14321 | 88.29 | 818 | 801 | 153.1 |
| C | 7 | 247 | 2167351 | 11918.19 | 787 | 794 | 181.8 |
| C | 14 | 238 | 127790 | 698.6 | 787 | 794 | 181.8 |
| C | 2 | 16 | 12478 | 64.27 | 787 | 794 | 181.8 |
| D | 1 | 52 | 957596 | 5127.23 | 769 | 747 | 186.6 |
| D | 8 | 195 | 937372 | 5018.86 | 769 | 747 | 186.6 |
| D | 9 | 35 | 339285 | 1814.04 | 769 | 747 | 186.6 |
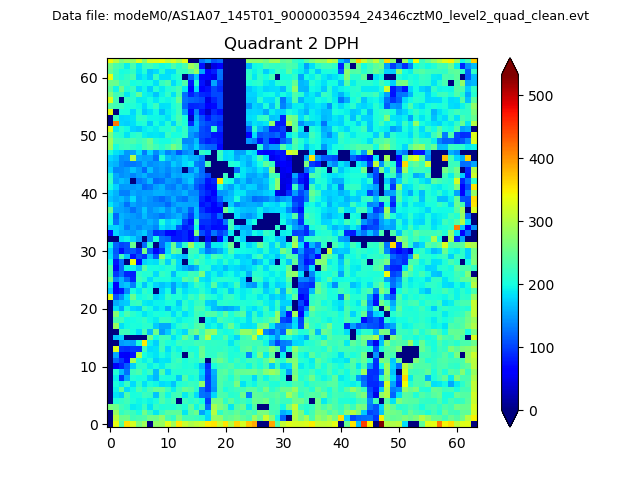
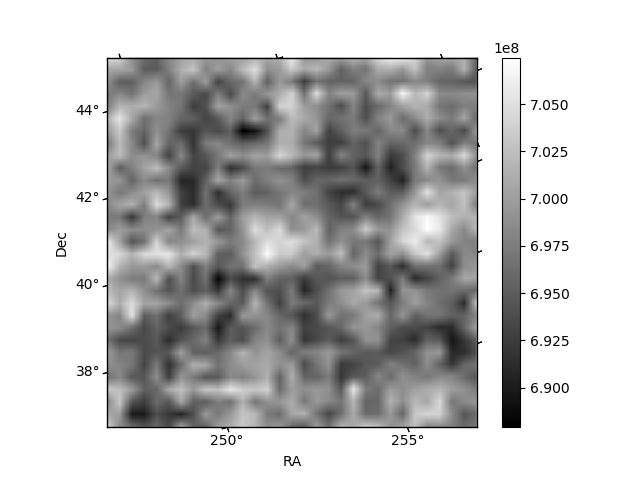
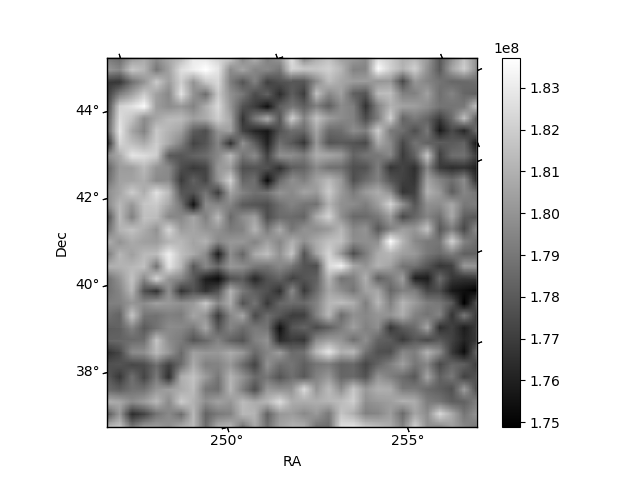
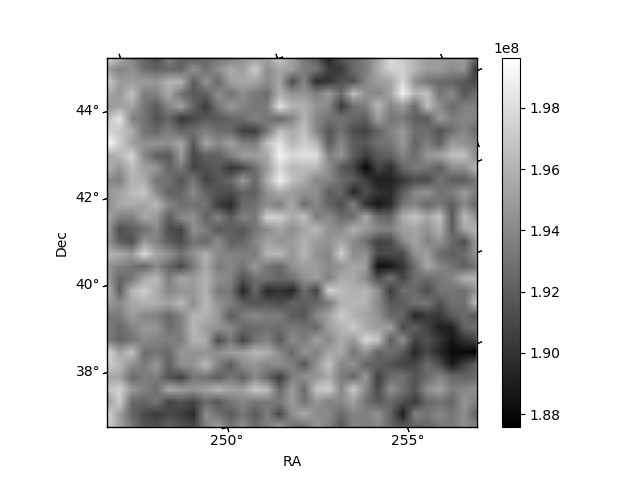
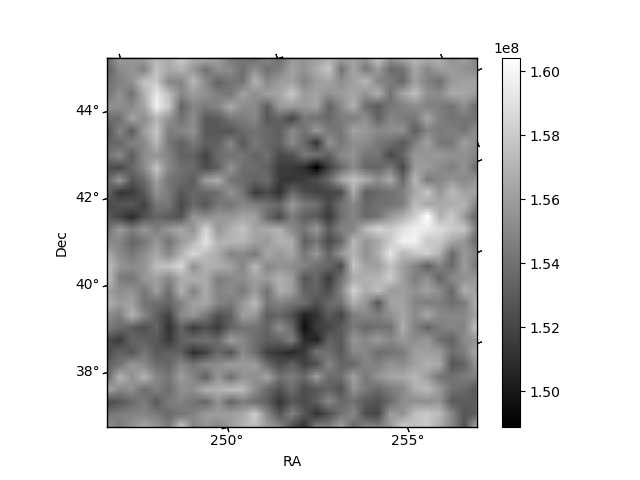
Histogram calculated using DETX and DETY for each event in the final _common_clean file
| Quadrant A | 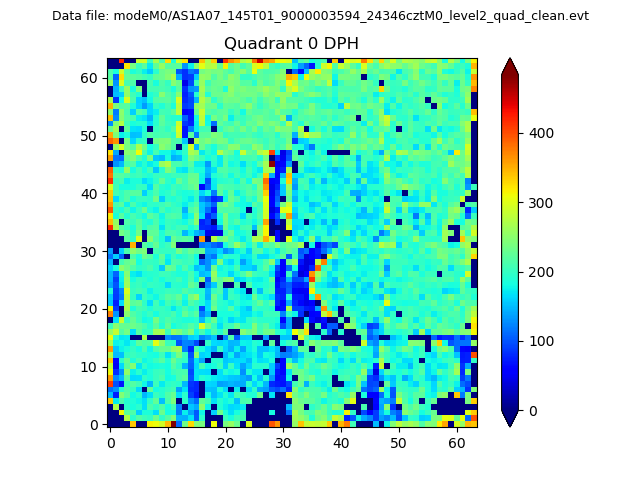 |
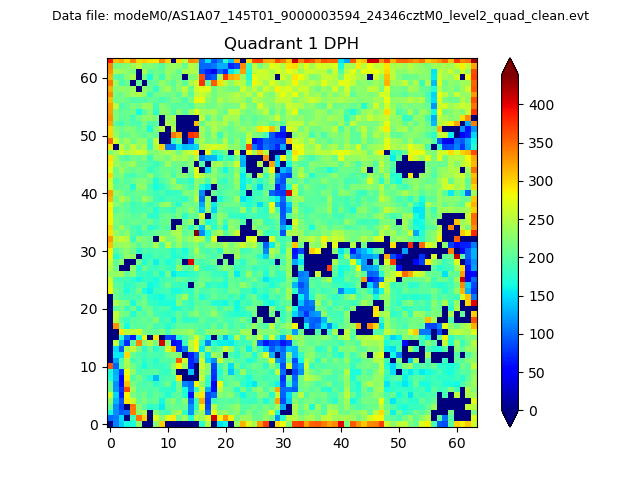 |
Quadrant B |
|---|---|---|---|
| Quadrant D | 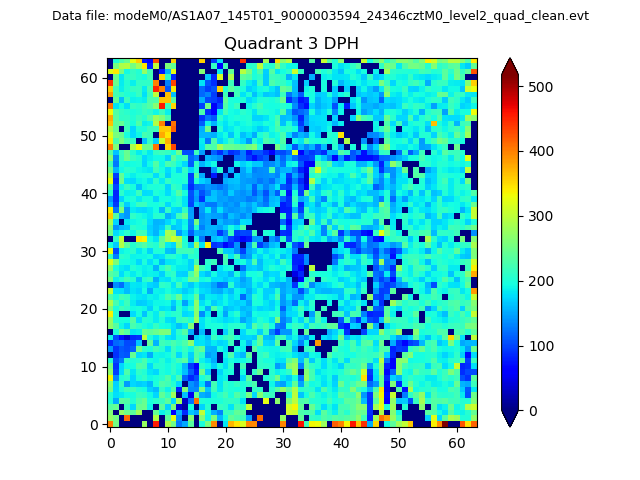 |
 |
Quadrant C |
| Plot type | Count rate plots | Images |
|---|---|---|
| Comparison with Poisson distribution Blue bars denote a histogram of data divided into 1 sec bins. Red curve is a Poisson curve with rate = median count rate of data. |
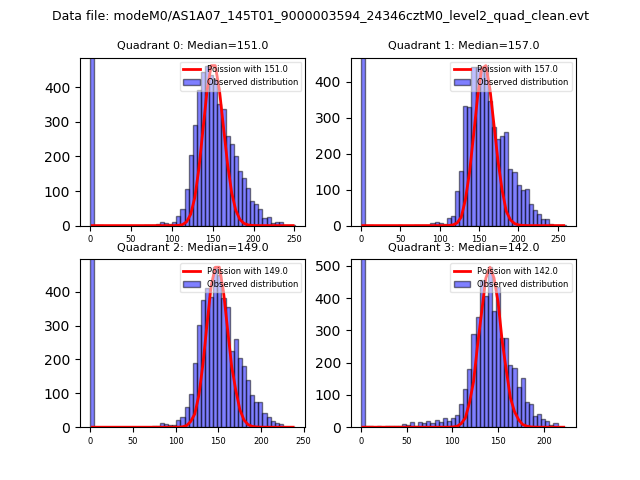 |
 |
| Quadrant-wise count rates Data is divided into 100 sec bins |
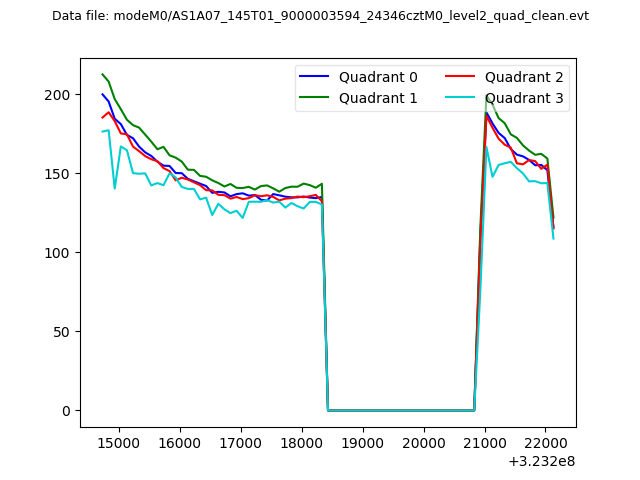 |
|
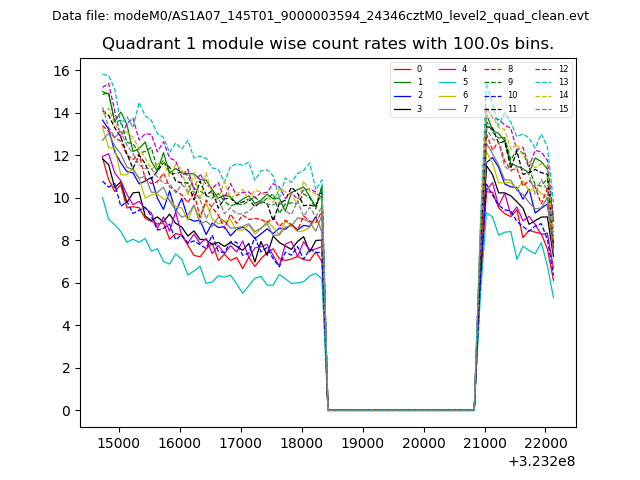
| Module-wise count rates for Quadrant A Data is divided into 100 sec bins |
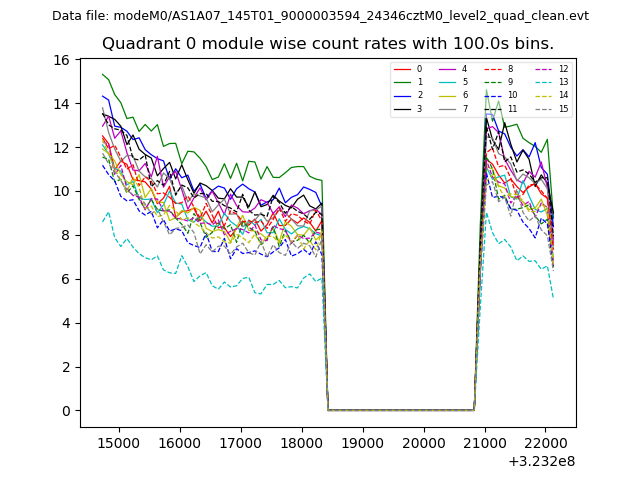 |
 |
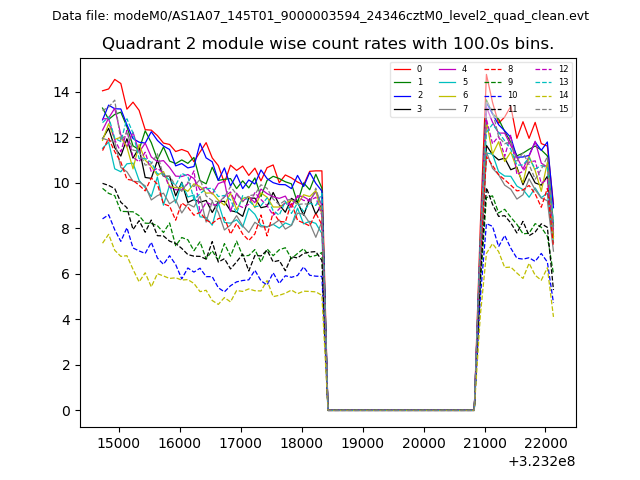
| Module-wise count rates for Quadrant B Data is divided into 100 sec bins |
 |
 |
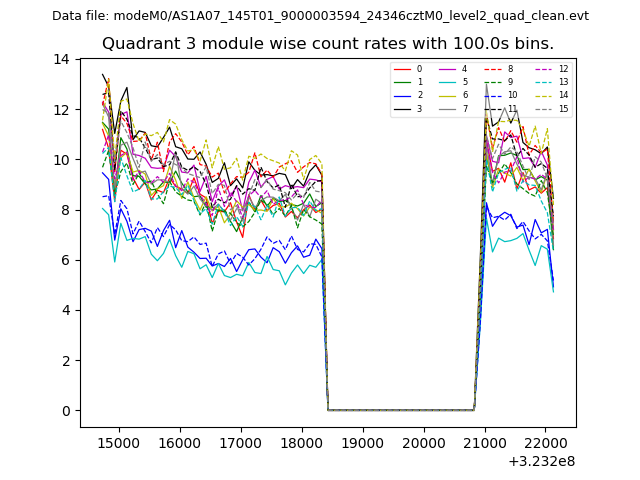
| Module-wise count rates for Quadrant C Data is divided into 100 sec bins |
 |
 |
| Module-wise count rates for Quadrant D Data is divided into 100 sec bins |
 |
 |
| Parameter | Plot |
|---|---|
| CZT HV Monitor | 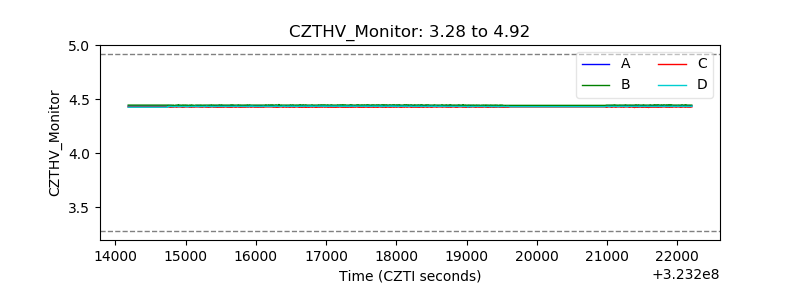 |
| D_VDD | 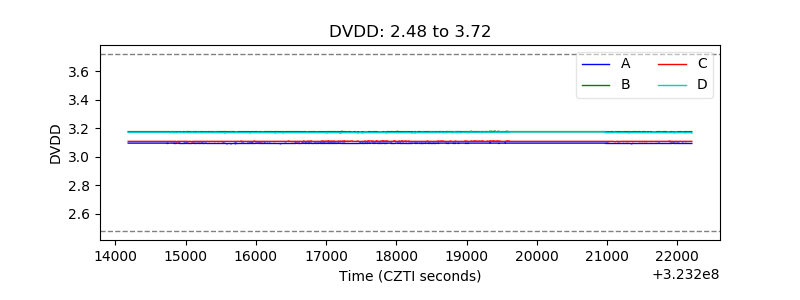 |
| Temperature 1 | 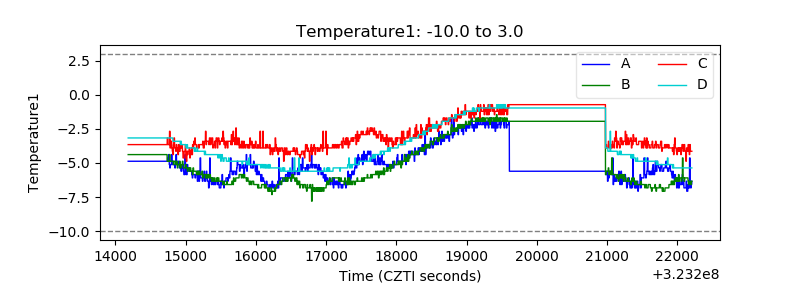 |
| Veto HV Monitor | 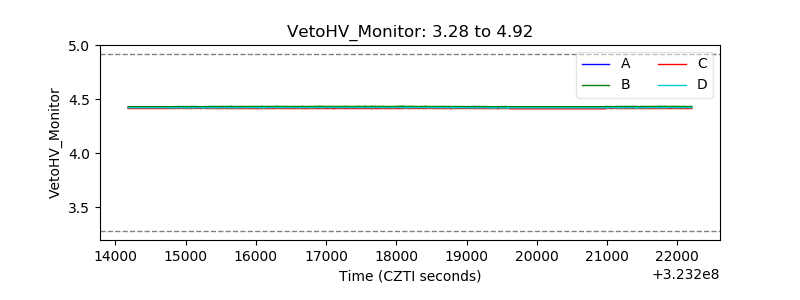 |
| Veto LLD | 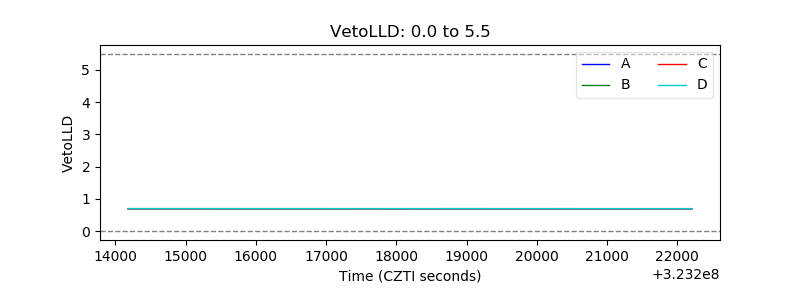 |
| Alpha Counter | 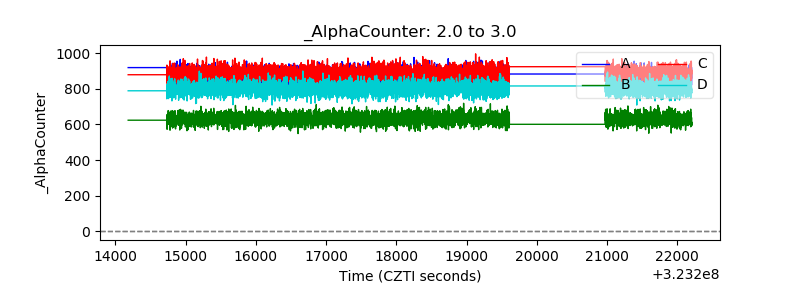 |
| _CPM_Rate | 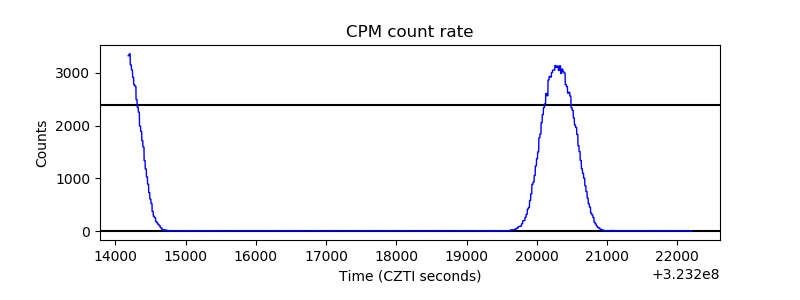 |
| CZT Counter | 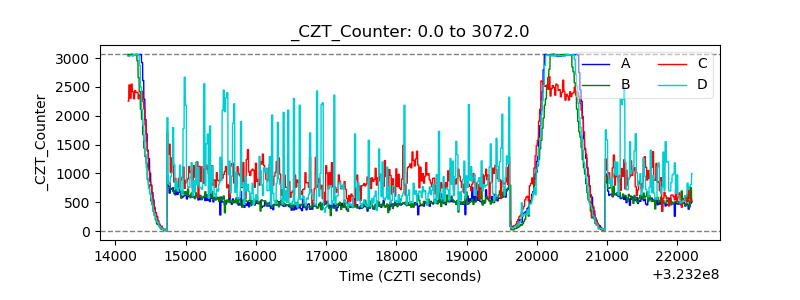 |
| +2.5 Volts monitor |  |
| +5 Volts monitor | 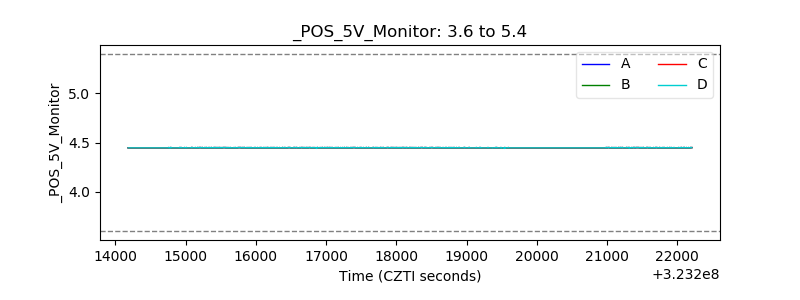 |
| _ROLL_ROT | 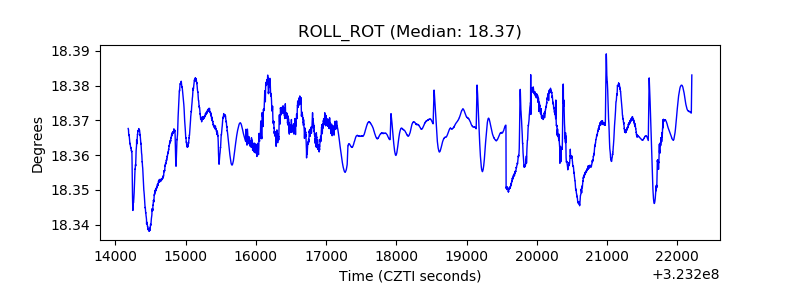 |
| _Roll_DEC | 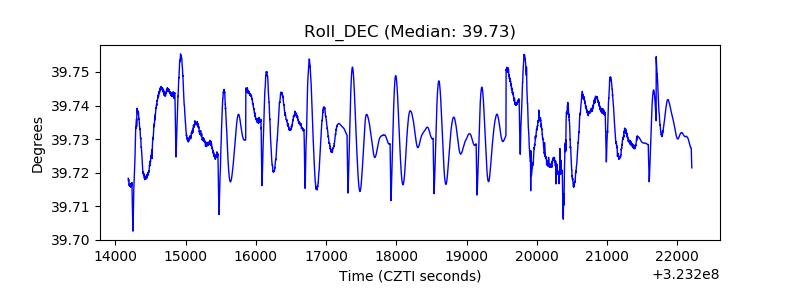 |
| _Roll_RA | 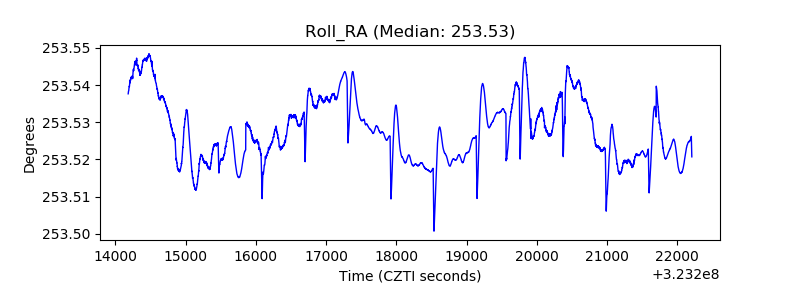 |
| Veto Counter | 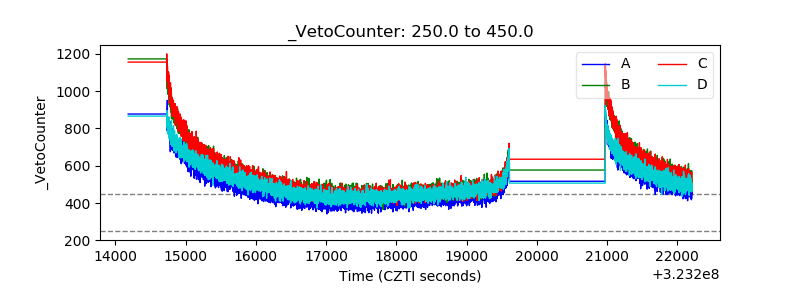 |