| Param | Original file | Final file |
|---|---|---|
| Filename | modeM0/AS1A07_145T01_9000003594_24347cztM0_level2.evt | modeM0/AS1A07_145T01_9000003594_24347cztM0_level2_quad_clean.evt |
| Size (bytes) | 600,094,080 | 104,866,560 |
| Size | 572.3 MB | 100.0 MB |
| Events in quadrant A | 3,158,457 | 693,716 |
| Events in quadrant B | 3,222,895 | 726,741 |
| Events in quadrant C | 6,433,977 | 673,227 |
| Events in quadrant D | 4,937,644 | 647,361 |
| Mode M0 | |||
|---|---|---|---|
| Quadrant | BADHDUFLAG | Total packets | Discarded packets |
| A | 0 | 13257 | 2 |
| B | 0 | 13427 | 2 |
| C | 0 | 23525 | 6 |
| D | 0 | 19004 | 2 |
| Mode M9 | |||
|---|---|---|---|
| Quadrant | BADHDUFLAG | Total packets | Discarded packets |
| A | 0 | 25 | 0 |
| B | 0 | 26 | 0 |
| C | 0 | 26 | 0 |
| D | 0 | 26 | 0 |
| Mode SS | |||
|---|---|---|---|
| Quadrant | BADHDUFLAG | Total packets | Discarded packets |
| A | 0 | 126 | 0 |
| B | 0 | 126 | 0 |
| C | 0 | 126 | 0 |
| D | 0 | 126 | 0 |
| Quadrant | Total seconds | Saturated seconds | Saturation percentage |
|---|---|---|---|
| A | 6232 | 31 | 0.497433% |
| B | 6232 | 59 | 0.946727% |
| C | 6231 | 372 | 5.970149% |
| D | 6231 | 188 | 3.017172% |
Noise dominated data is calculated using 1-second bins in cleaned event files. If a bin has >2000 counts, and if more than 50% of those come from <1% of pixels, then it is considered to be noise-dominated and hence unusable.
| Quadrant | # 1 sec bins | Bins with >0 counts | Bins with >2000 counts | High rate bins dominated by noise | Noise dominated (total time) | Noise dominated (detector-on time) | Marked lightcurve |
|---|---|---|---|---|---|---|---|
| A | 7552 | 6233 | 2 | 2 | 0.03% | 0.03% | 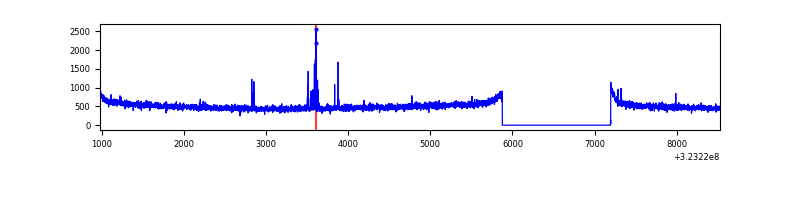 |
| B | 7552 | 6233 | 1 | 1 | 0.01% | 0.02% | 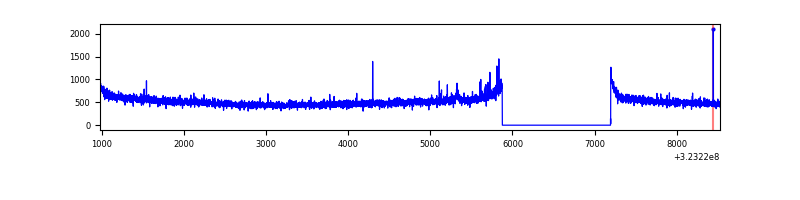 |
| C | 7551 | 6232 | 11 | 11 | 0.15% | 0.18% | 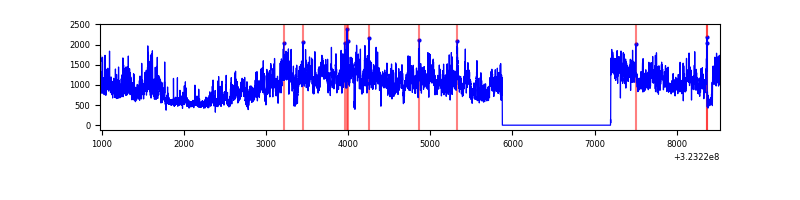 |
| D | 7551 | 6232 | 134 | 134 | 1.77% | 2.15% | 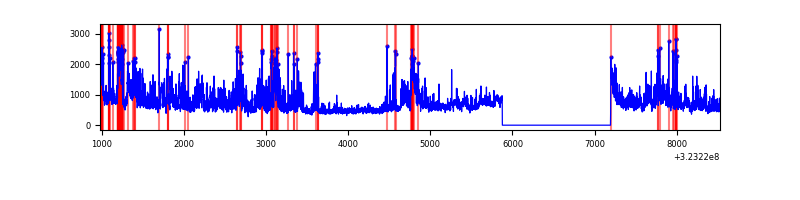 |
Top three noisy pixels from each quadrant. If the there are fewer than three noisy pixels in the level2.evt file, extra rows are filled as -1
| Pixel properties | Quadrant properties | ||||||
|---|---|---|---|---|---|---|---|
| Quadrant | DetID | PixID | Counts | Sigma | Mean | Median | Sigma |
| A | 2 | 79 | 44962 | 276.13 | 807 | 792 | 160.0 |
| A | 13 | 254 | 9106 | 51.97 | 807 | 792 | 160.0 |
| A | 0 | 226 | 6980 | 38.68 | 807 | 792 | 160.0 |
| B | 12 | 111 | 18131 | 113.15 | 817 | 799 | 153.2 |
| B | 11 | 111 | 16103 | 99.91 | 817 | 799 | 153.2 |
| B | 14 | 111 | 14525 | 89.61 | 817 | 799 | 153.2 |
| C | 7 | 247 | 3247848 | 17951.39 | 779 | 784 | 180.9 |
| C | 14 | 238 | 125182 | 687.73 | 779 | 784 | 180.9 |
| C | 2 | 16 | 13956 | 72.82 | 779 | 784 | 180.9 |
| D | 8 | 195 | 953018 | 5089.24 | 775 | 753 | 187.1 |
| D | 1 | 52 | 509980 | 2721.49 | 775 | 753 | 187.1 |
| D | 7 | 238 | 357139 | 1904.65 | 775 | 753 | 187.1 |
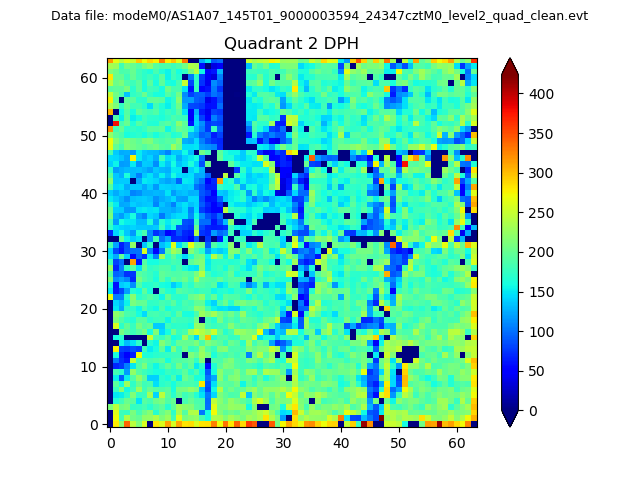
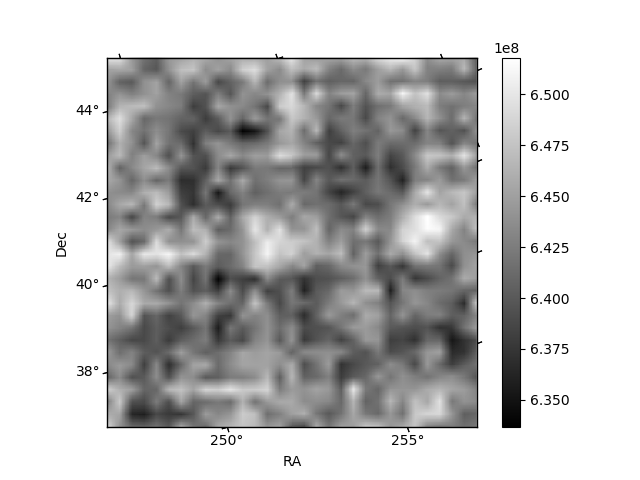
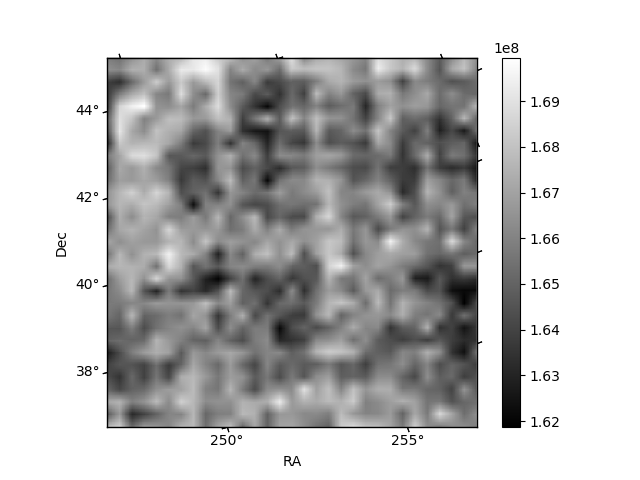
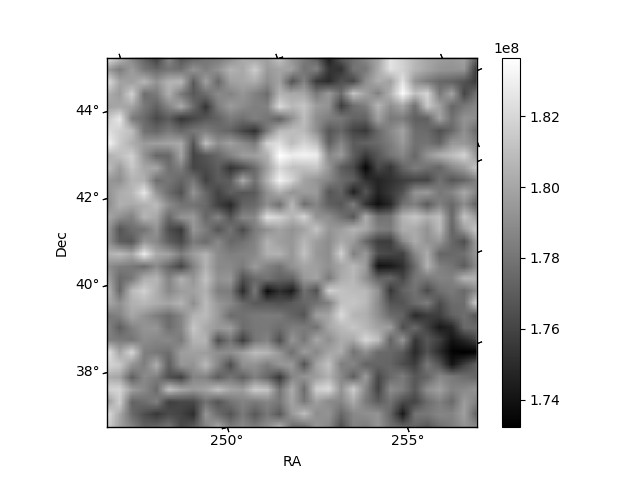
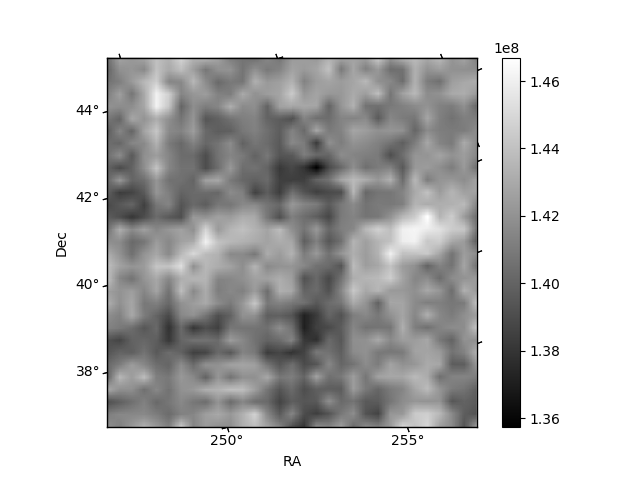
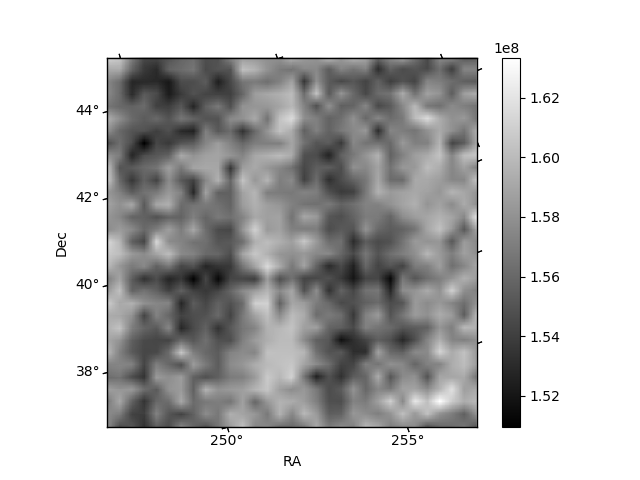
Histogram calculated using DETX and DETY for each event in the final _common_clean file
| Quadrant A | 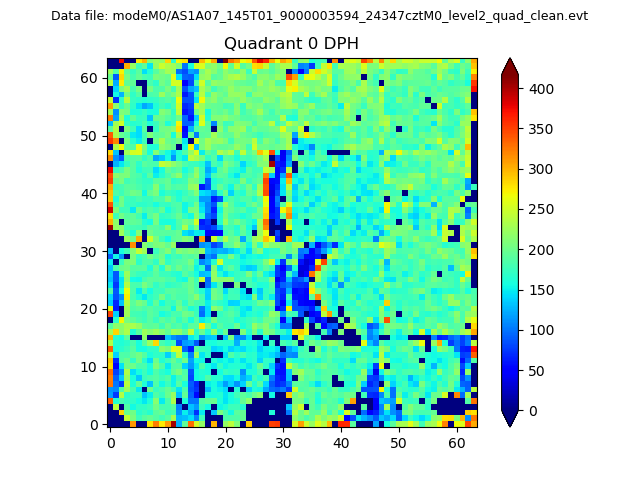 |
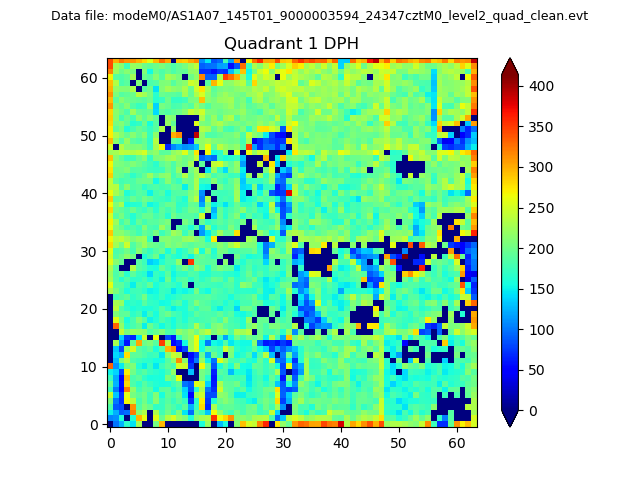 |
Quadrant B |
|---|---|---|---|
| Quadrant D | 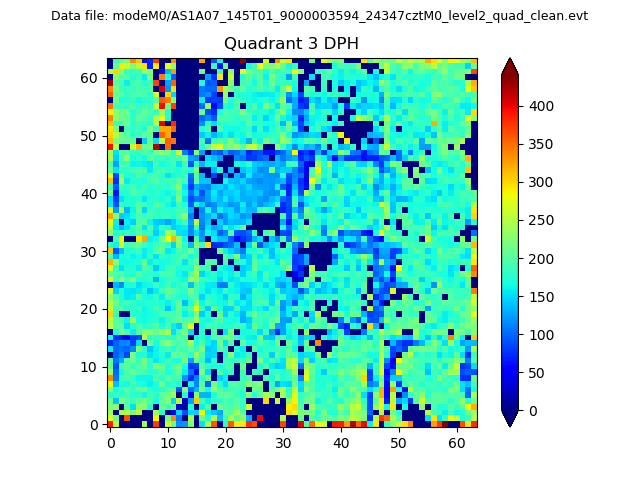 |
 |
Quadrant C |
| Plot type | Count rate plots | Images |
|---|---|---|
| Comparison with Poisson distribution Blue bars denote a histogram of data divided into 1 sec bins. Red curve is a Poisson curve with rate = median count rate of data. |
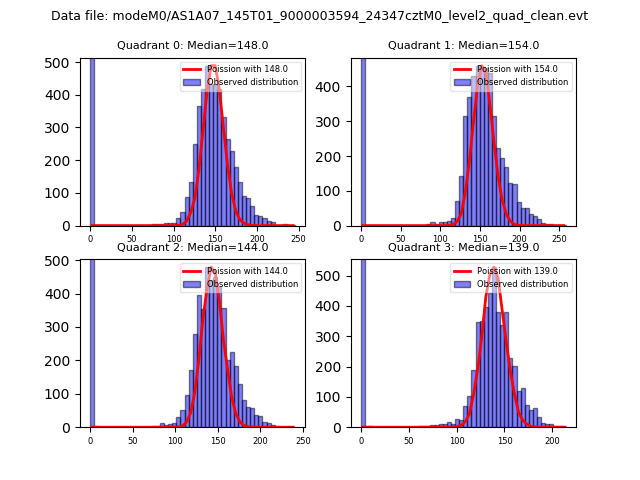 |
 |
| Quadrant-wise count rates Data is divided into 100 sec bins |
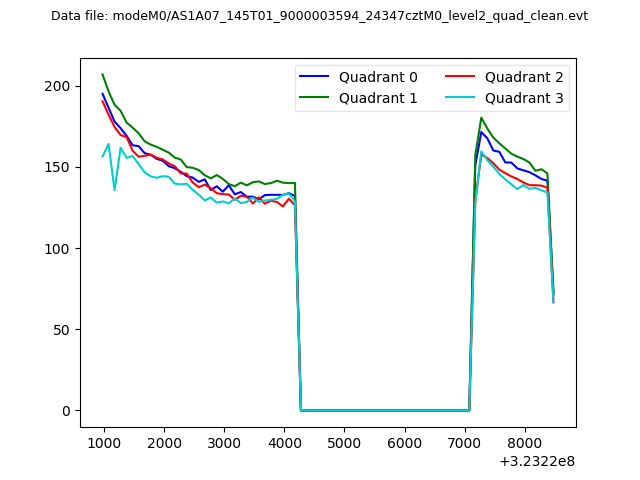 |
|
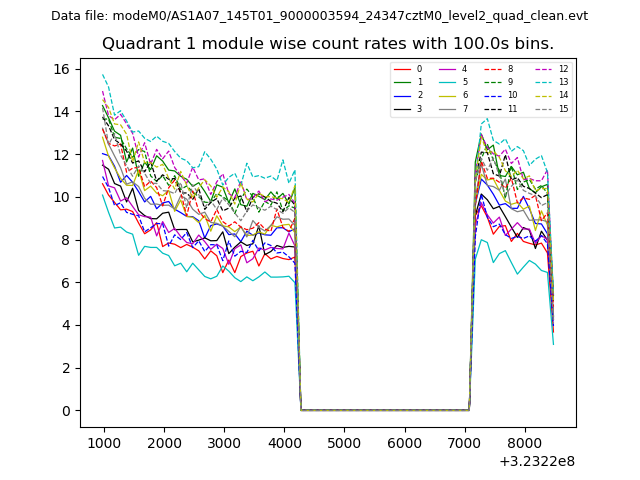
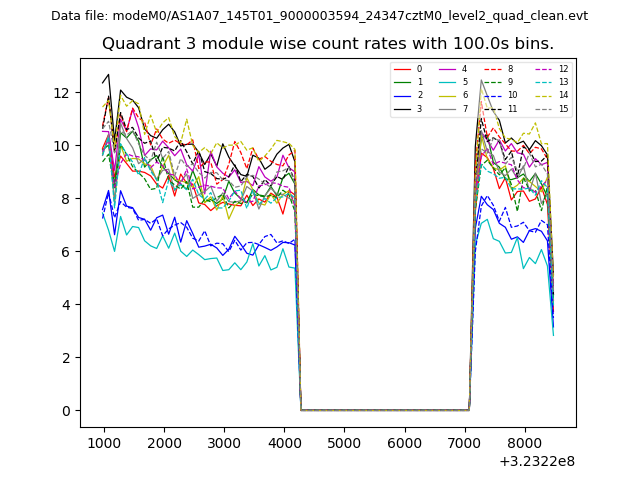
| Module-wise count rates for Quadrant A Data is divided into 100 sec bins |
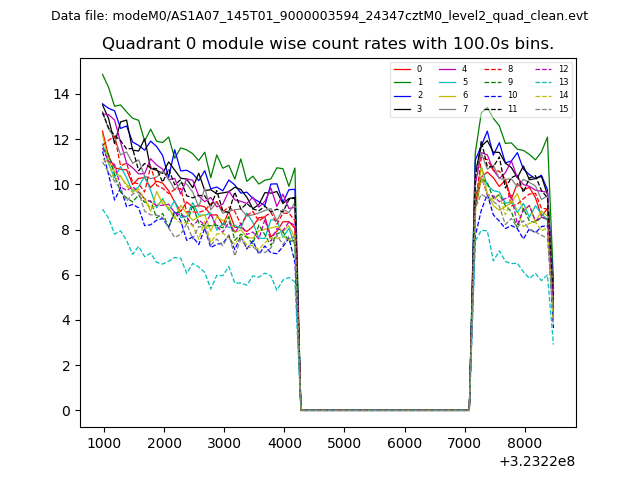 |
 |
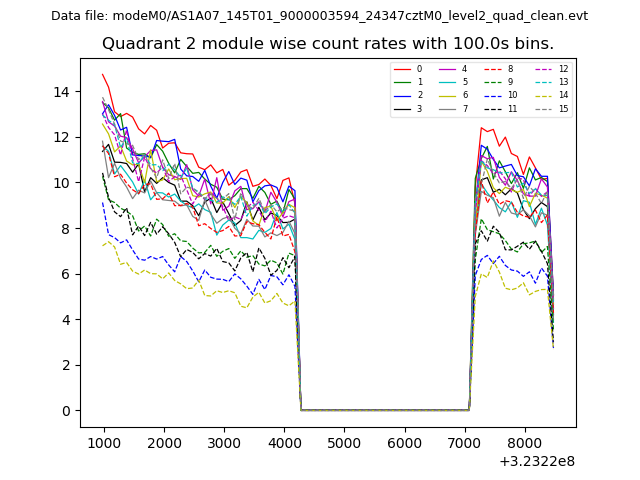
| Module-wise count rates for Quadrant B Data is divided into 100 sec bins |
 |
 |
| Module-wise count rates for Quadrant C Data is divided into 100 sec bins |
 |
 |
| Module-wise count rates for Quadrant D Data is divided into 100 sec bins |
 |
 |
| Parameter | Plot |
|---|---|
| CZT HV Monitor |  |
| D_VDD | 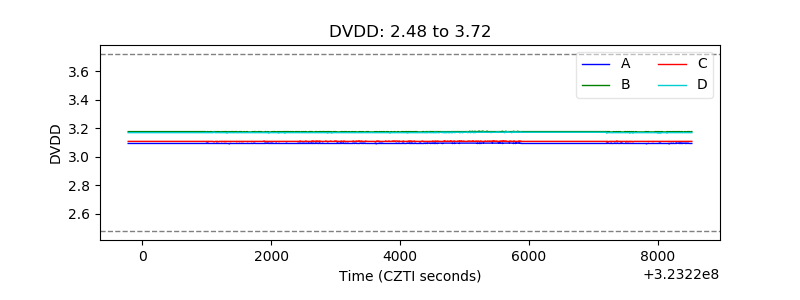 |
| Temperature 1 | 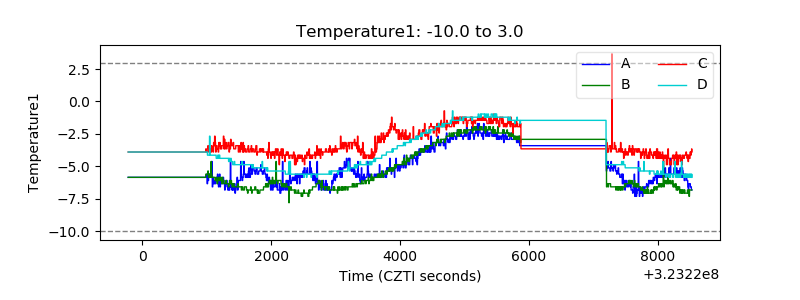 |
| Veto HV Monitor | 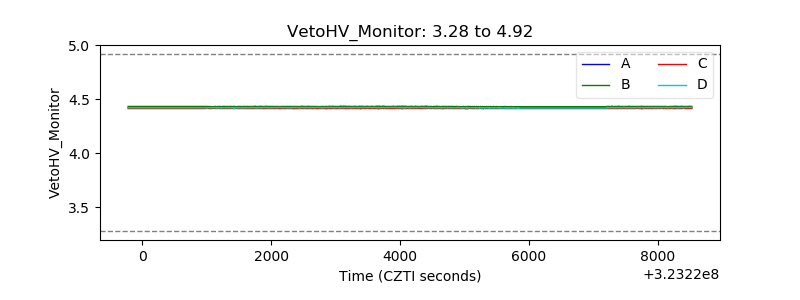 |
| Veto LLD | 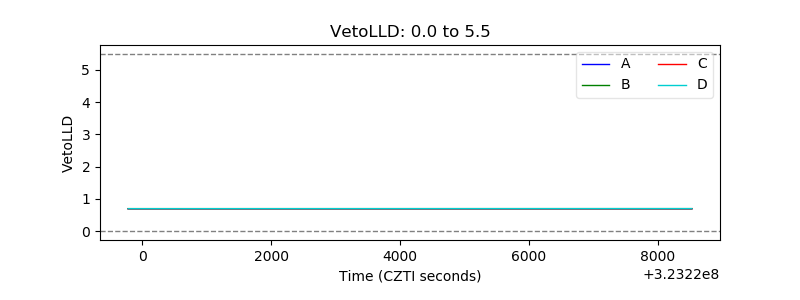 |
| Alpha Counter | 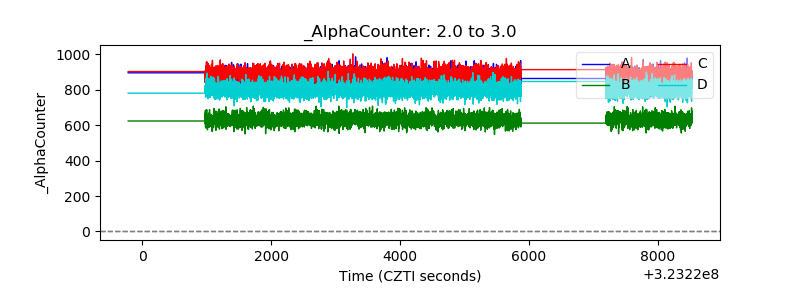 |
| _CPM_Rate | 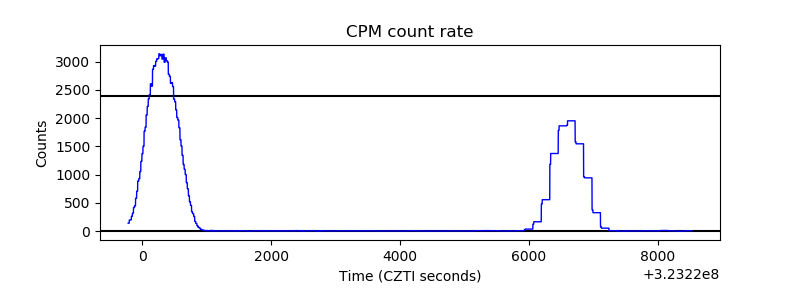 |
| CZT Counter | 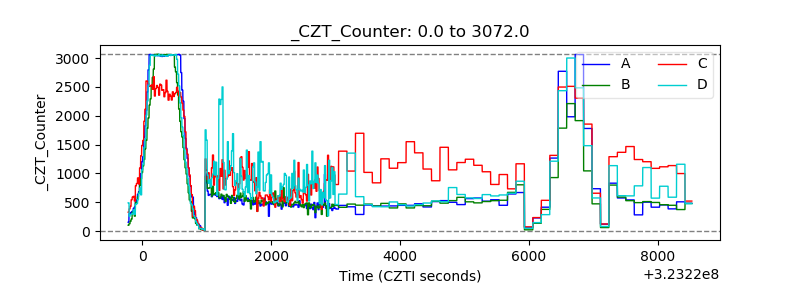 |
| +2.5 Volts monitor |  |
| +5 Volts monitor |  |
| _ROLL_ROT | 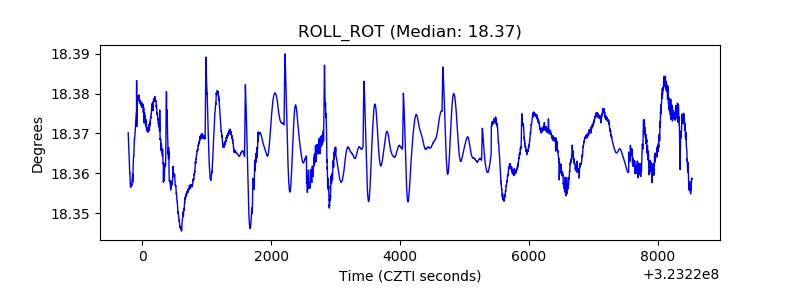 |
| _Roll_DEC | 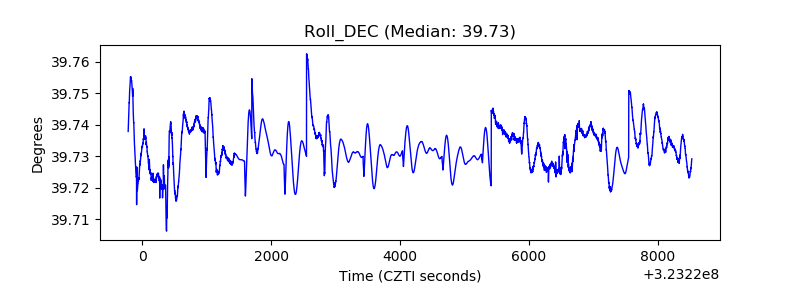 |
| _Roll_RA | 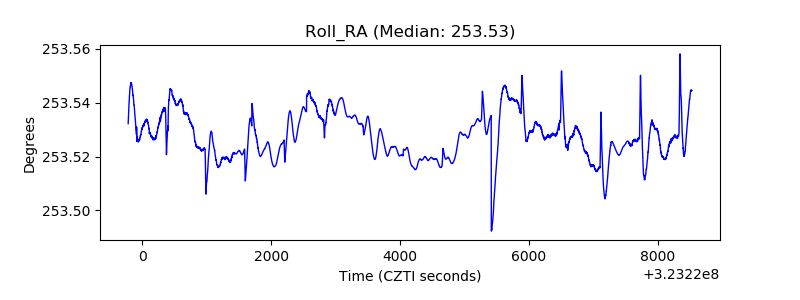 |
| Veto Counter | 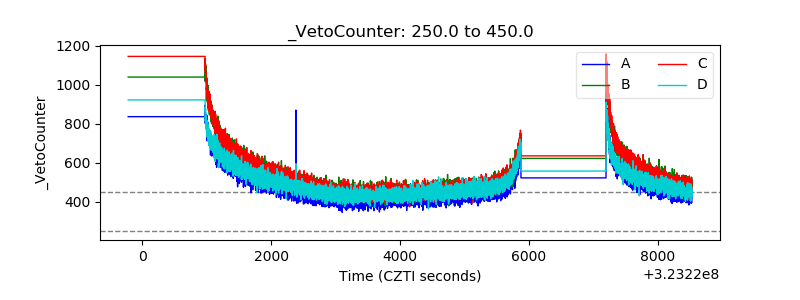 |