| Param | Original file | Final file |
|---|---|---|
| Filename | modeM0/AS1A07_145T01_9000003594_24350cztM0_level2.evt | modeM0/AS1A07_145T01_9000003594_24350cztM0_level2_quad_clean.evt |
| Size (bytes) | 739,252,800 | 102,504,960 |
| Size | 705.0 MB | 97.8 MB |
| Events in quadrant A | 3,434,048 | 666,610 |
| Events in quadrant B | 3,499,849 | 691,733 |
| Events in quadrant C | 5,026,077 | 655,346 |
| Events in quadrant D | 9,932,004 | 578,753 |
| Mode M0 | |||
|---|---|---|---|
| Quadrant | BADHDUFLAG | Total packets | Discarded packets |
| A | 0 | 15060 | 2 |
| B | 0 | 15128 | 2 |
| C | 0 | 20055 | 2 |
| D | 0 | 34678 | 2 |
| Mode M9 | |||
|---|---|---|---|
| Quadrant | BADHDUFLAG | Total packets | Discarded packets |
| A | 0 | 4 | 0 |
| B | 0 | 4 | 0 |
| C | 0 | 4 | 0 |
| D | 0 | 4 | 0 |
| Mode SS | |||
|---|---|---|---|
| Quadrant | BADHDUFLAG | Total packets | Discarded packets |
| A | 0 | 150 | 0 |
| B | 0 | 150 | 0 |
| C | 0 | 150 | 0 |
| D | 0 | 150 | 0 |
| Quadrant | Total seconds | Saturated seconds | Saturation percentage |
|---|---|---|---|
| A | 7340 | 117 | 1.594005% |
| B | 7341 | 152 | 2.070563% |
| C | 7341 | 259 | 3.528130% |
| D | 7341 | 1672 | 22.776189% |
Noise dominated data is calculated using 1-second bins in cleaned event files. If a bin has >2000 counts, and if more than 50% of those come from <1% of pixels, then it is considered to be noise-dominated and hence unusable.
| Quadrant | # 1 sec bins | Bins with >0 counts | Bins with >2000 counts | High rate bins dominated by noise | Noise dominated (total time) | Noise dominated (detector-on time) | Marked lightcurve |
|---|---|---|---|---|---|---|---|
| A | 7755 | 7340 | 0 | 0 | 0.00% | 0.00% | 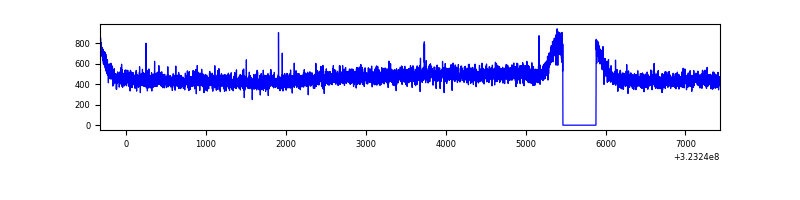 |
| B | 7756 | 7341 | 1 | 1 | 0.01% | 0.01% | 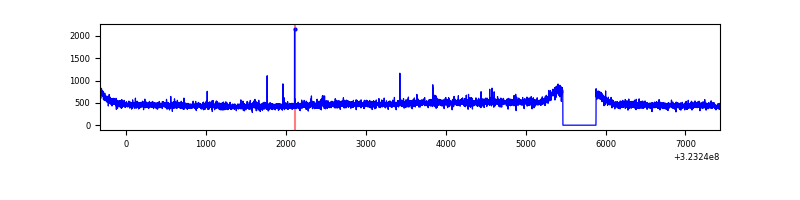 |
| C | 7756 | 7341 | 6 | 6 | 0.08% | 0.08% | 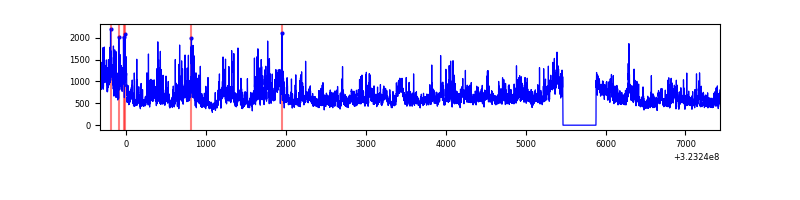 |
| D | 7756 | 7341 | 1545 | 1545 | 19.92% | 21.05% | 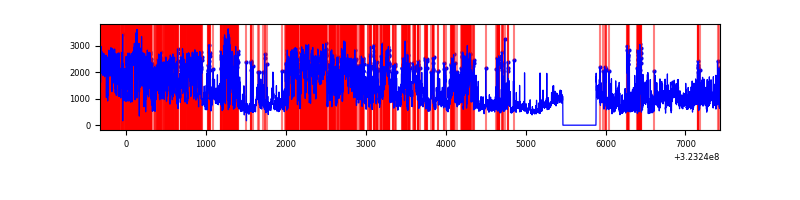 |
Top three noisy pixels from each quadrant. If the there are fewer than three noisy pixels in the level2.evt file, extra rows are filled as -1
| Pixel properties | Quadrant properties | ||||||
|---|---|---|---|---|---|---|---|
| Quadrant | DetID | PixID | Counts | Sigma | Mean | Median | Sigma |
| A | 13 | 254 | 10033 | 51.04 | 889 | 870 | 179.5 |
| A | 3 | 137 | 8098 | 40.26 | 889 | 870 | 179.5 |
| A | 0 | 226 | 7545 | 37.18 | 889 | 870 | 179.5 |
| B | 12 | 111 | 21475 | 119.02 | 891 | 869 | 173.1 |
| B | 11 | 111 | 18767 | 103.37 | 891 | 869 | 173.1 |
| B | 14 | 111 | 16919 | 92.7 | 891 | 869 | 173.1 |
| C | 7 | 247 | 1542861 | 7762.19 | 850 | 854 | 198.7 |
| C | 14 | 238 | 135942 | 680.01 | 850 | 854 | 198.7 |
| C | 2 | 16 | 27276 | 133.0 | 850 | 854 | 198.7 |
| D | 7 | 238 | 3003119 | 15637.54 | 791 | 769 | 192.0 |
| D | 1 | 52 | 1874085 | 9757.04 | 791 | 769 | 192.0 |
| D | 12 | 218 | 1055241 | 5492.15 | 791 | 769 | 192.0 |
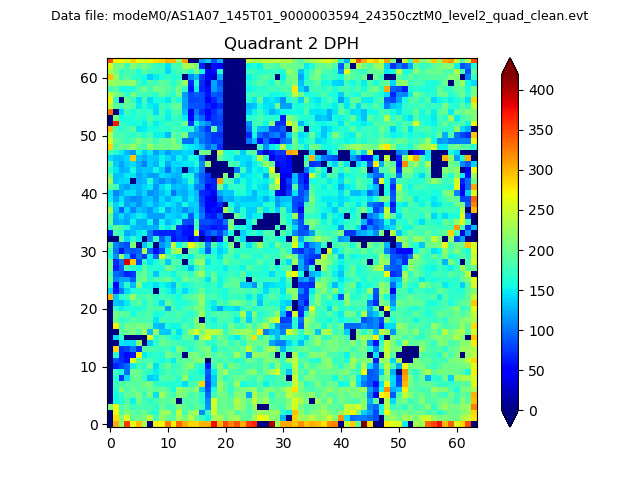
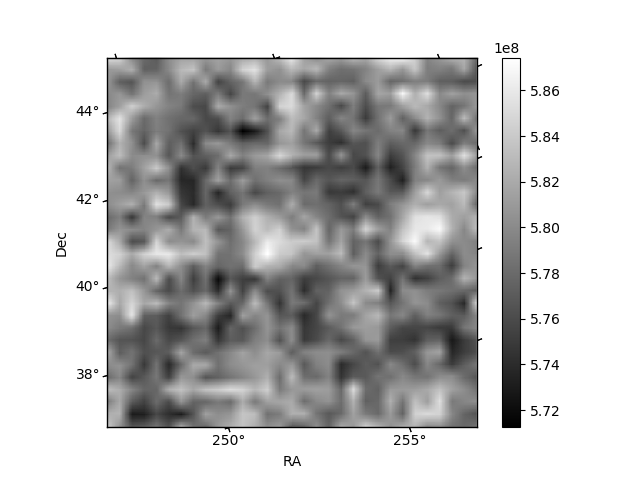
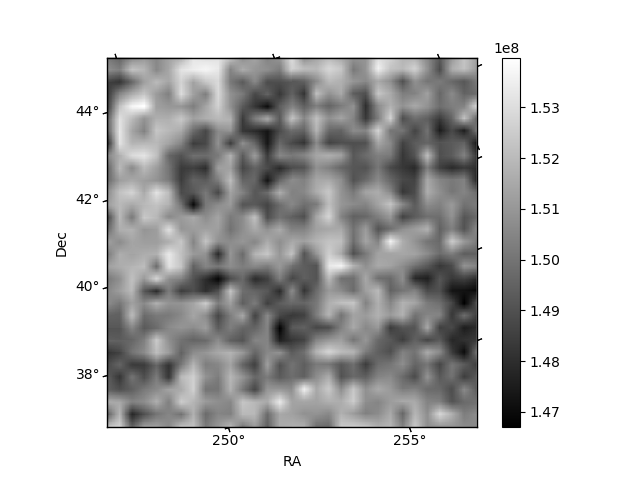
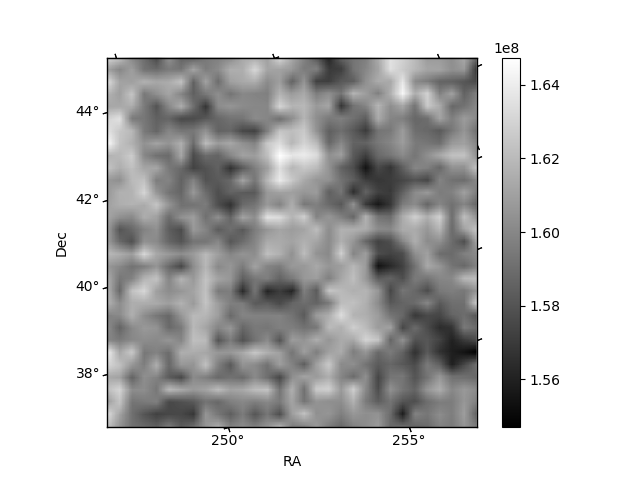
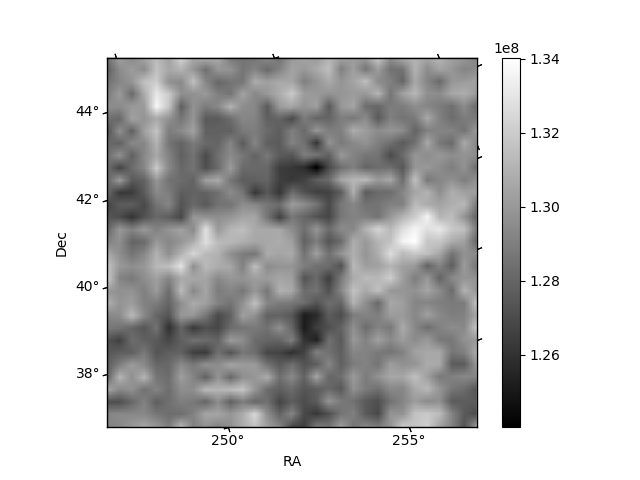
Histogram calculated using DETX and DETY for each event in the final _common_clean file
| Quadrant A | 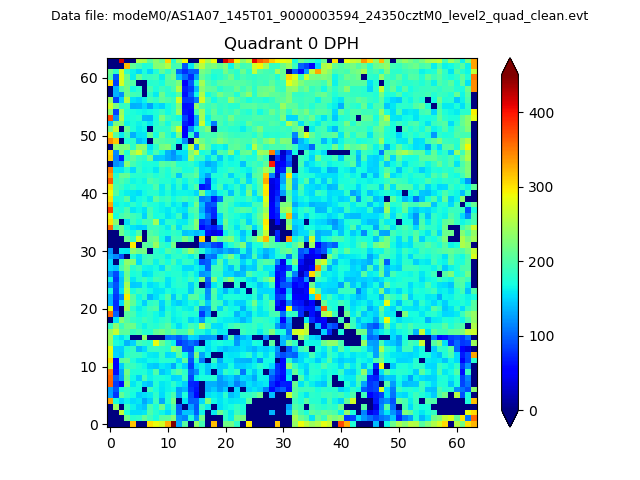 |
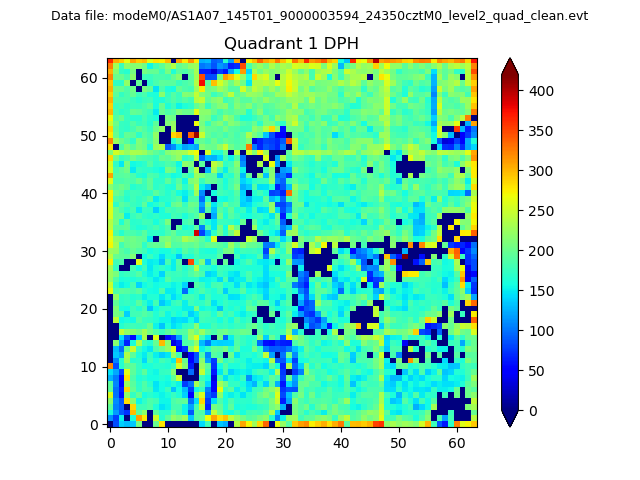 |
Quadrant B |
|---|---|---|---|
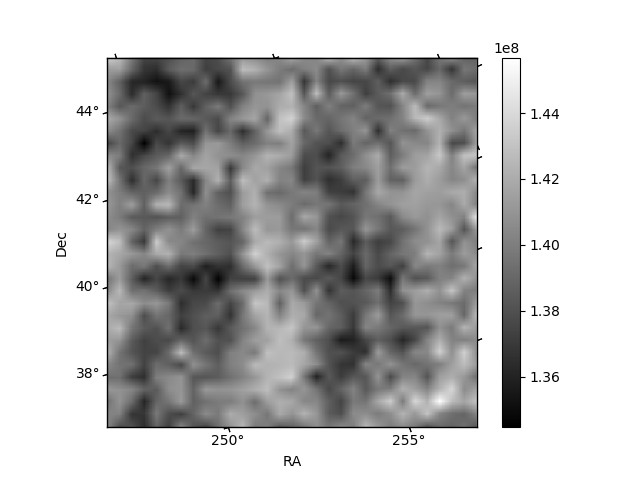
| Quadrant D | 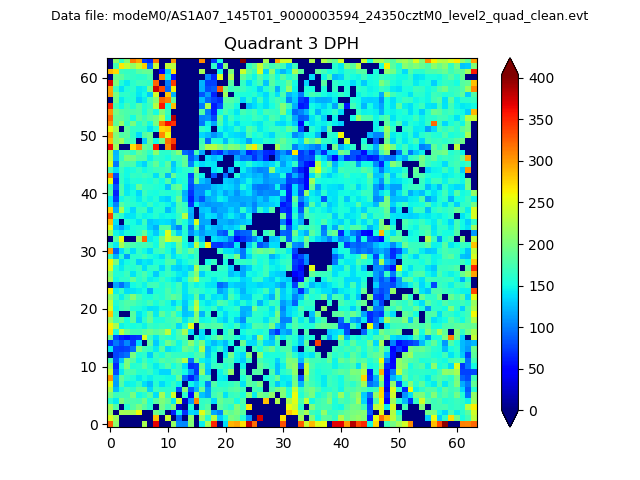 |
 |
Quadrant C |
| Plot type | Count rate plots | Images |
|---|---|---|
| Comparison with Poisson distribution Blue bars denote a histogram of data divided into 1 sec bins. Red curve is a Poisson curve with rate = median count rate of data. |
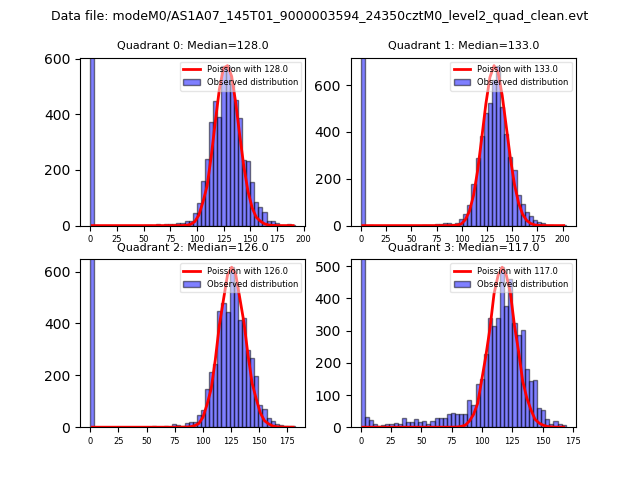 |
 |
| Quadrant-wise count rates Data is divided into 100 sec bins |
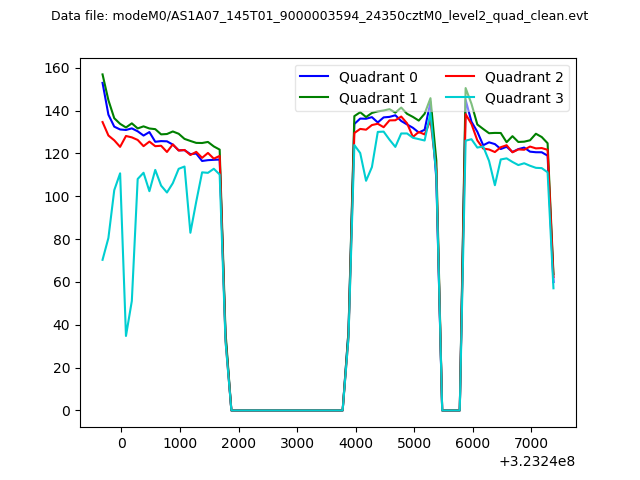 |
|
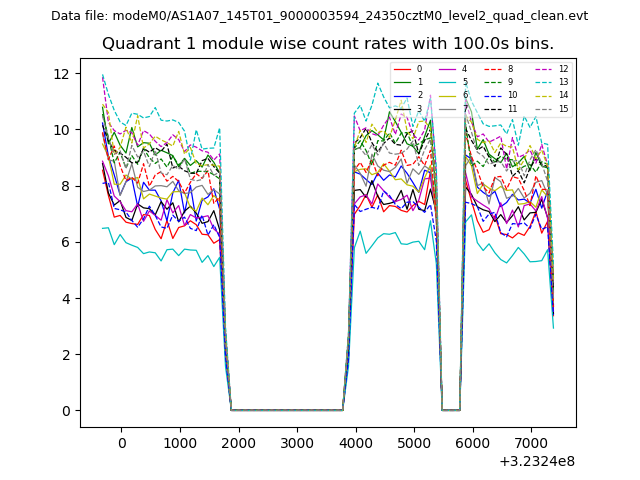
| Module-wise count rates for Quadrant A Data is divided into 100 sec bins |
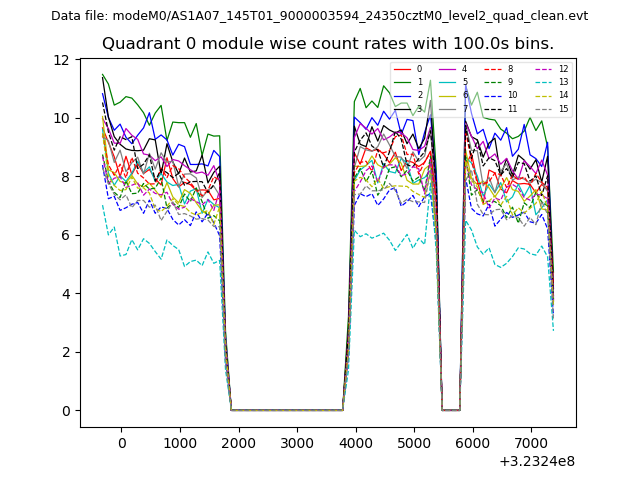 |
 |
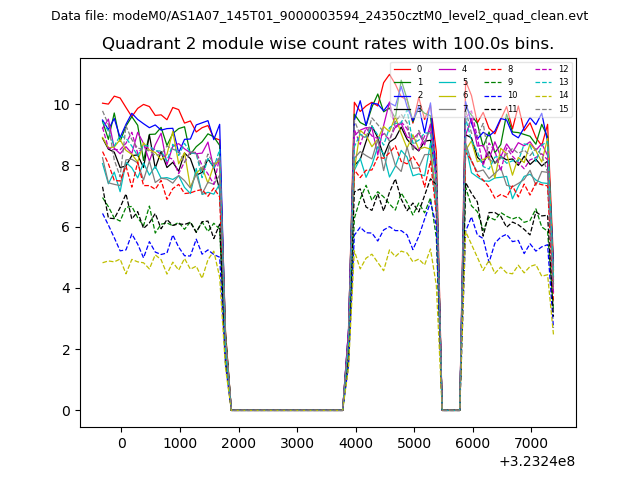
| Module-wise count rates for Quadrant B Data is divided into 100 sec bins |
 |
 |
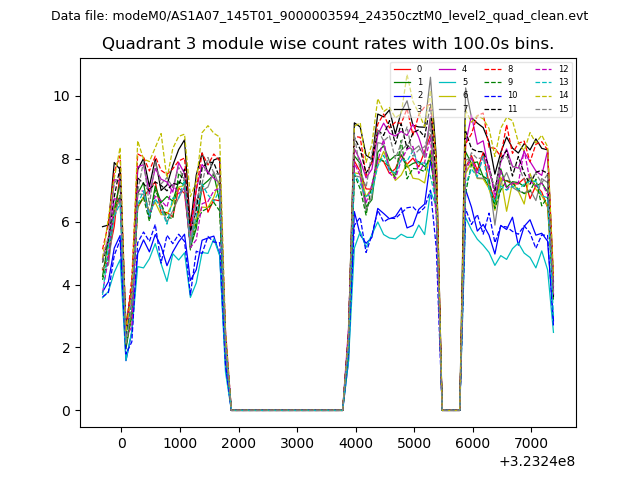
| Module-wise count rates for Quadrant C Data is divided into 100 sec bins |
 |
 |
| Module-wise count rates for Quadrant D Data is divided into 100 sec bins |
 |
 |
| Parameter | Plot |
|---|---|
| CZT HV Monitor | 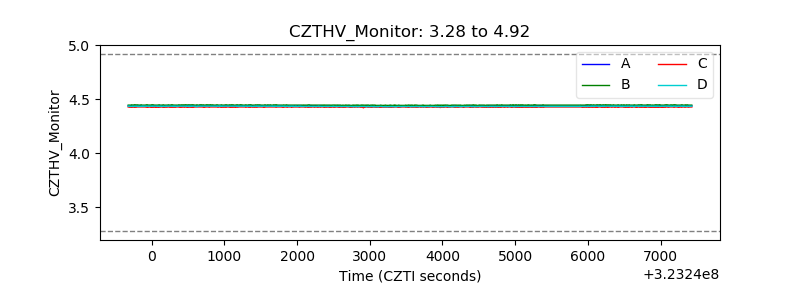 |
| D_VDD | 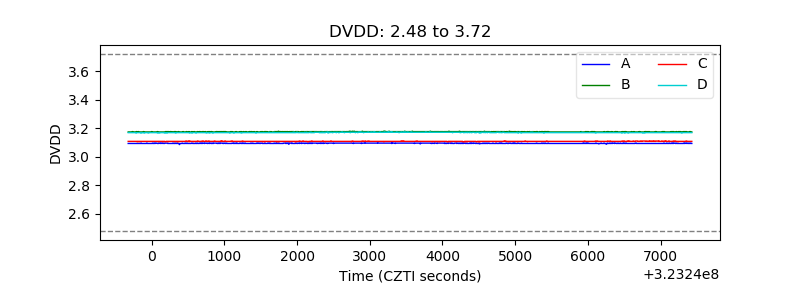 |
| Temperature 1 | 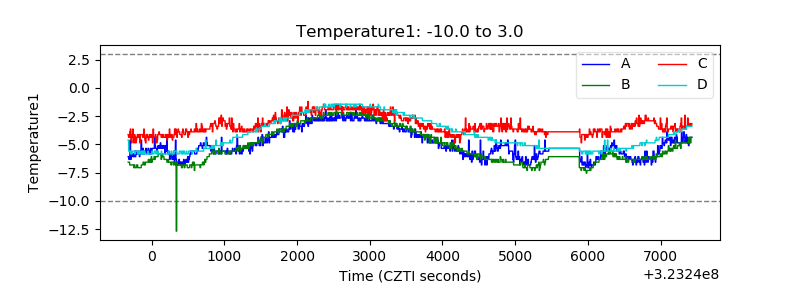 |
| Veto HV Monitor | 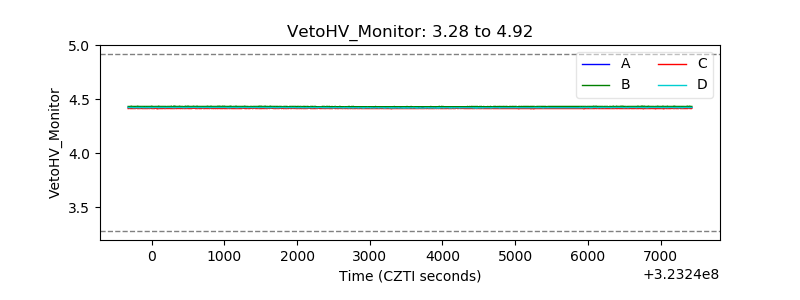 |
| Veto LLD | 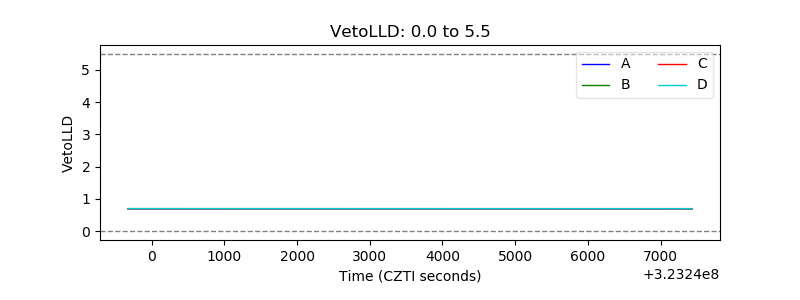 |
| Alpha Counter | 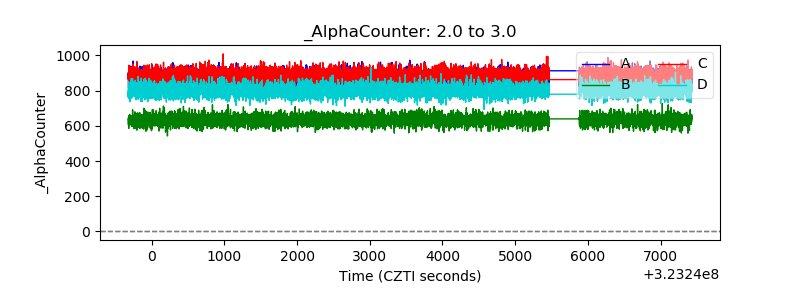 |
| _CPM_Rate | 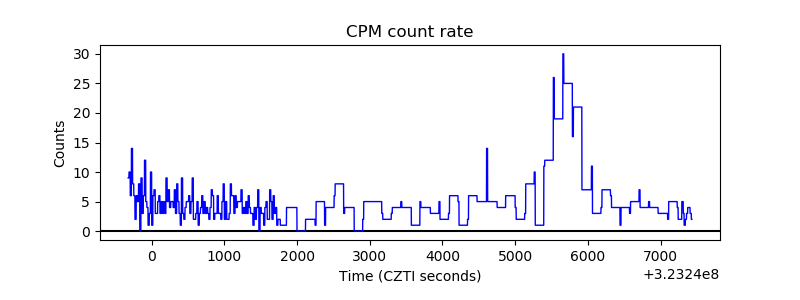 |
| CZT Counter | 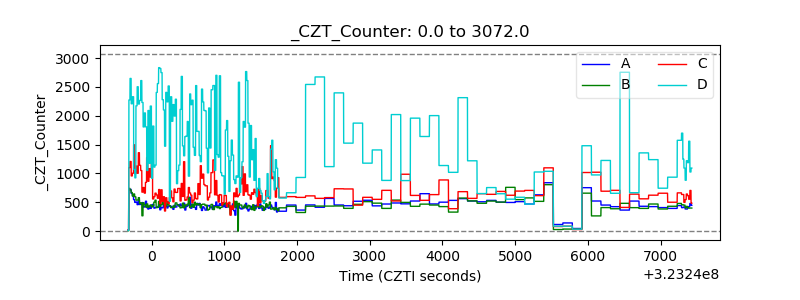 |
| +2.5 Volts monitor |  |
| +5 Volts monitor |  |
| _ROLL_ROT | 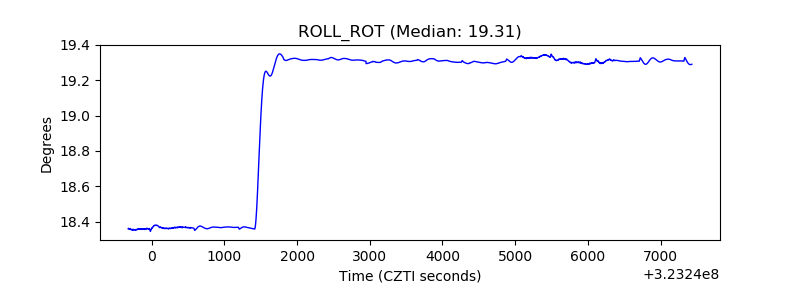 |
| _Roll_DEC | 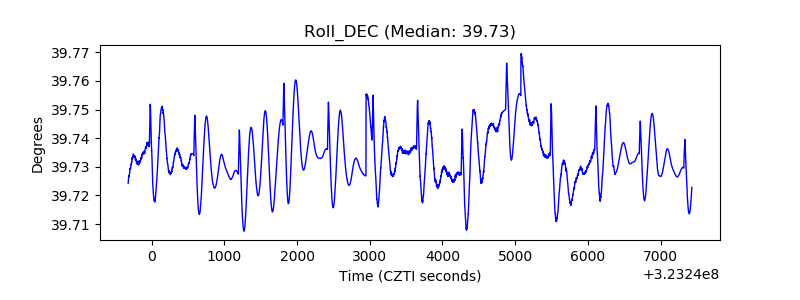 |
| _Roll_RA | 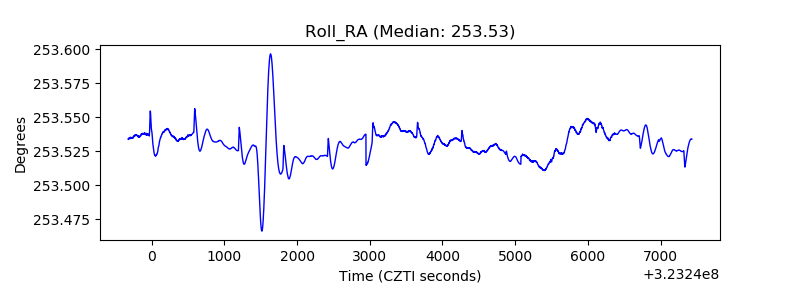 |
| Veto Counter | 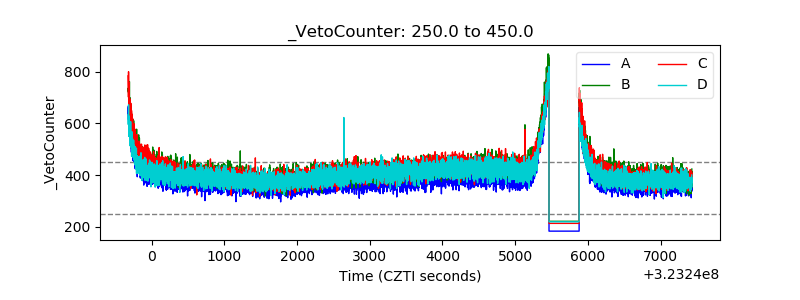 |