| Param | Original file | Final file |
|---|---|---|
| Filename | modeM0/AS1A07_145T01_9000003594_24351cztM0_level2.evt | modeM0/AS1A07_145T01_9000003594_24351cztM0_level2_quad_clean.evt |
| Size (bytes) | 1,782,547,200 | 223,738,560 |
| Size | 1.7 GB | 213.4 MB |
| Events in quadrant A | 8,304,820 | 1,421,189 |
| Events in quadrant B | 8,470,365 | 1,474,083 |
| Events in quadrant C | 13,773,350 | 1,390,014 |
| Events in quadrant D | 22,243,978 | 1,268,098 |
| Mode M0 | |||
|---|---|---|---|
| Quadrant | BADHDUFLAG | Total packets | Discarded packets |
| A | 0 | 36280 | 3 |
| B | 0 | 36474 | 3 |
| C | 0 | 53036 | 3 |
| D | 0 | 78648 | 3 |
| Mode M9 | |||
|---|---|---|---|
| Quadrant | BADHDUFLAG | Total packets | Discarded packets |
| A | 0 | 15 | 0 |
| B | 0 | 15 | 0 |
| C | 0 | 15 | 0 |
| D | 0 | 15 | 0 |
| Mode SS | |||
|---|---|---|---|
| Quadrant | BADHDUFLAG | Total packets | Discarded packets |
| A | 0 | 362 | 0 |
| B | 0 | 362 | 0 |
| C | 0 | 362 | 0 |
| D | 0 | 362 | 0 |
| Quadrant | Total seconds | Saturated seconds | Saturation percentage |
|---|---|---|---|
| A | 17719 | 239 | 1.348835% |
| B | 17720 | 288 | 1.625282% |
| C | 17720 | 792 | 4.469526% |
| D | 17720 | 3545 | 20.005643% |
Noise dominated data is calculated using 1-second bins in cleaned event files. If a bin has >2000 counts, and if more than 50% of those come from <1% of pixels, then it is considered to be noise-dominated and hence unusable.
| Quadrant | # 1 sec bins | Bins with >0 counts | Bins with >2000 counts | High rate bins dominated by noise | Noise dominated (total time) | Noise dominated (detector-on time) | Marked lightcurve |
|---|---|---|---|---|---|---|---|
| A | 19254 | 17721 | 0 | 0 | 0.00% | 0.00% | 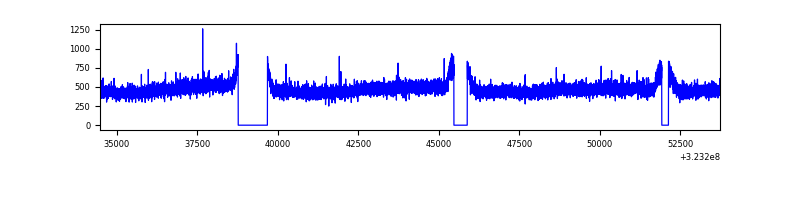 |
| B | 19255 | 17722 | 1 | 1 | 0.01% | 0.01% | 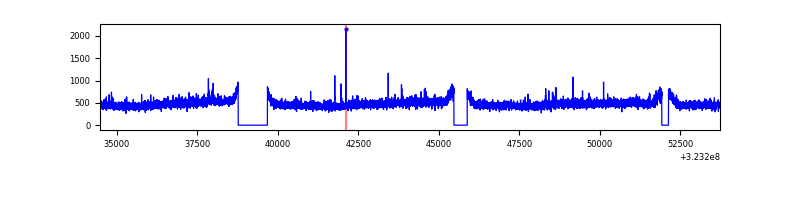 |
| C | 19255 | 17722 | 77 | 77 | 0.40% | 0.43% | 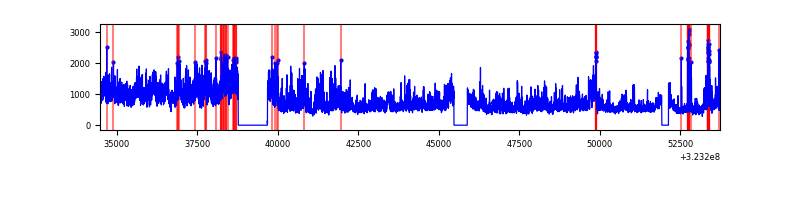 |
| D | 19255 | 17722 | 3015 | 3015 | 15.66% | 17.01% | 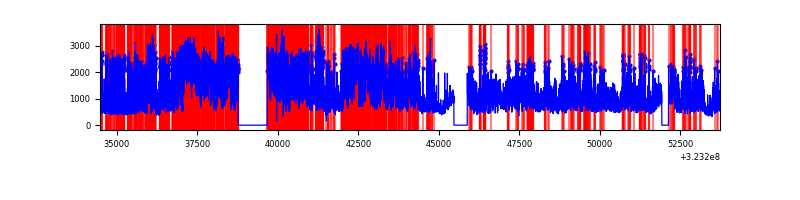 |
Top three noisy pixels from each quadrant. If the there are fewer than three noisy pixels in the level2.evt file, extra rows are filled as -1
| Pixel properties | Quadrant properties | ||||||
|---|---|---|---|---|---|---|---|
| Quadrant | DetID | PixID | Counts | Sigma | Mean | Median | Sigma |
| A | 13 | 254 | 24832 | 52.63 | 2151 | 2097 | 432.0 |
| A | 3 | 137 | 19859 | 41.12 | 2151 | 2097 | 432.0 |
| A | 0 | 226 | 18331 | 37.58 | 2151 | 2097 | 432.0 |
| B | 12 | 111 | 51554 | 119.26 | 2154 | 2096 | 414.7 |
| B | 11 | 111 | 45479 | 104.61 | 2154 | 2096 | 414.7 |
| B | 14 | 111 | 40552 | 92.73 | 2154 | 2096 | 414.7 |
| C | 7 | 247 | 5079323 | 10646.05 | 2050 | 2062 | 476.9 |
| C | 2 | 16 | 359967 | 750.46 | 2050 | 2062 | 476.9 |
| C | 14 | 238 | 323664 | 674.34 | 2050 | 2062 | 476.9 |
| D | 7 | 238 | 4575113 | 9874.59 | 1931 | 1876 | 463.1 |
| D | 12 | 218 | 3409860 | 7358.56 | 1931 | 1876 | 463.1 |
| D | 8 | 195 | 3305803 | 7133.88 | 1931 | 1876 | 463.1 |
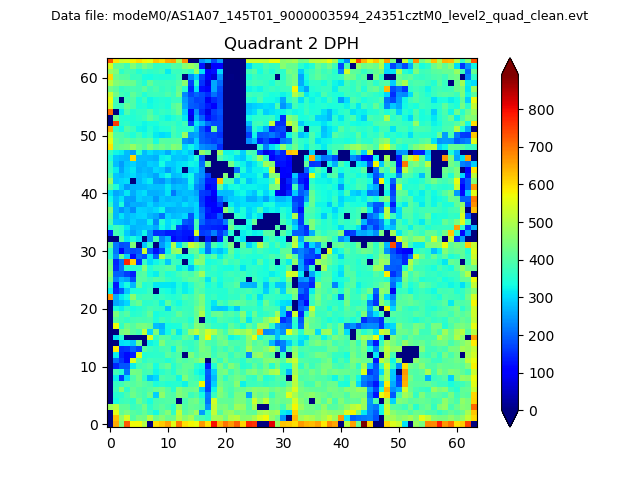
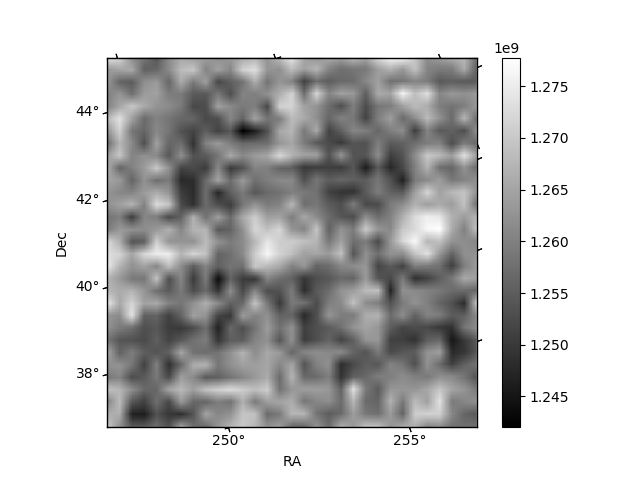
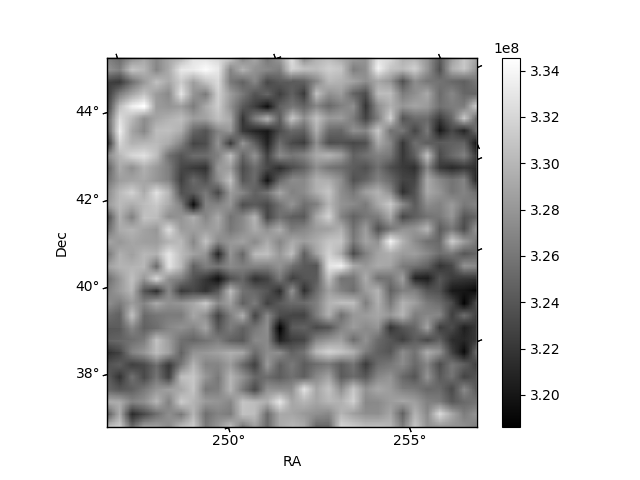
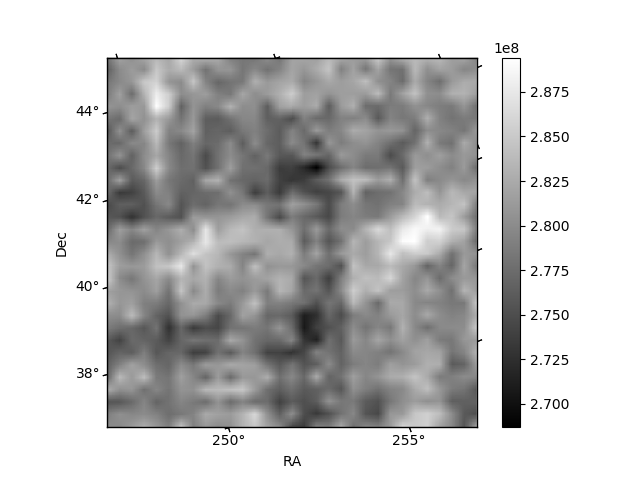
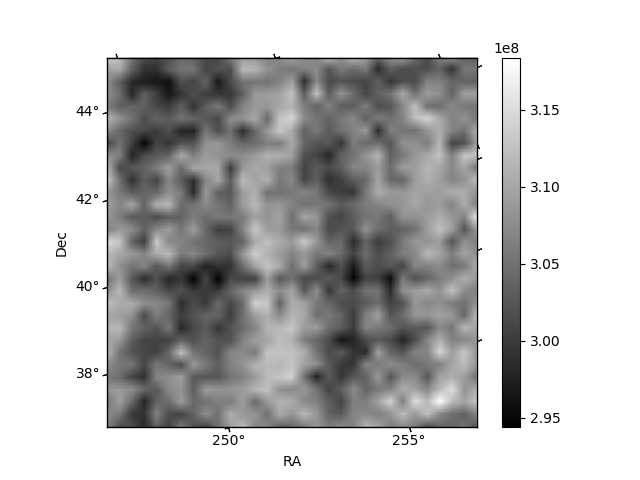
Histogram calculated using DETX and DETY for each event in the final _common_clean file
| Quadrant A | 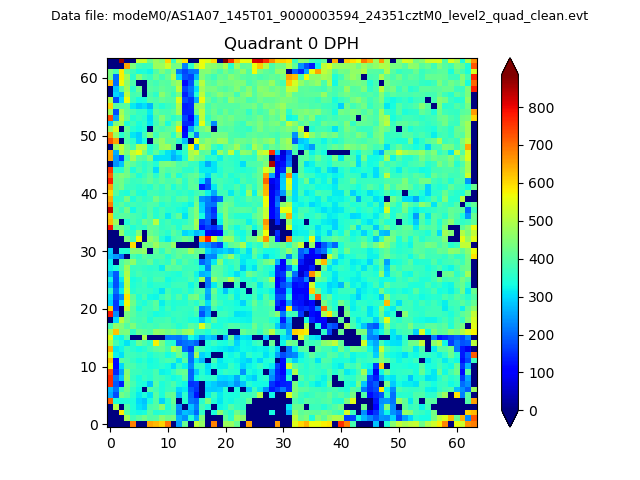 |
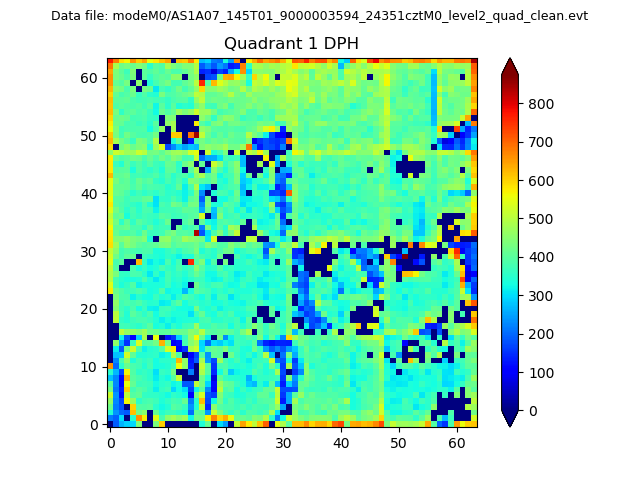 |
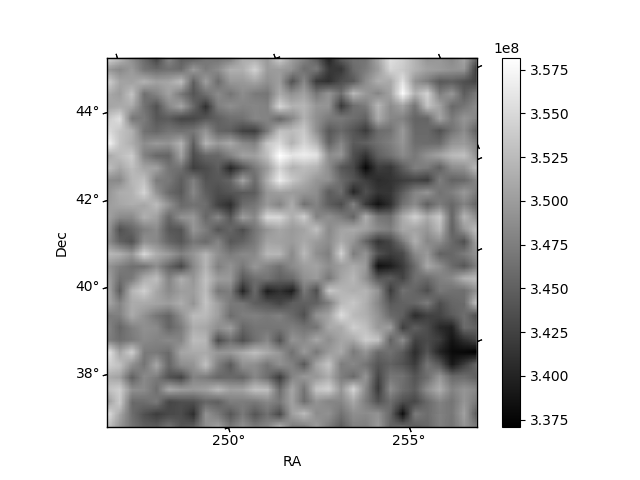
Quadrant B |
|---|---|---|---|
| Quadrant D | 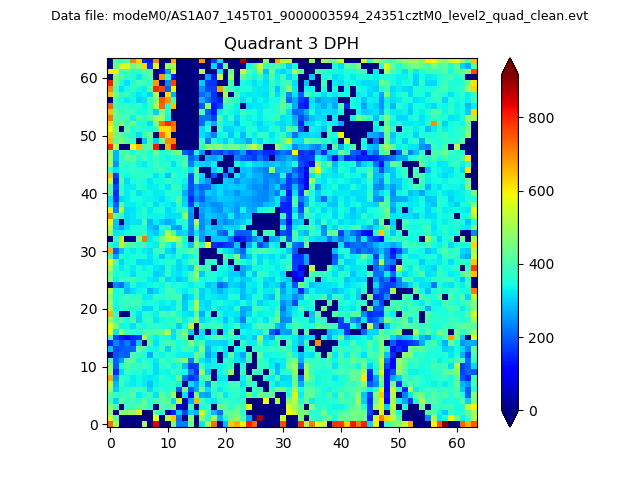 |
 |
Quadrant C |
| Plot type | Count rate plots | Images |
|---|---|---|
| Comparison with Poisson distribution Blue bars denote a histogram of data divided into 1 sec bins. Red curve is a Poisson curve with rate = median count rate of data. |
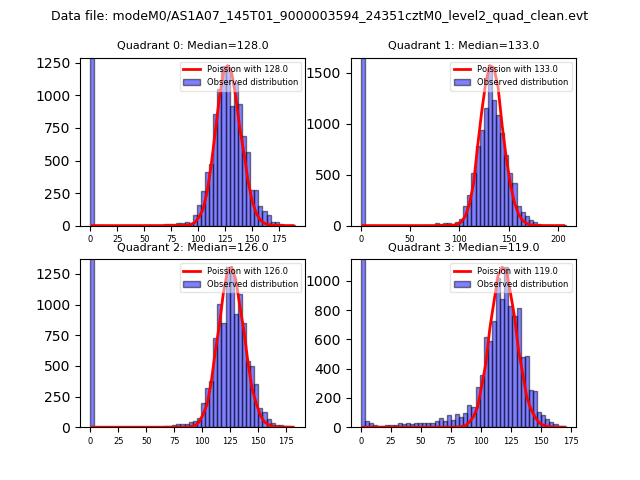 |
 |
| Quadrant-wise count rates Data is divided into 100 sec bins |
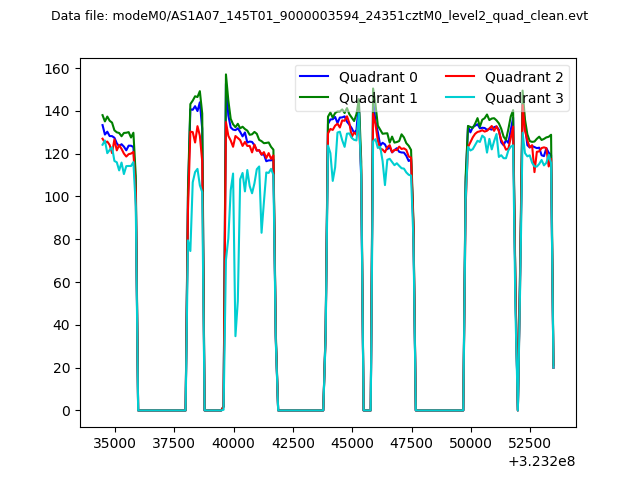 |
|
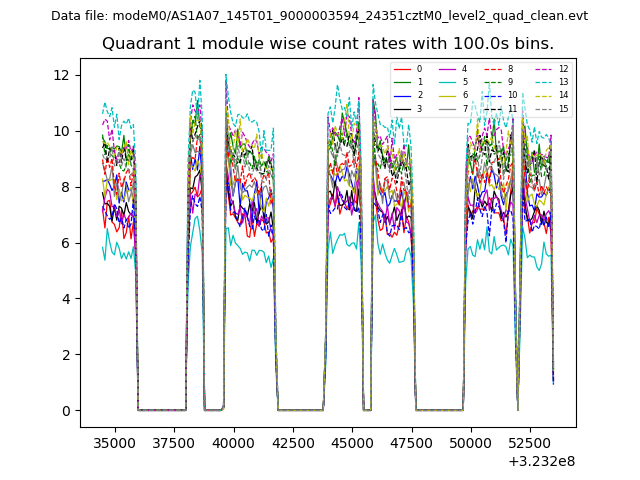
| Module-wise count rates for Quadrant A Data is divided into 100 sec bins |
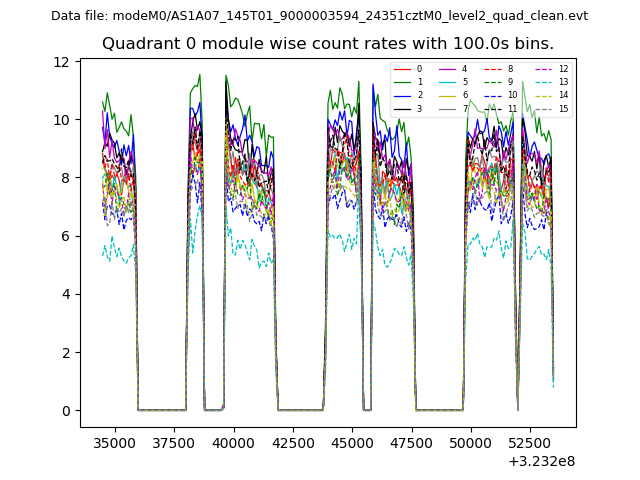 |
 |
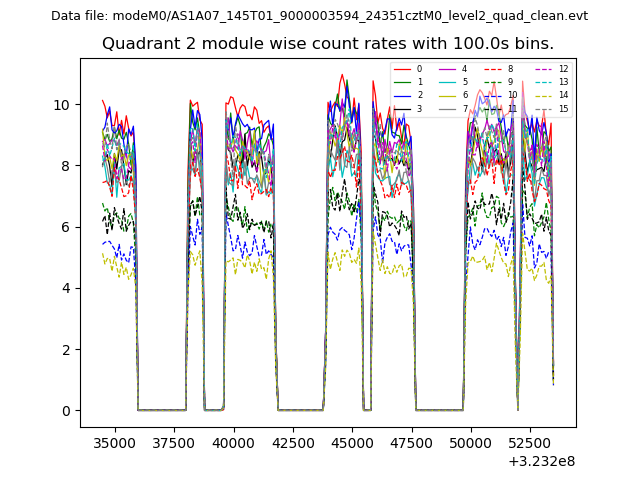
| Module-wise count rates for Quadrant B Data is divided into 100 sec bins |
 |
 |
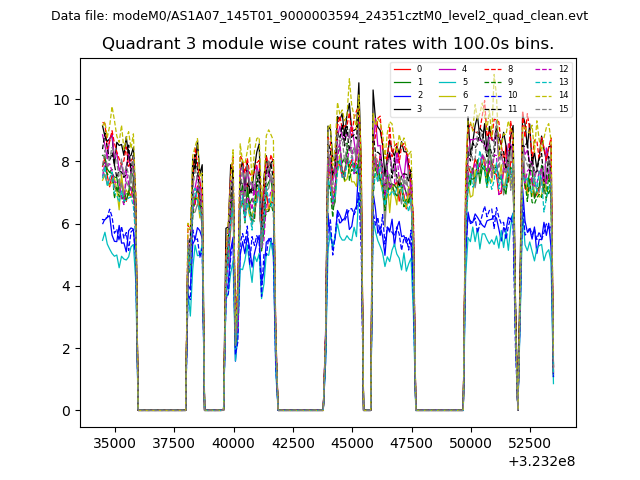
| Module-wise count rates for Quadrant C Data is divided into 100 sec bins |
 |
 |
| Module-wise count rates for Quadrant D Data is divided into 100 sec bins |
 |
 |
| Parameter | Plot |
|---|---|
| CZT HV Monitor | 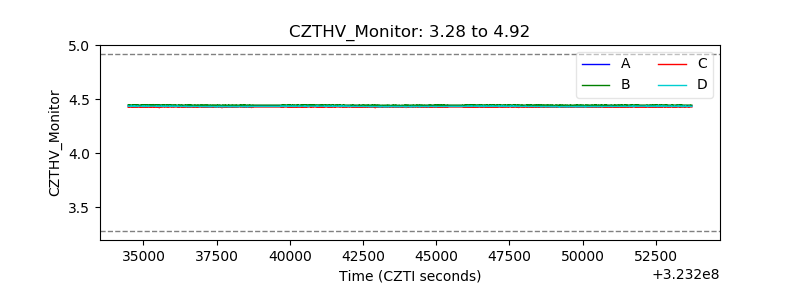 |
| D_VDD | 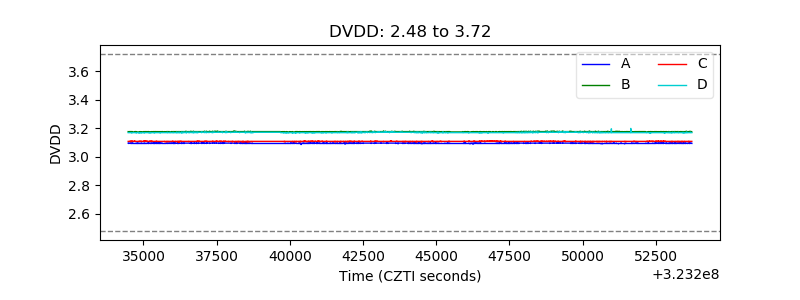 |
| Temperature 1 | 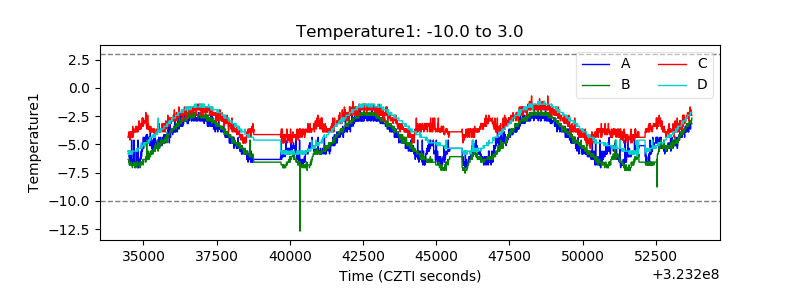 |
| Veto HV Monitor | 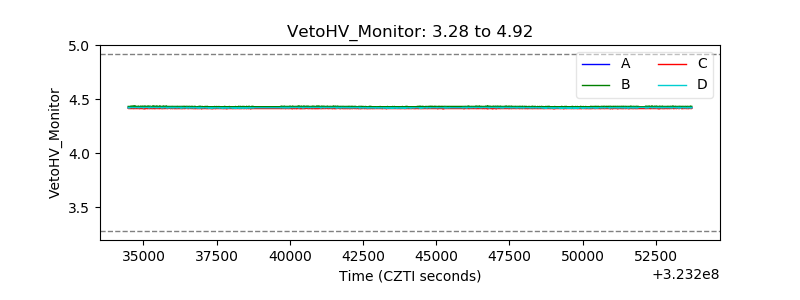 |
| Veto LLD | 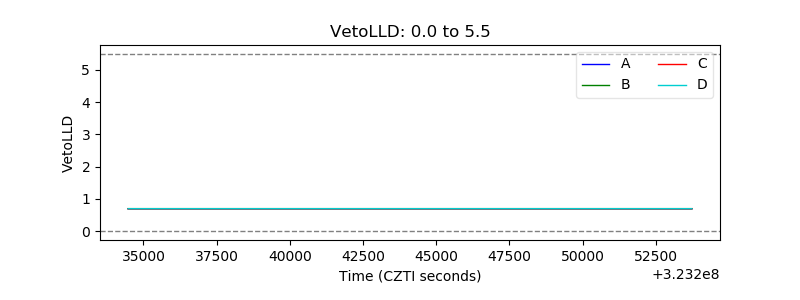 |
| Alpha Counter | 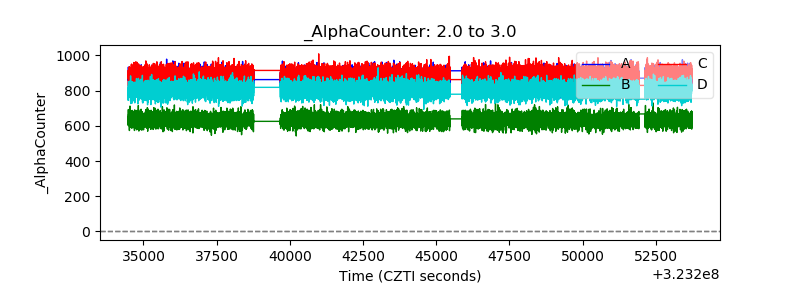 |
| _CPM_Rate | 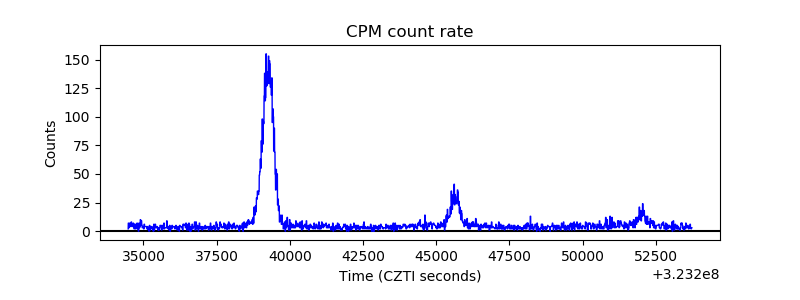 |
| CZT Counter | 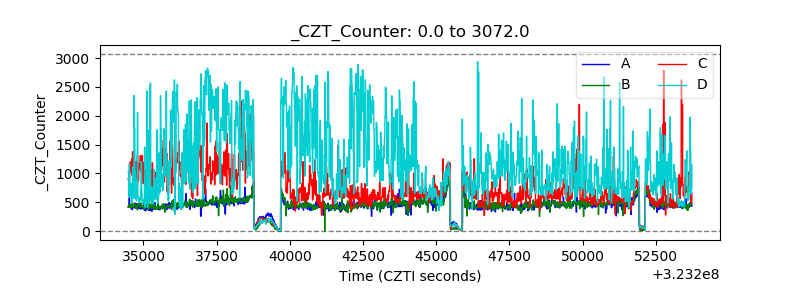 |
| +2.5 Volts monitor |  |
| +5 Volts monitor |  |
| _ROLL_ROT | 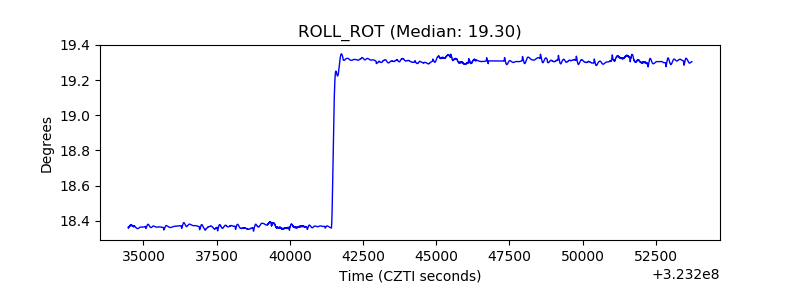 |
| _Roll_DEC | 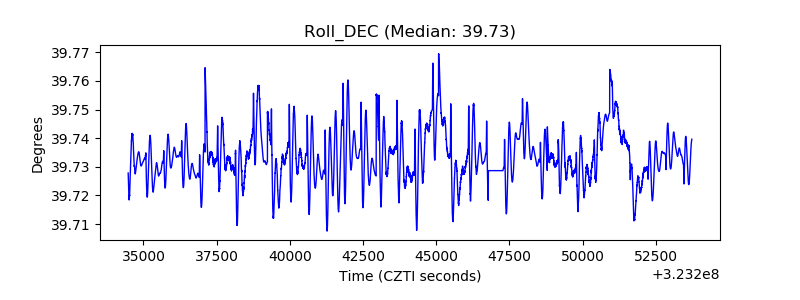 |
| _Roll_RA | 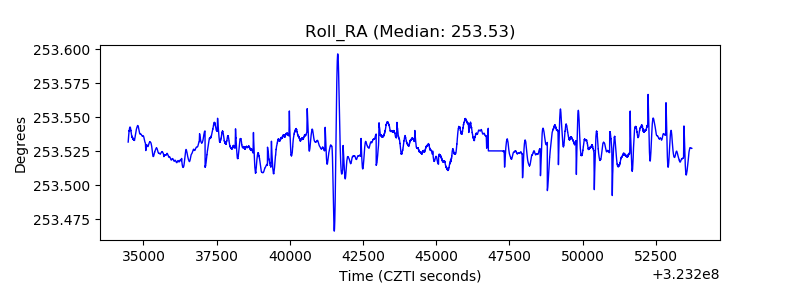 |
| Veto Counter | 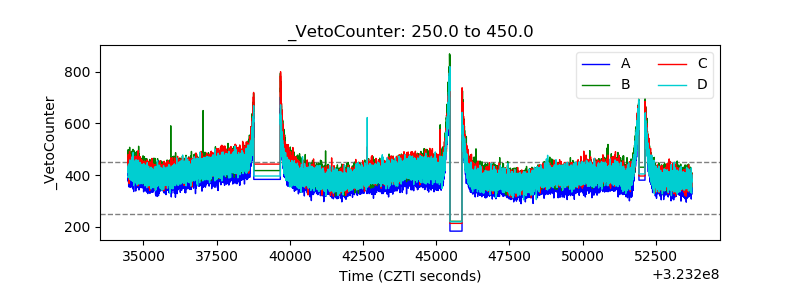 |