| Param | Original file | Final file |
|---|---|---|
| Filename | modeM0/AS1A07_145T01_9000003594_24352cztM0_level2.evt | modeM0/AS1A07_145T01_9000003594_24352cztM0_level2_quad_clean.evt |
| Size (bytes) | 556,384,320 | 86,146,560 |
| Size | 530.6 MB | 82.2 MB |
| Events in quadrant A | 3,284,460 | 532,591 |
| Events in quadrant B | 3,382,419 | 549,391 |
| Events in quadrant C | 4,754,933 | 522,097 |
| Events in quadrant D | 4,948,849 | 511,942 |
| Mode M0 | |||
|---|---|---|---|
| Quadrant | BADHDUFLAG | Total packets | Discarded packets |
| A | 0 | 14414 | 1 |
| B | 0 | 14604 | 1 |
| C | 0 | 18769 | 3 |
| D | 0 | 19319 | 1 |
| Mode M9 | |||
|---|---|---|---|
| Quadrant | BADHDUFLAG | Total packets | Discarded packets |
| A | 0 | 4 | 0 |
| B | 0 | 4 | 0 |
| C | 0 | 4 | 0 |
| D | 0 | 4 | 0 |
| Mode SS | |||
|---|---|---|---|
| Quadrant | BADHDUFLAG | Total packets | Discarded packets |
| A | 0 | 144 | 0 |
| B | 0 | 144 | 0 |
| C | 0 | 144 | 0 |
| D | 0 | 144 | 0 |
| Quadrant | Total seconds | Saturated seconds | Saturation percentage |
|---|---|---|---|
| A | 7075 | 118 | 1.667845% |
| B | 7076 | 126 | 1.780667% |
| C | 7075 | 341 | 4.819788% |
| D | 7075 | 263 | 3.717314% |
Noise dominated data is calculated using 1-second bins in cleaned event files. If a bin has >2000 counts, and if more than 50% of those come from <1% of pixels, then it is considered to be noise-dominated and hence unusable.
| Quadrant | # 1 sec bins | Bins with >0 counts | Bins with >2000 counts | High rate bins dominated by noise | Noise dominated (total time) | Noise dominated (detector-on time) | Marked lightcurve |
|---|---|---|---|---|---|---|---|
| A | 7380 | 7077 | 0 | 0 | 0.00% | 0.00% | 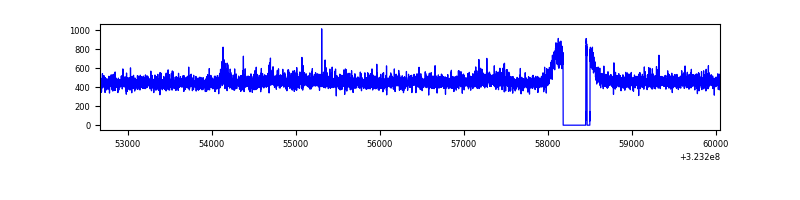 |
| B | 7381 | 7078 | 6 | 6 | 0.08% | 0.08% | 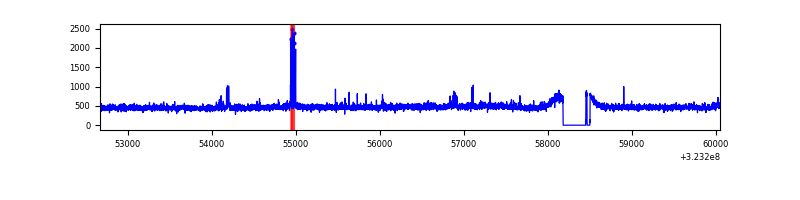 |
| C | 7380 | 7077 | 144 | 144 | 1.95% | 2.03% | 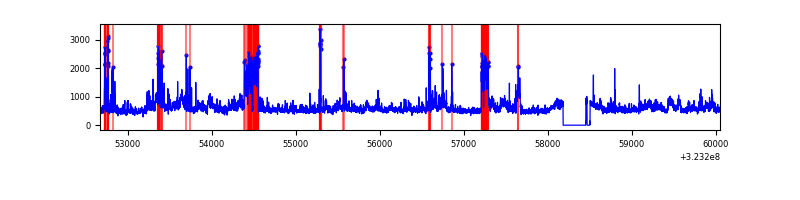 |
| D | 7380 | 7077 | 134 | 134 | 1.82% | 1.89% | 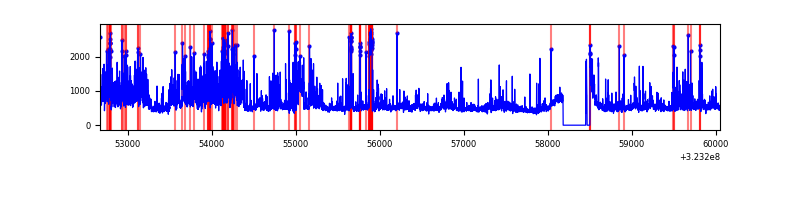 |
Top three noisy pixels from each quadrant. If the there are fewer than three noisy pixels in the level2.evt file, extra rows are filled as -1
| Pixel properties | Quadrant properties | ||||||
|---|---|---|---|---|---|---|---|
| Quadrant | DetID | PixID | Counts | Sigma | Mean | Median | Sigma |
| A | 3 | 1 | 13638 | 74.54 | 848 | 829 | 171.8 |
| A | 13 | 254 | 10117 | 54.05 | 848 | 829 | 171.8 |
| A | 3 | 137 | 8025 | 41.88 | 848 | 829 | 171.8 |
| B | 12 | 17 | 38445 | 230.27 | 844 | 822 | 163.4 |
| B | 0 | 190 | 21870 | 128.82 | 844 | 822 | 163.4 |
| B | 12 | 111 | 20013 | 117.46 | 844 | 822 | 163.4 |
| C | 2 | 16 | 815199 | 4303.71 | 805 | 808 | 189.2 |
| C | 7 | 247 | 670382 | 3538.41 | 805 | 808 | 189.2 |
| C | 14 | 238 | 128078 | 672.57 | 805 | 808 | 189.2 |
| D | 8 | 195 | 967851 | 4815.58 | 817 | 789 | 200.8 |
| D | 1 | 52 | 474727 | 2360.02 | 817 | 789 | 200.8 |
| D | 7 | 238 | 182016 | 902.44 | 817 | 789 | 200.8 |
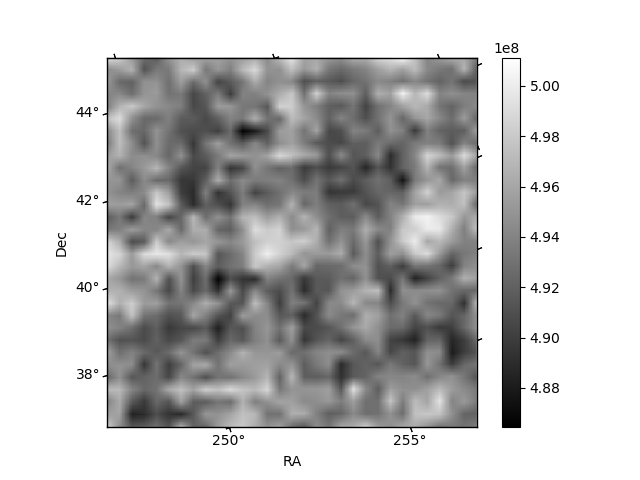
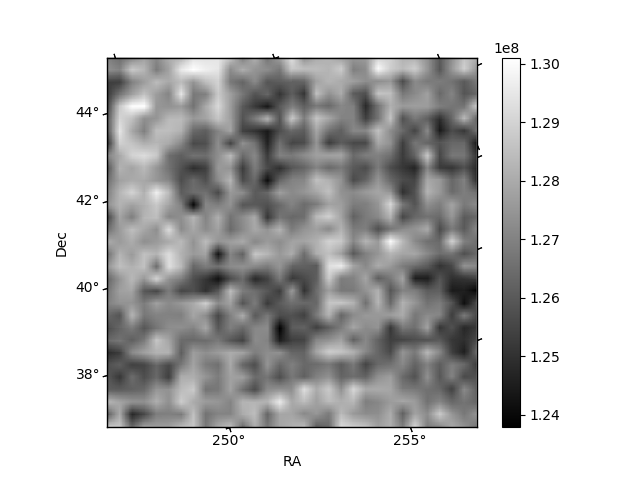
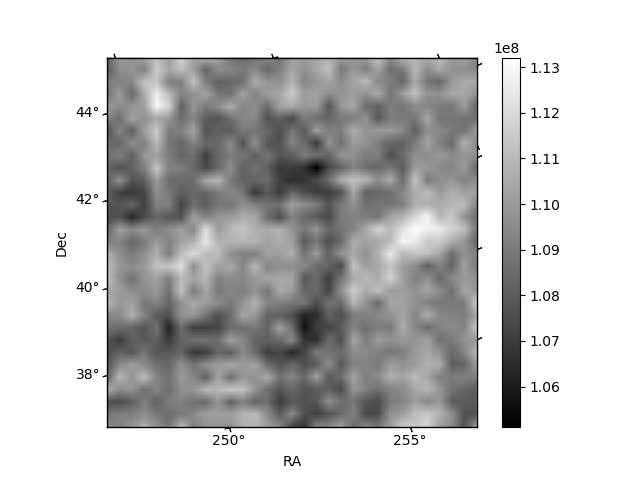
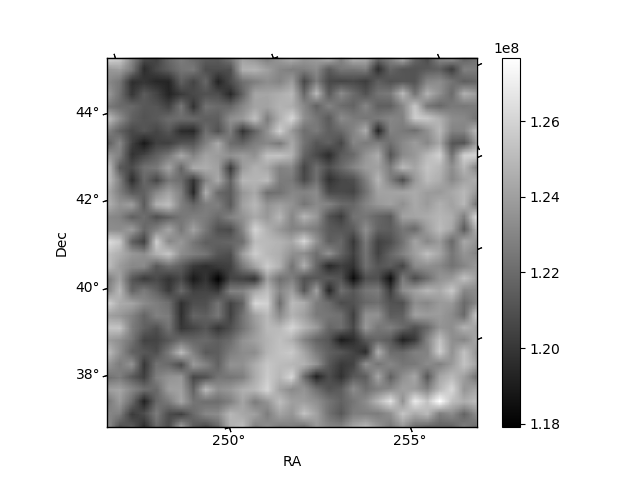
Histogram calculated using DETX and DETY for each event in the final _common_clean file
| Quadrant A | 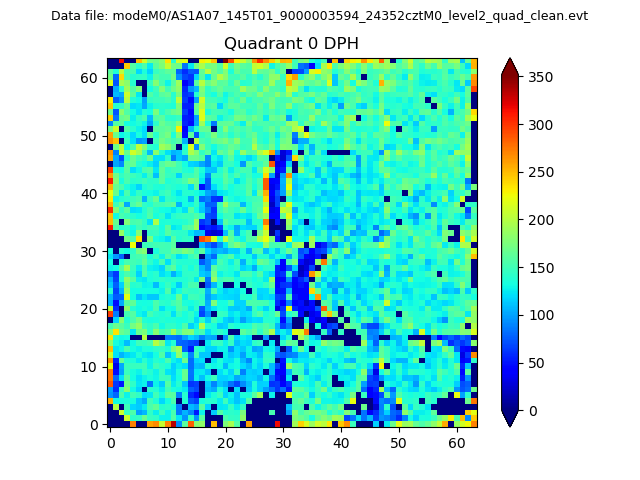 |
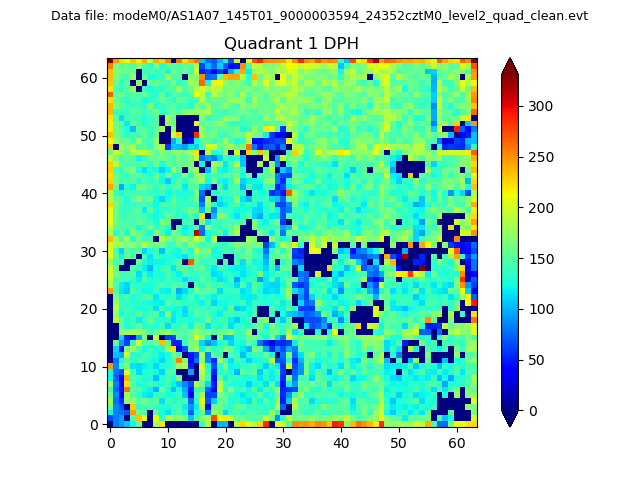 |
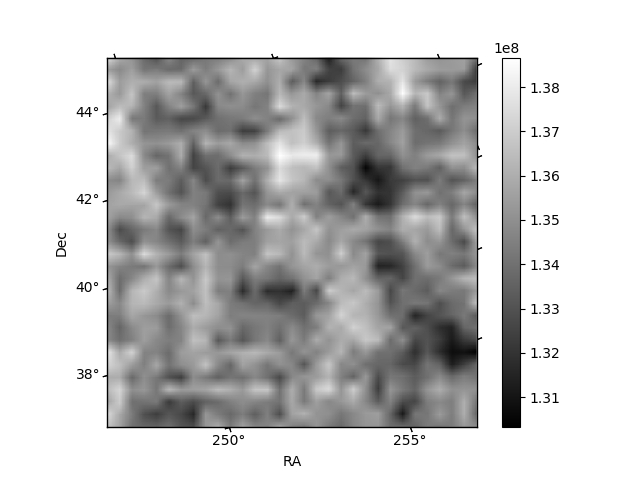
Quadrant B |
|---|---|---|---|
| Quadrant D | 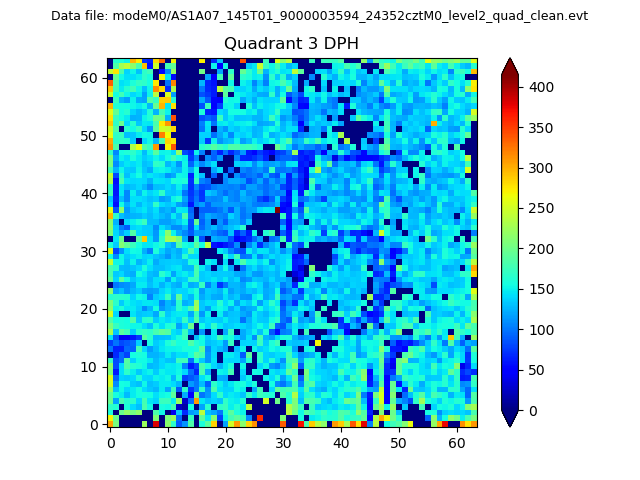 |
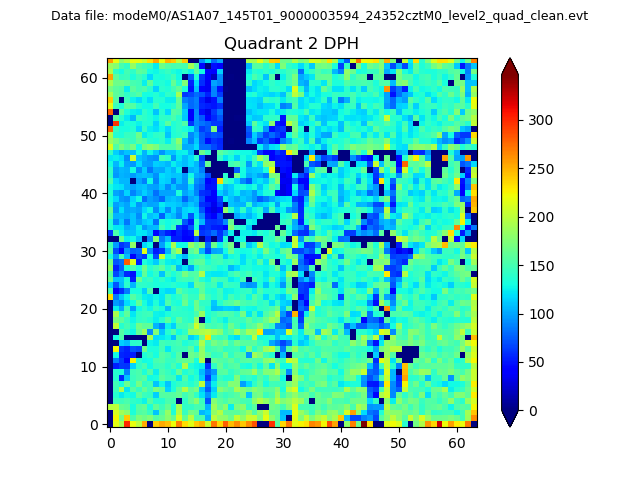 |
Quadrant C |
| Plot type | Count rate plots | Images |
|---|---|---|
| Comparison with Poisson distribution Blue bars denote a histogram of data divided into 1 sec bins. Red curve is a Poisson curve with rate = median count rate of data. |
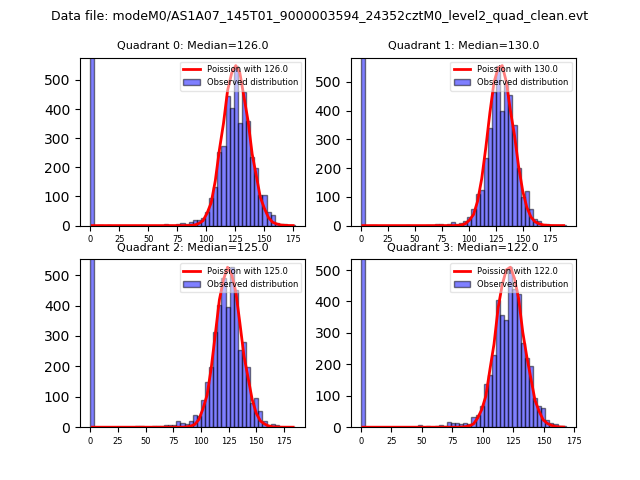 |
 |
| Quadrant-wise count rates Data is divided into 100 sec bins |
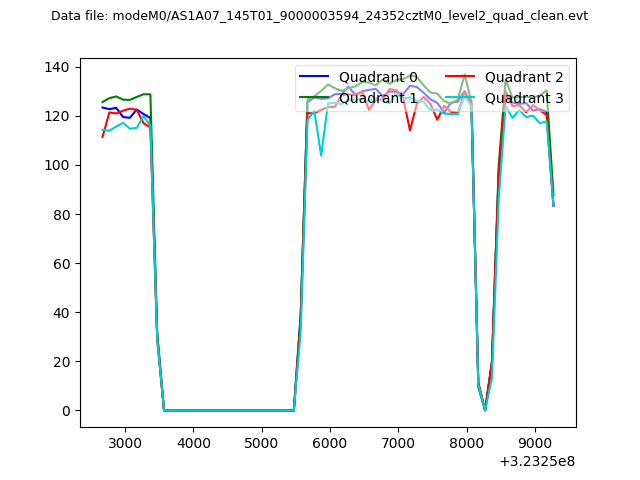 |
|
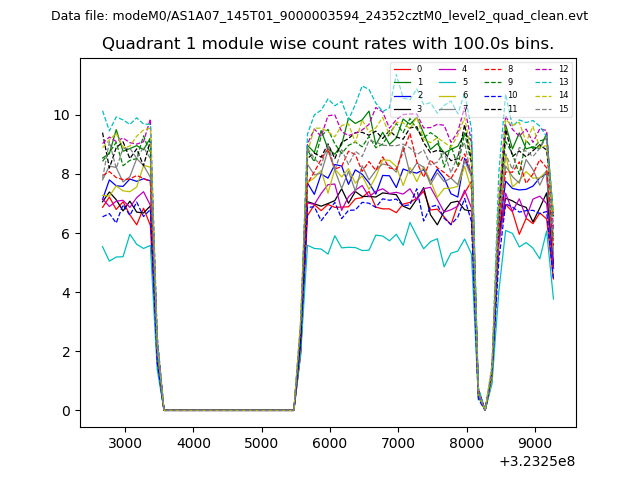
| Module-wise count rates for Quadrant A Data is divided into 100 sec bins |
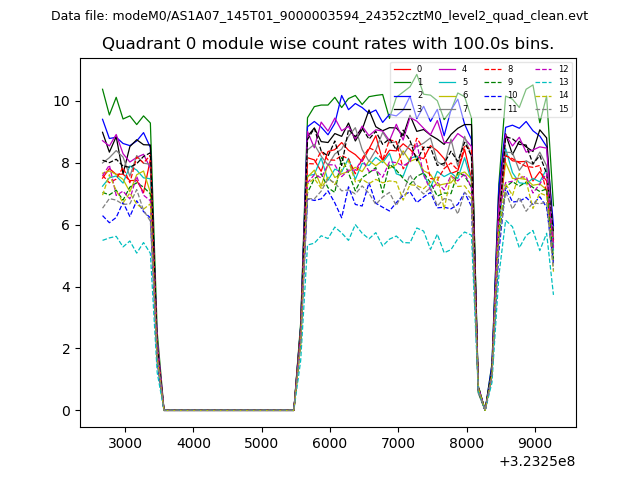 |
 |
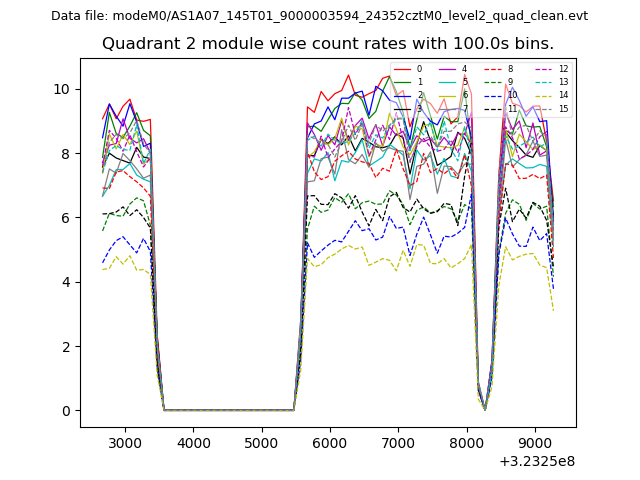
| Module-wise count rates for Quadrant B Data is divided into 100 sec bins |
 |
 |
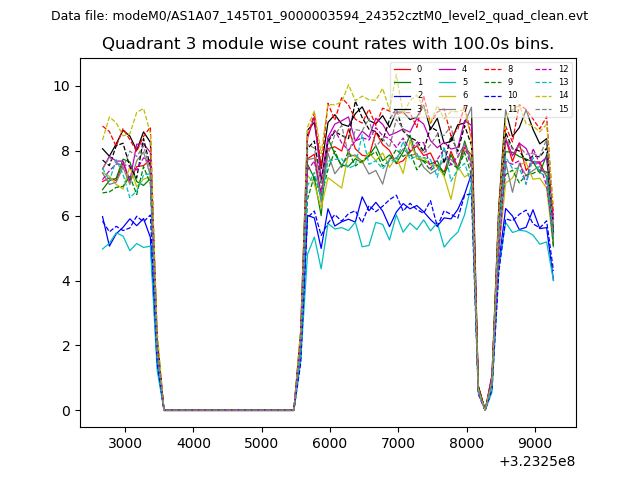
| Module-wise count rates for Quadrant C Data is divided into 100 sec bins |
 |
 |
| Module-wise count rates for Quadrant D Data is divided into 100 sec bins |
 |
 |
| Parameter | Plot |
|---|---|
| CZT HV Monitor | 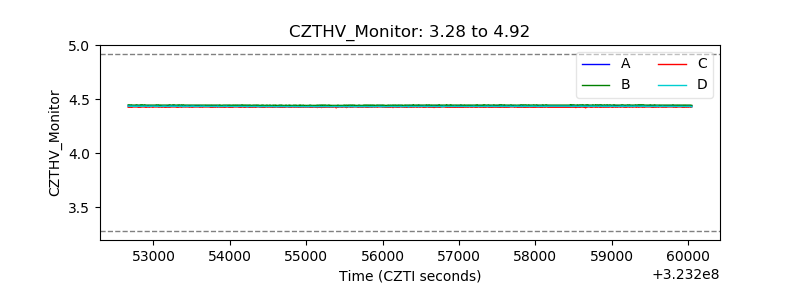 |
| D_VDD | 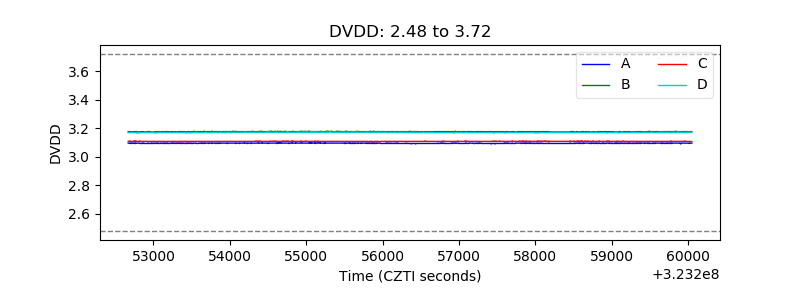 |
| Temperature 1 | 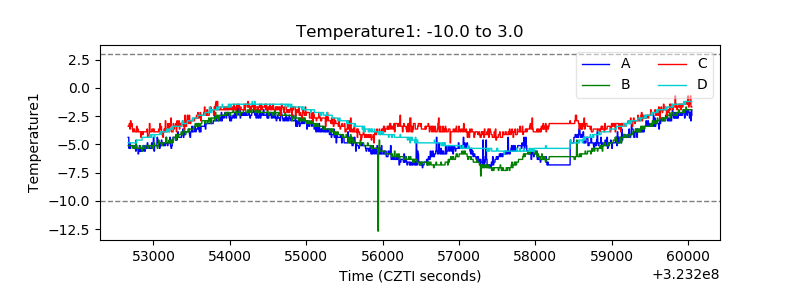 |
| Veto HV Monitor | 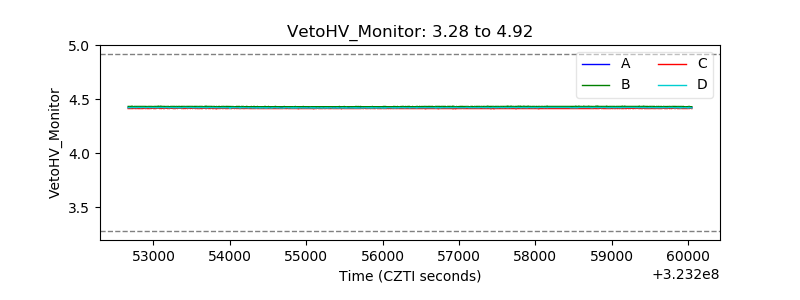 |
| Veto LLD | 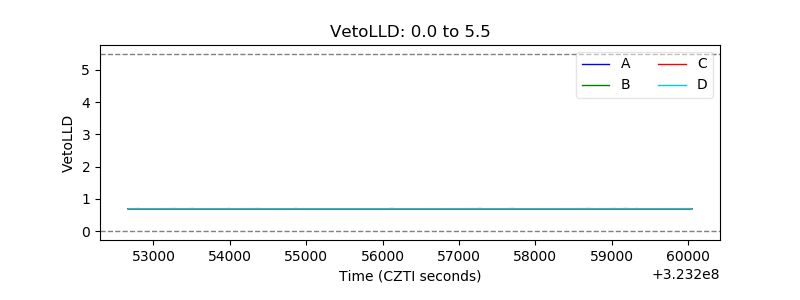 |
| Alpha Counter | 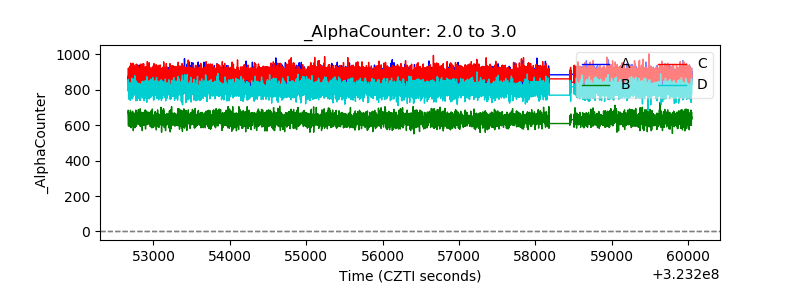 |
| _CPM_Rate | 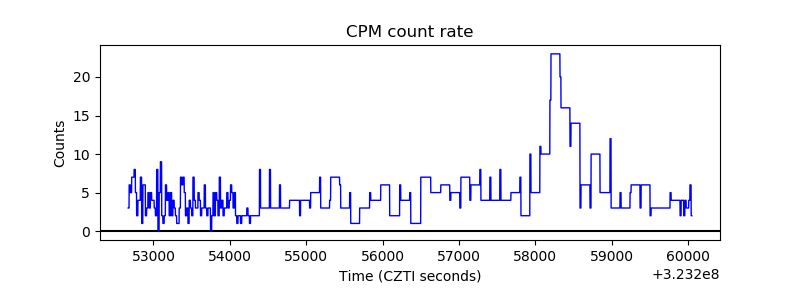 |
| CZT Counter | 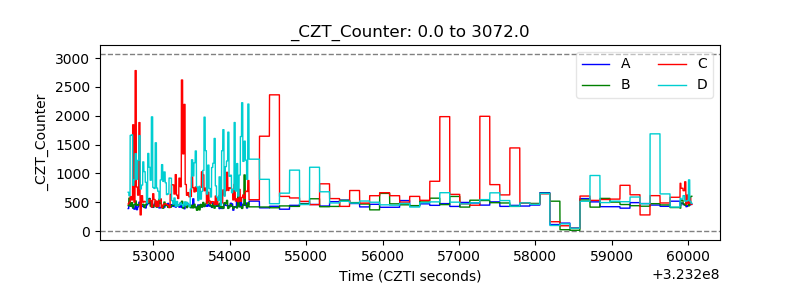 |
| +2.5 Volts monitor | 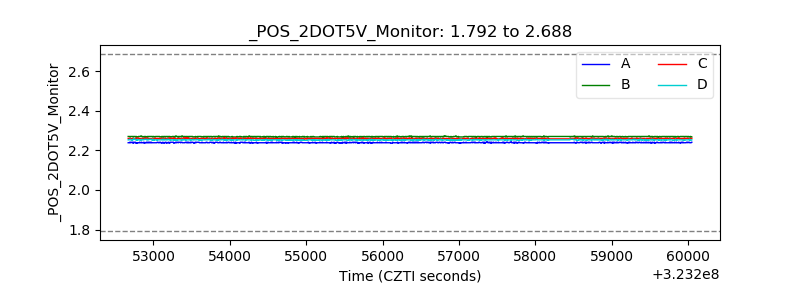 |
| +5 Volts monitor | 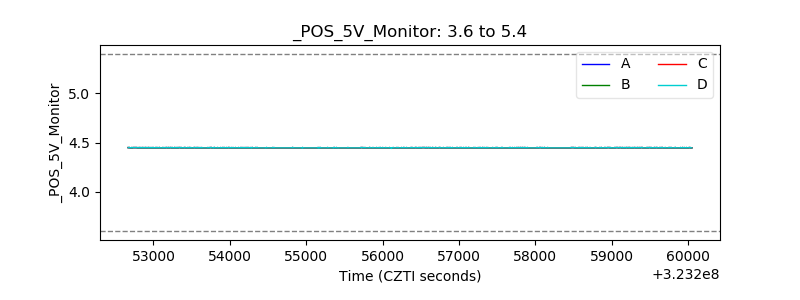 |
| _ROLL_ROT | 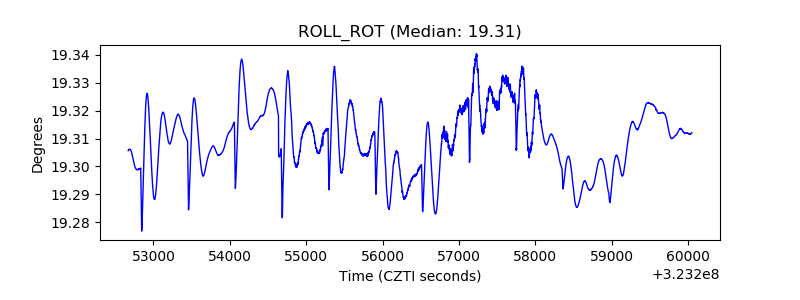 |
| _Roll_DEC | 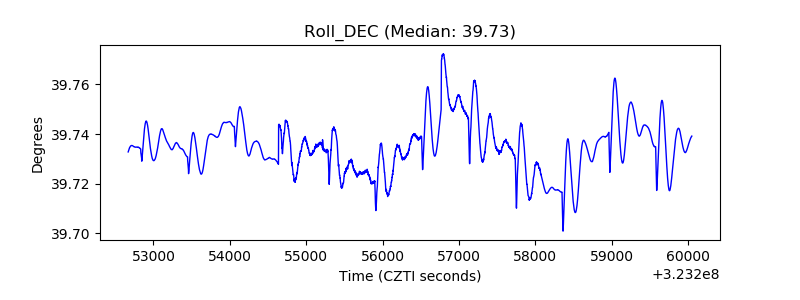 |
| _Roll_RA | 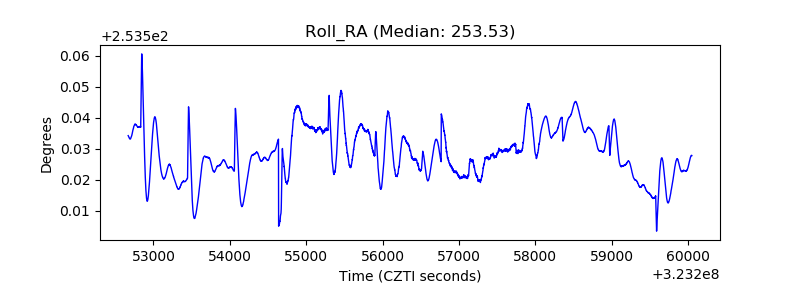 |
| Veto Counter | 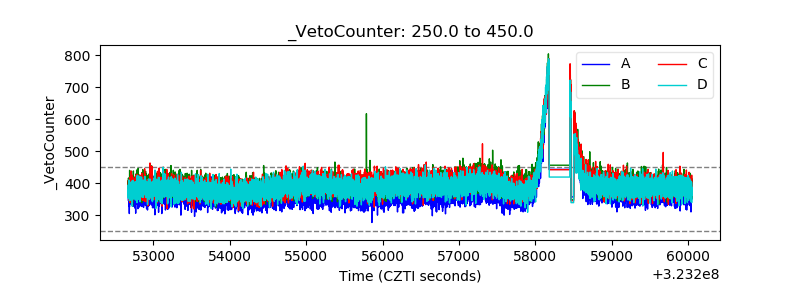 |