| Param | Original file | Final file |
|---|---|---|
| Filename | modeM0/AS1A07_145T01_9000003594_24355cztM0_level2.evt | modeM0/AS1A07_145T01_9000003594_24355cztM0_level2_quad_clean.evt |
| Size (bytes) | 1,585,563,840 | 213,641,280 |
| Size | 1.5 GB | 203.7 MB |
| Events in quadrant A | 8,637,111 | 1,337,166 |
| Events in quadrant B | 8,865,655 | 1,364,167 |
| Events in quadrant C | 10,332,984 | 1,315,062 |
| Events in quadrant D | 18,940,911 | 1,184,613 |
| Mode M0 | |||
|---|---|---|---|
| Quadrant | BADHDUFLAG | Total packets | Discarded packets |
| A | 0 | 37605 | 3 |
| B | 0 | 37978 | 3 |
| C | 0 | 42101 | 3 |
| D | 0 | 68334 | 3 |
| Mode M9 | |||
|---|---|---|---|
| Quadrant | BADHDUFLAG | Total packets | Discarded packets |
| A | 0 | 20 | 0 |
| B | 0 | 20 | 0 |
| C | 0 | 20 | 0 |
| D | 0 | 20 | 0 |
| Mode SS | |||
|---|---|---|---|
| Quadrant | BADHDUFLAG | Total packets | Discarded packets |
| A | 0 | 372 | 0 |
| B | 0 | 372 | 0 |
| C | 0 | 372 | 0 |
| D | 0 | 372 | 0 |
| Quadrant | Total seconds | Saturated seconds | Saturation percentage |
|---|---|---|---|
| A | 18417 | 212 | 1.151110% |
| B | 18418 | 251 | 1.362797% |
| C | 18417 | 397 | 2.155617% |
| D | 18417 | 3633 | 19.726340% |
Noise dominated data is calculated using 1-second bins in cleaned event files. If a bin has >2000 counts, and if more than 50% of those come from <1% of pixels, then it is considered to be noise-dominated and hence unusable.
| Quadrant | # 1 sec bins | Bins with >0 counts | Bins with >2000 counts | High rate bins dominated by noise | Noise dominated (total time) | Noise dominated (detector-on time) | Marked lightcurve |
|---|---|---|---|---|---|---|---|
| A | 20367 | 18420 | 0 | 0 | 0.00% | 0.00% | 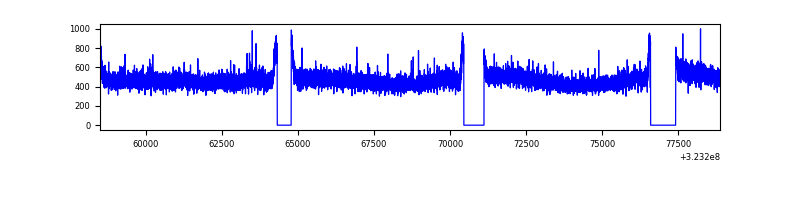 |
| B | 20368 | 18421 | 16 | 16 | 0.08% | 0.09% | 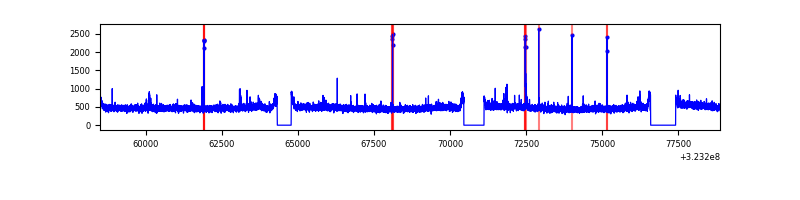 |
| C | 20367 | 18420 | 13 | 13 | 0.06% | 0.07% | 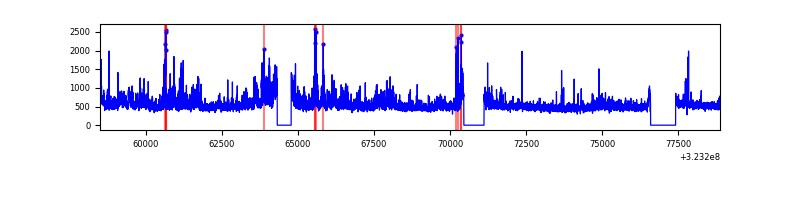 |
| D | 20367 | 18420 | 3378 | 3378 | 16.59% | 18.34% | 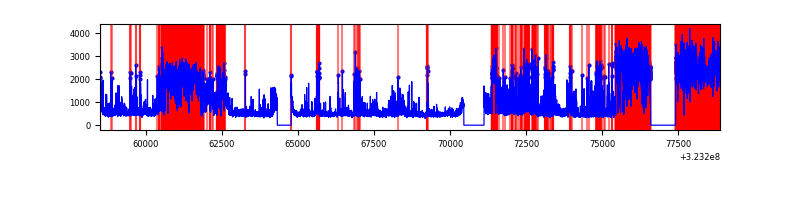 |
Top three noisy pixels from each quadrant. If the there are fewer than three noisy pixels in the level2.evt file, extra rows are filled as -1
| Pixel properties | Quadrant properties | ||||||
|---|---|---|---|---|---|---|---|
| Quadrant | DetID | PixID | Counts | Sigma | Mean | Median | Sigma |
| A | 13 | 254 | 27202 | 55.67 | 2241 | 2192 | 449.3 |
| A | 3 | 137 | 20666 | 41.12 | 2241 | 2192 | 449.3 |
| A | 0 | 226 | 19319 | 38.12 | 2241 | 2192 | 449.3 |
| B | 12 | 111 | 53761 | 119.12 | 2232 | 2176 | 433.1 |
| B | 11 | 111 | 47891 | 105.56 | 2232 | 2176 | 433.1 |
| B | 5 | 172 | 44893 | 98.64 | 2232 | 2176 | 433.1 |
| C | 7 | 247 | 972004 | 1943.74 | 2145 | 2158 | 499.0 |
| C | 2 | 16 | 646213 | 1290.8 | 2145 | 2158 | 499.0 |
| C | 14 | 238 | 339940 | 676.97 | 2145 | 2158 | 499.0 |
| D | 1 | 52 | 5845008 | 12447.96 | 1930 | 1870 | 469.4 |
| D | 7 | 238 | 3908747 | 8323.03 | 1930 | 1870 | 469.4 |
| D | 9 | 35 | 922690 | 1961.67 | 1930 | 1870 | 469.4 |
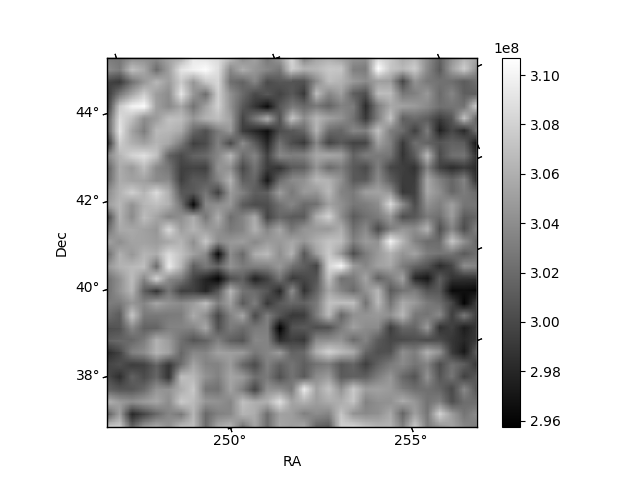
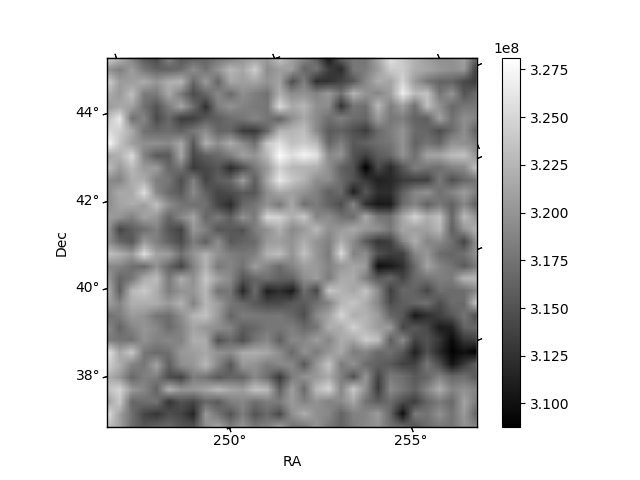
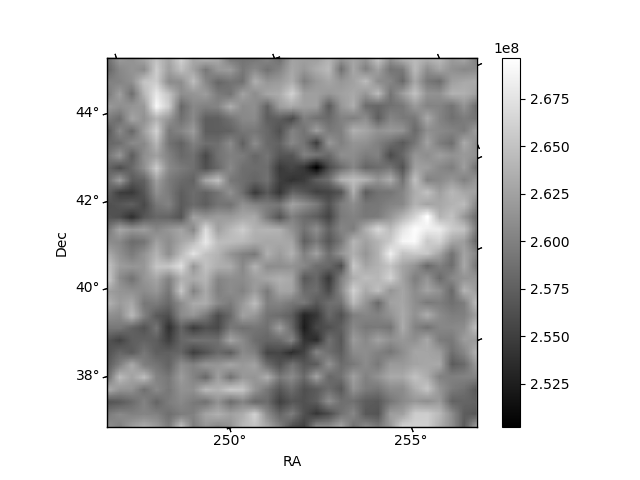
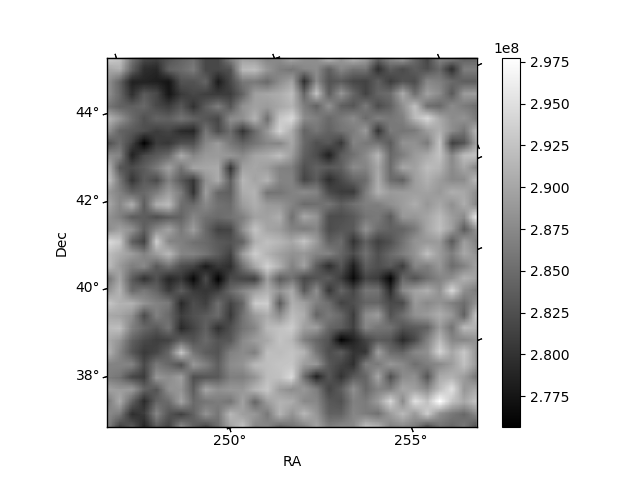
Histogram calculated using DETX and DETY for each event in the final _common_clean file
| Quadrant A | 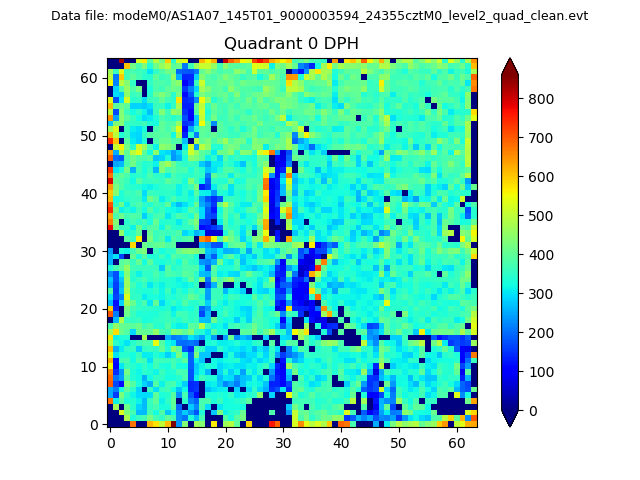 |
 |
Quadrant B |
|---|---|---|---|
| Quadrant D | 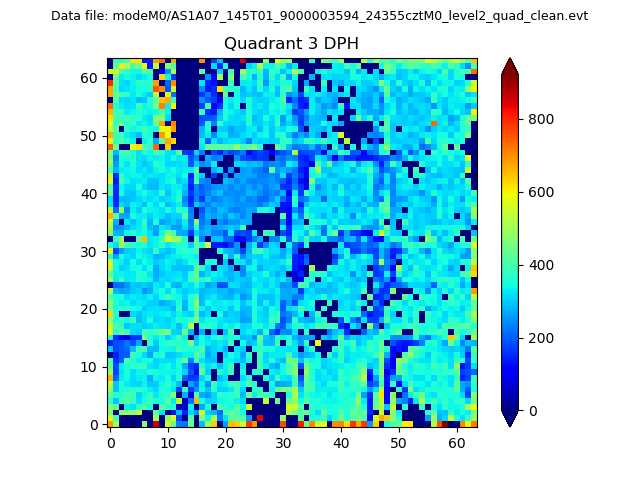 |
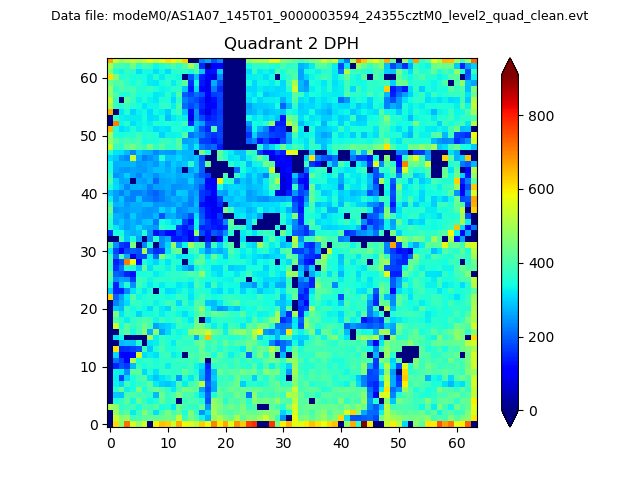 |
Quadrant C |
| Plot type | Count rate plots | Images |
|---|---|---|
| Comparison with Poisson distribution Blue bars denote a histogram of data divided into 1 sec bins. Red curve is a Poisson curve with rate = median count rate of data. |
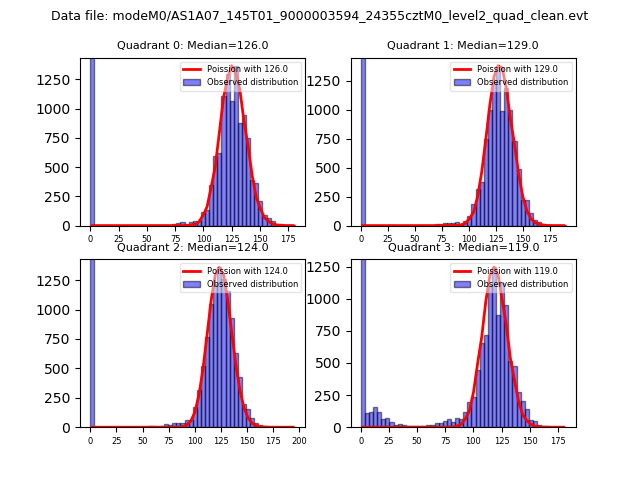 |
 |
| Quadrant-wise count rates Data is divided into 100 sec bins |
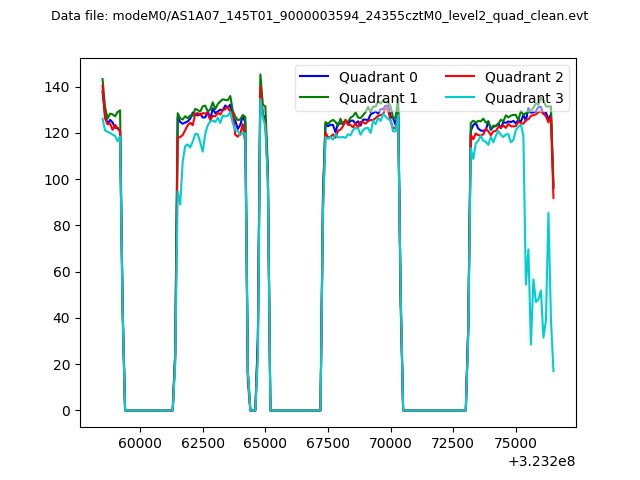 |
|
| Module-wise count rates for Quadrant A Data is divided into 100 sec bins |
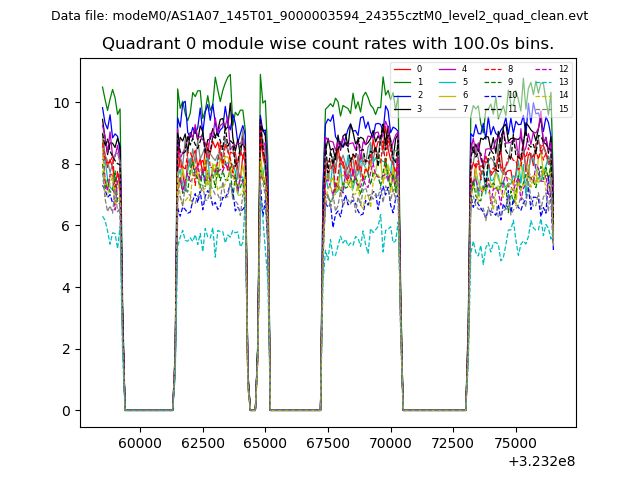 |
 |
| Module-wise count rates for Quadrant B Data is divided into 100 sec bins |
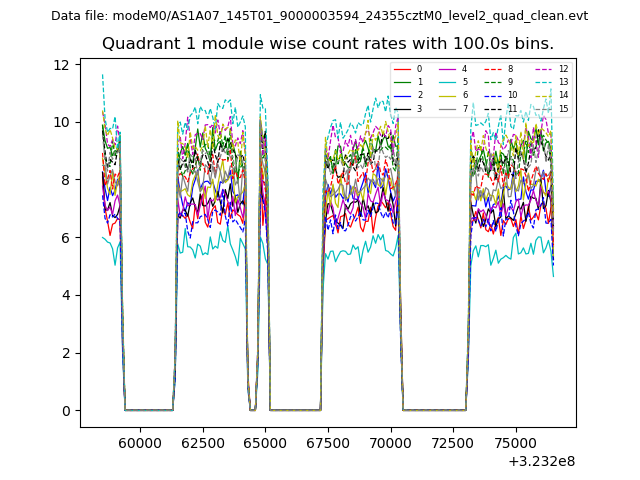 |
 |
| Module-wise count rates for Quadrant C Data is divided into 100 sec bins |
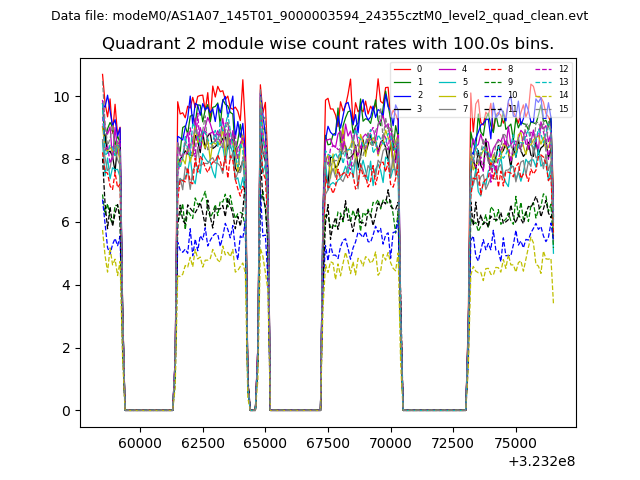 |
 |
| Module-wise count rates for Quadrant D Data is divided into 100 sec bins |
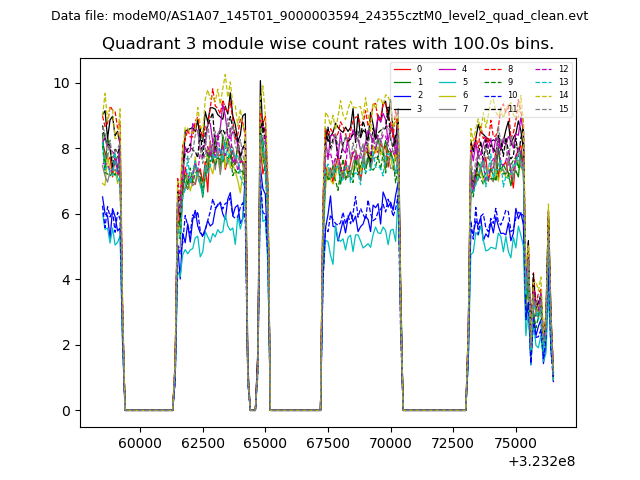 |
 |
| Parameter | Plot |
|---|---|
| CZT HV Monitor | 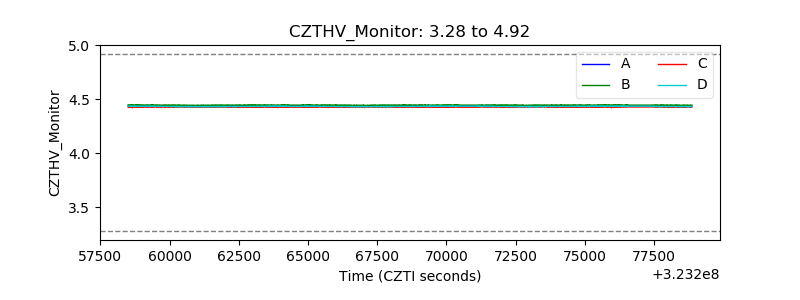 |
| D_VDD | 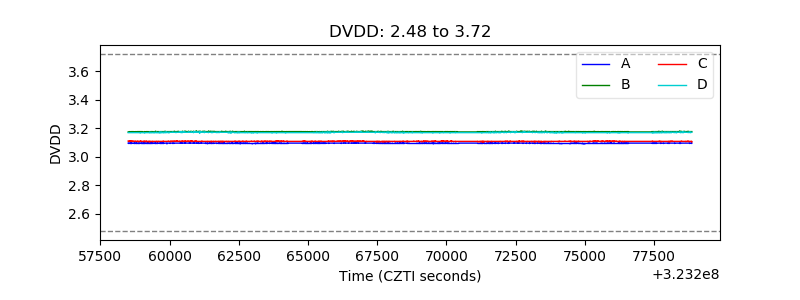 |
| Temperature 1 | 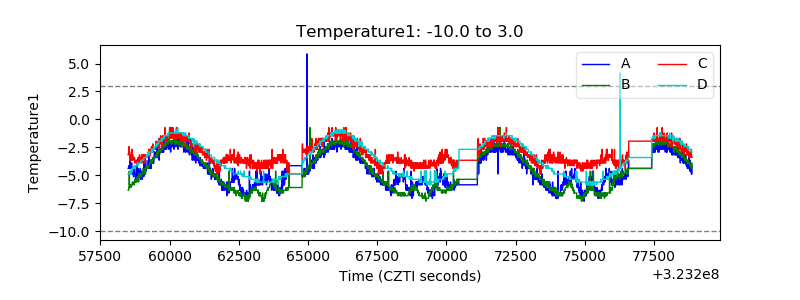 |
| Veto HV Monitor | 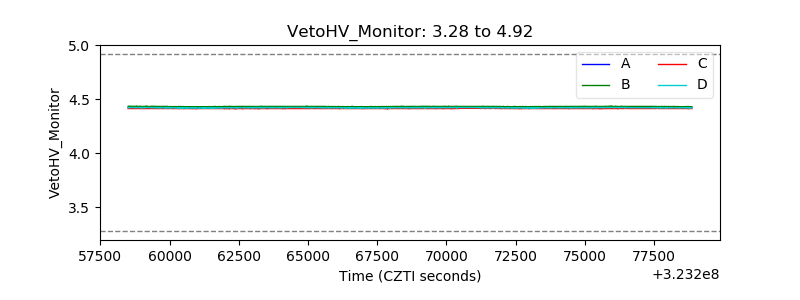 |
| Veto LLD | 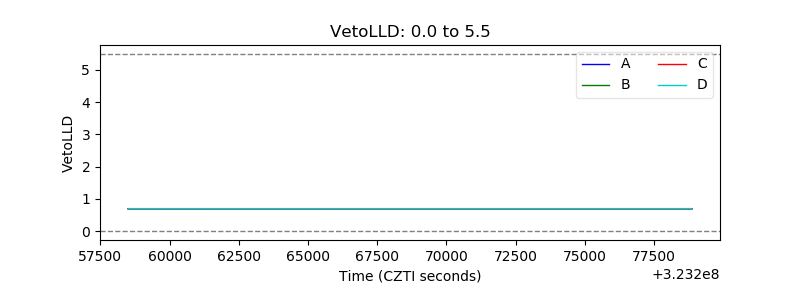 |
| Alpha Counter | 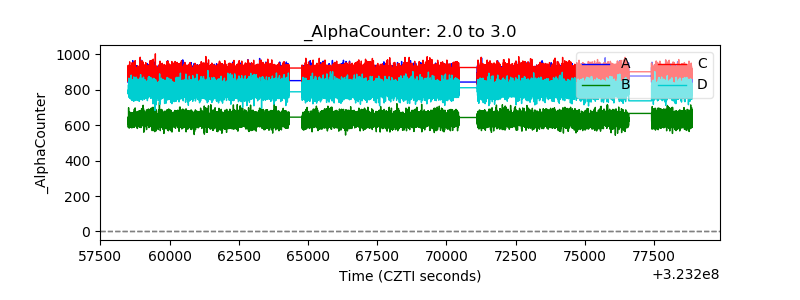 |
| _CPM_Rate | 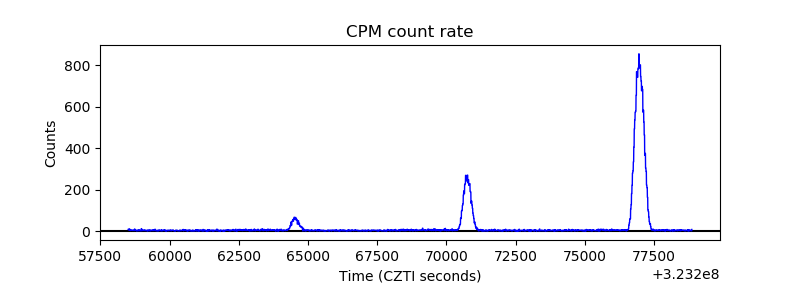 |
| CZT Counter | 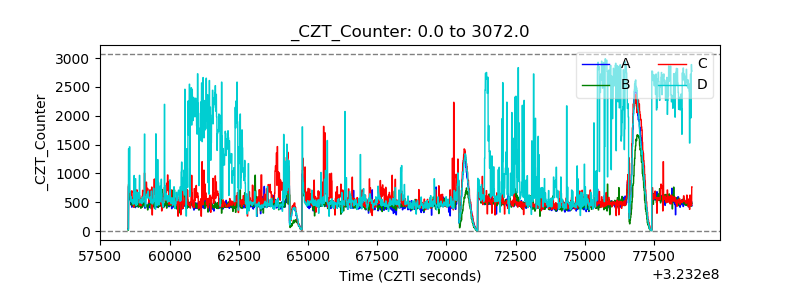 |
| +2.5 Volts monitor |  |
| +5 Volts monitor |  |
| _ROLL_ROT | 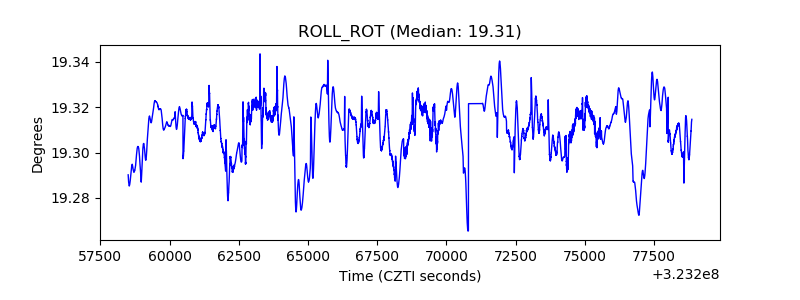 |
| _Roll_DEC | 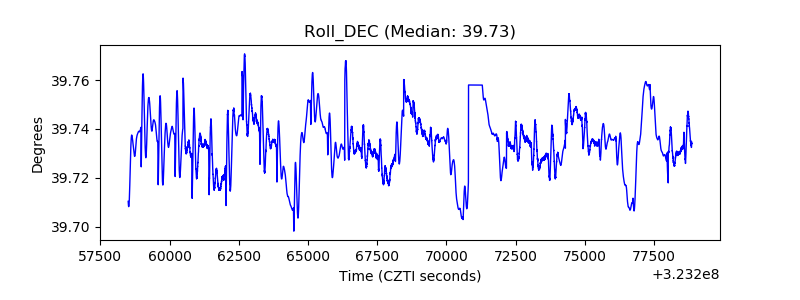 |
| _Roll_RA |  |
| Veto Counter | 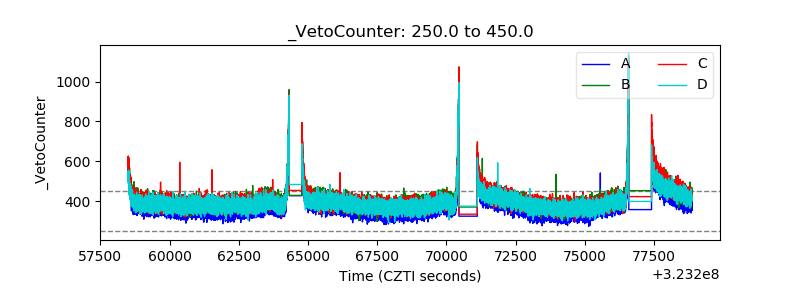 |