| Param | Original file | Final file |
|---|---|---|
| Filename | modeM0/AS1A07_145T01_9000003594_24356cztM0_level2.evt | modeM0/AS1A07_145T01_9000003594_24356cztM0_level2_quad_clean.evt |
| Size (bytes) | 682,545,600 | 77,008,320 |
| Size | 650.9 MB | 73.4 MB |
| Events in quadrant A | 3,202,717 | 479,198 |
| Events in quadrant B | 3,258,971 | 487,236 |
| Events in quadrant C | 3,517,924 | 470,164 |
| Events in quadrant D | 10,247,733 | 438,142 |
| Mode M0 | |||
|---|---|---|---|
| Quadrant | BADHDUFLAG | Total packets | Discarded packets |
| A | 0 | 13812 | 2 |
| B | 0 | 13868 | 2 |
| C | 0 | 14580 | 2 |
| D | 0 | 34983 | 2 |
| Mode M9 | |||
|---|---|---|---|
| Quadrant | BADHDUFLAG | Total packets | Discarded packets |
| A | 0 | 14 | 0 |
| B | 0 | 15 | 0 |
| C | 0 | 15 | 0 |
| D | 0 | 15 | 0 |
| Mode SS | |||
|---|---|---|---|
| Quadrant | BADHDUFLAG | Total packets | Discarded packets |
| A | 0 | 132 | 0 |
| B | 0 | 132 | 0 |
| C | 0 | 132 | 0 |
| D | 0 | 132 | 0 |
| Quadrant | Total seconds | Saturated seconds | Saturation percentage |
|---|---|---|---|
| A | 6555 | 38 | 0.579710% |
| B | 6555 | 52 | 0.793288% |
| C | 6555 | 116 | 1.769641% |
| D | 6555 | 2637 | 40.228833% |
Noise dominated data is calculated using 1-second bins in cleaned event files. If a bin has >2000 counts, and if more than 50% of those come from <1% of pixels, then it is considered to be noise-dominated and hence unusable.
| Quadrant | # 1 sec bins | Bins with >0 counts | Bins with >2000 counts | High rate bins dominated by noise | Noise dominated (total time) | Noise dominated (detector-on time) | Marked lightcurve |
|---|---|---|---|---|---|---|---|
| A | 7540 | 6556 | 0 | 0 | 0.00% | 0.00% | 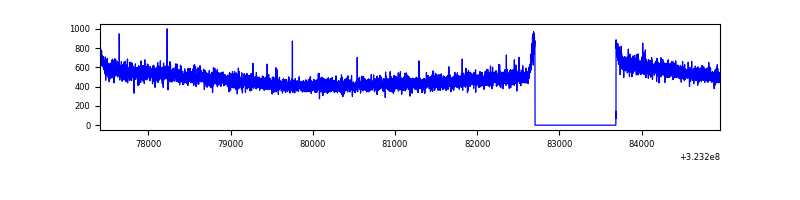 |
| B | 7540 | 6556 | 0 | 0 | 0.00% | 0.00% | 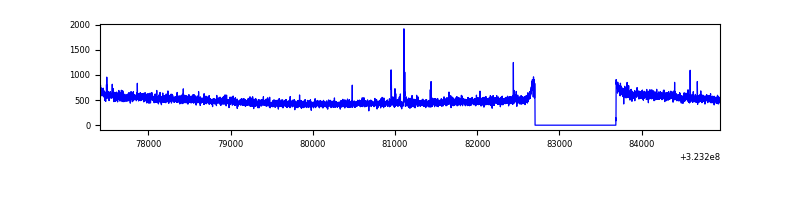 |
| C | 7540 | 6556 | 19 | 19 | 0.25% | 0.29% | 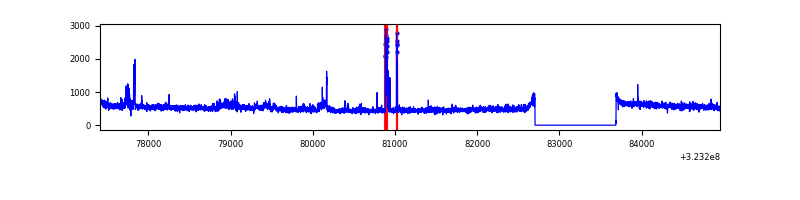 |
| D | 7540 | 6556 | 2336 | 2336 | 30.98% | 35.63% | 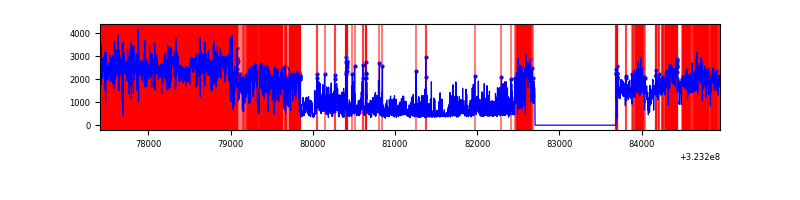 |
Top three noisy pixels from each quadrant. If the there are fewer than three noisy pixels in the level2.evt file, extra rows are filled as -1
| Pixel properties | Quadrant properties | ||||||
|---|---|---|---|---|---|---|---|
| Quadrant | DetID | PixID | Counts | Sigma | Mean | Median | Sigma |
| A | 13 | 254 | 10154 | 55.87 | 830 | 812 | 167.2 |
| A | 3 | 137 | 7414 | 39.48 | 830 | 812 | 167.2 |
| A | 0 | 226 | 7041 | 37.25 | 830 | 812 | 167.2 |
| B | 12 | 111 | 19111 | 116.12 | 827 | 807 | 157.6 |
| B | 0 | 230 | 17751 | 107.49 | 827 | 807 | 157.6 |
| B | 11 | 111 | 17212 | 104.07 | 827 | 807 | 157.6 |
| C | 2 | 16 | 145799 | 771.1 | 801 | 807 | 188.0 |
| C | 14 | 238 | 128431 | 678.74 | 801 | 807 | 188.0 |
| C | 3 | 233 | 94542 | 498.51 | 801 | 807 | 188.0 |
| D | 9 | 35 | 3692744 | 24224.01 | 625 | 606 | 152.4 |
| D | 1 | 52 | 2999851 | 19677.96 | 625 | 606 | 152.4 |
| D | 7 | 238 | 910234 | 5968.04 | 625 | 606 | 152.4 |
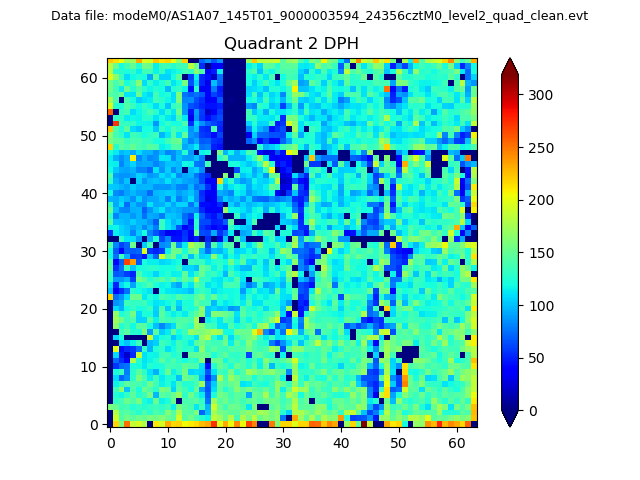
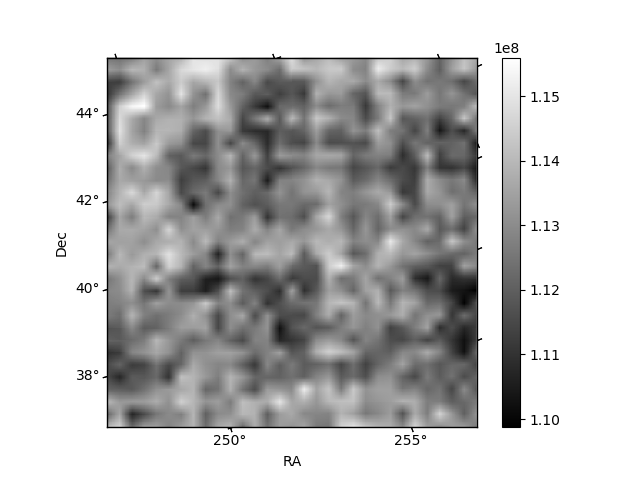
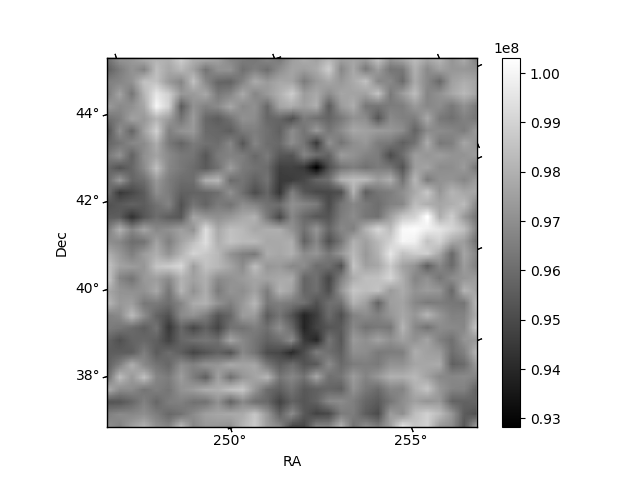
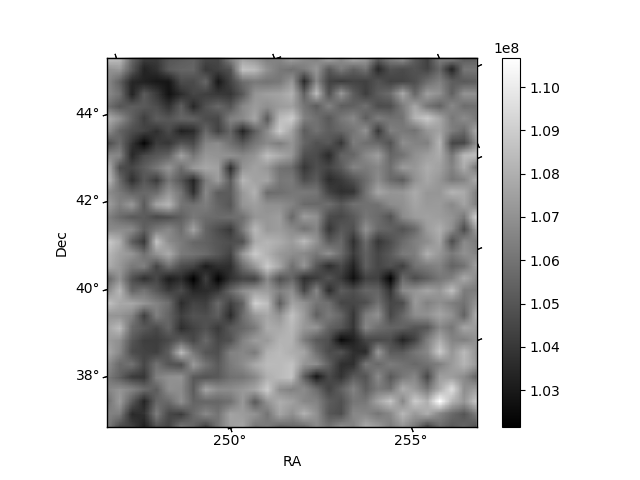
Histogram calculated using DETX and DETY for each event in the final _common_clean file
| Quadrant A |  |
 |
Quadrant B |
|---|---|---|---|
| Quadrant D | 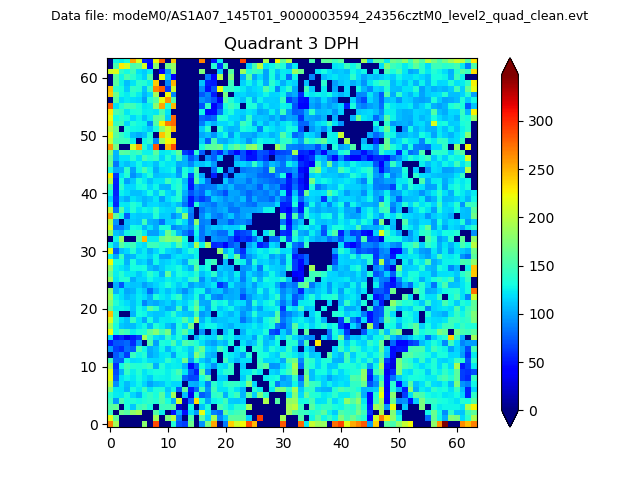 |
 |
Quadrant C |
| Plot type | Count rate plots | Images |
|---|---|---|
| Comparison with Poisson distribution Blue bars denote a histogram of data divided into 1 sec bins. Red curve is a Poisson curve with rate = median count rate of data. |
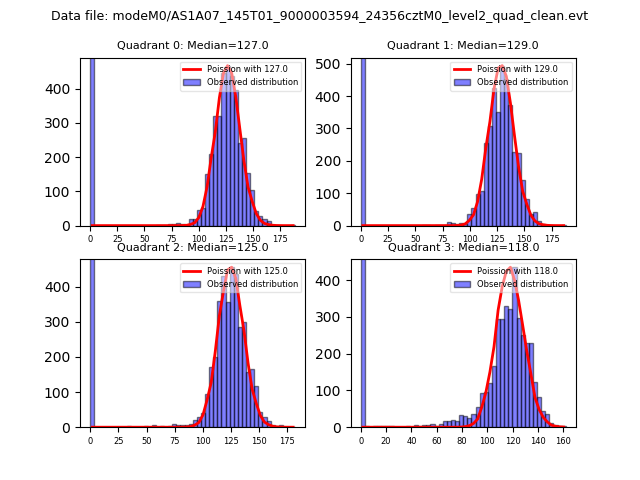 |
 |
| Quadrant-wise count rates Data is divided into 100 sec bins |
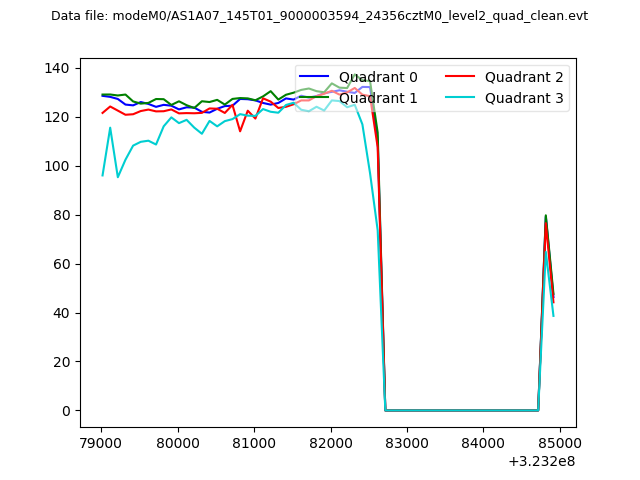 |
|
| Module-wise count rates for Quadrant A Data is divided into 100 sec bins |
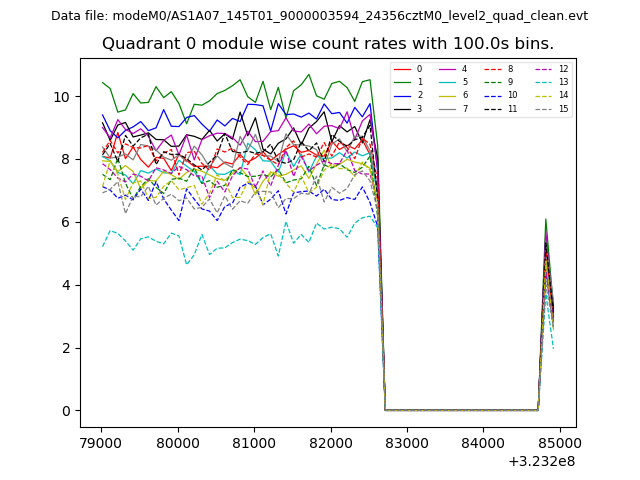 |
 |
| Module-wise count rates for Quadrant B Data is divided into 100 sec bins |
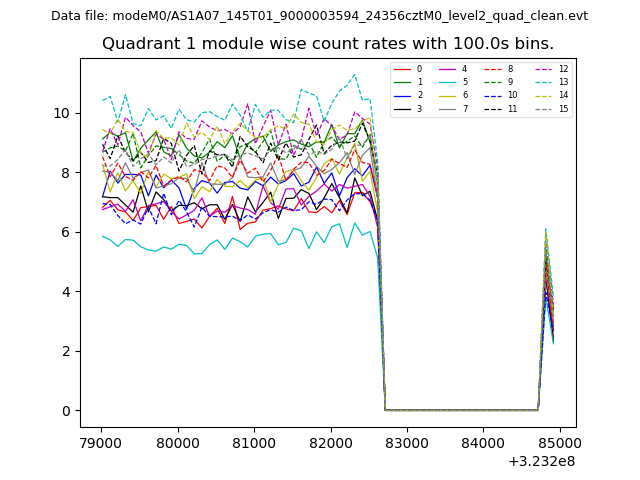 |
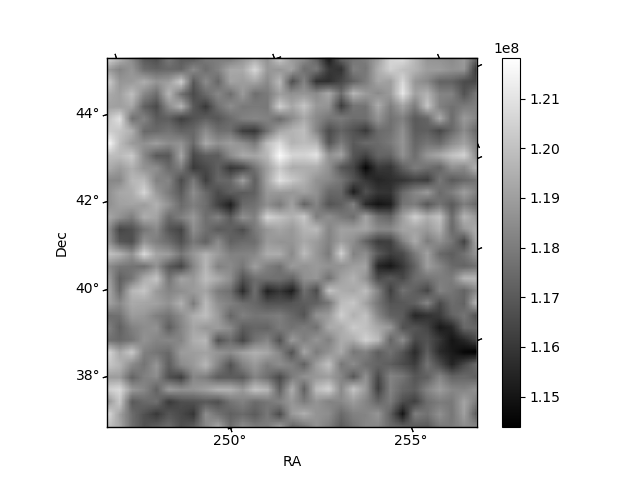 |
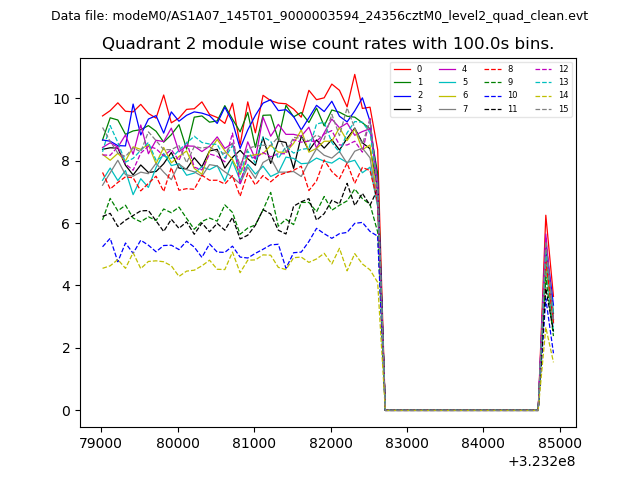
| Module-wise count rates for Quadrant C Data is divided into 100 sec bins |
 |
 |
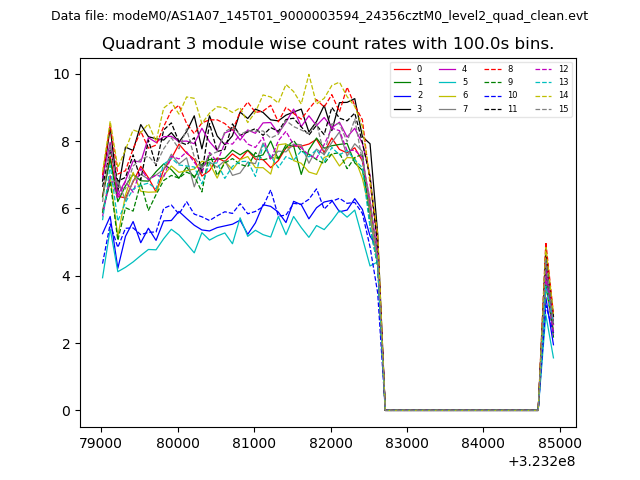
| Module-wise count rates for Quadrant D Data is divided into 100 sec bins |
 |
 |
| Parameter | Plot |
|---|---|
| CZT HV Monitor | 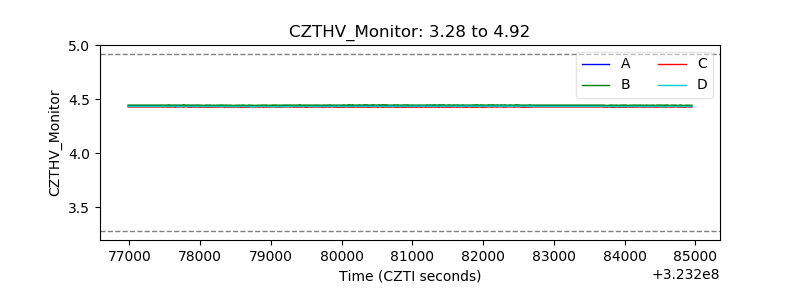 |
| D_VDD | 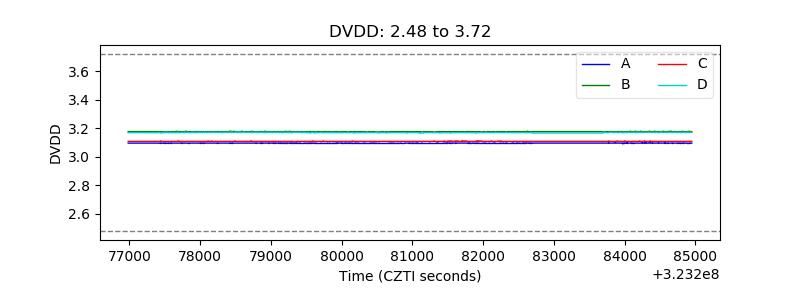 |
| Temperature 1 | 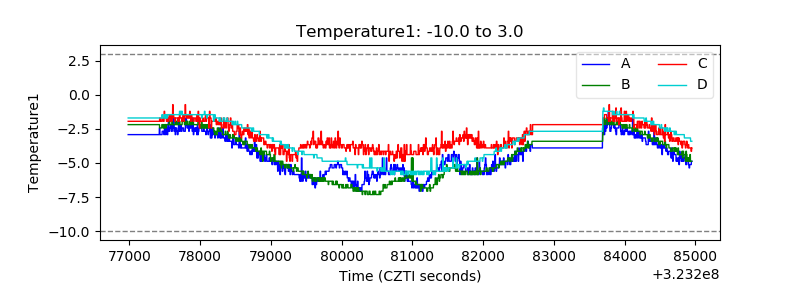 |
| Veto HV Monitor | 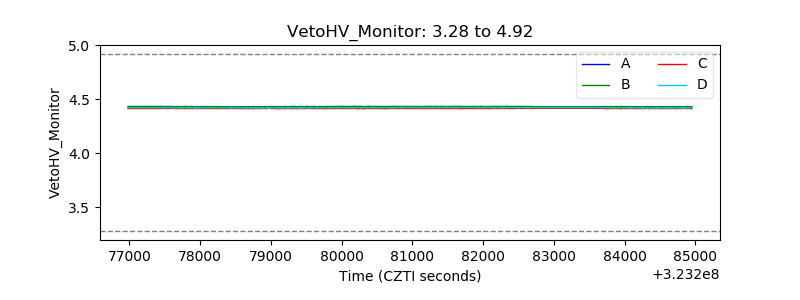 |
| Veto LLD | 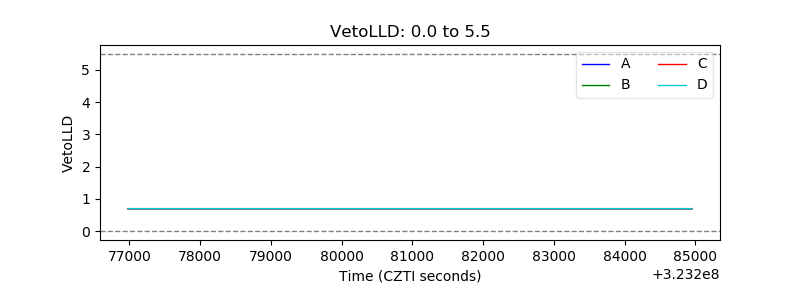 |
| Alpha Counter | 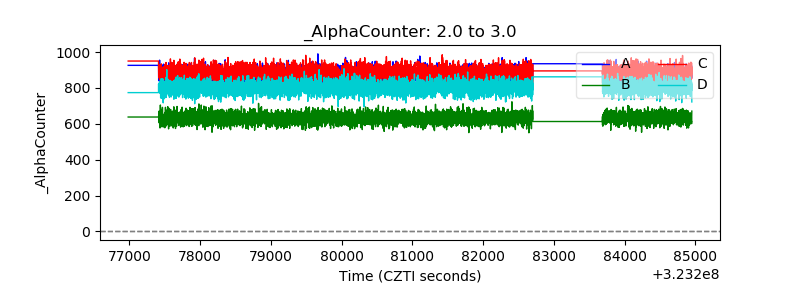 |
| _CPM_Rate |  |
| CZT Counter | 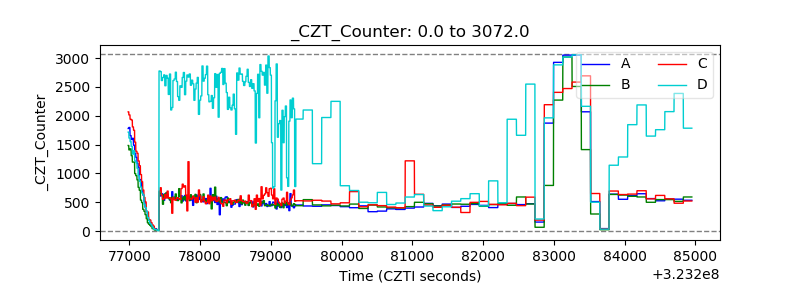 |
| +2.5 Volts monitor | 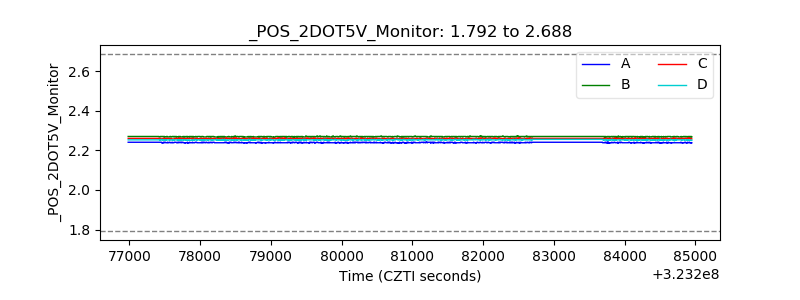 |
| +5 Volts monitor | 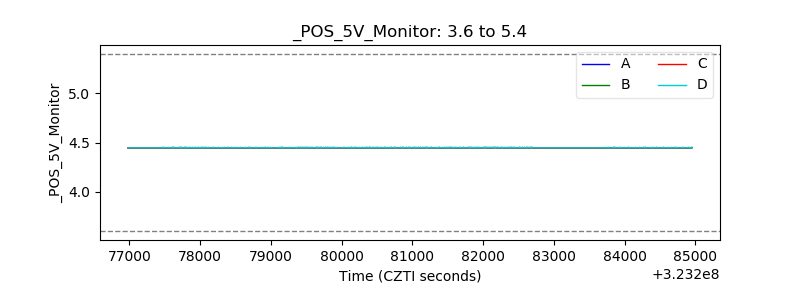 |
| _ROLL_ROT | 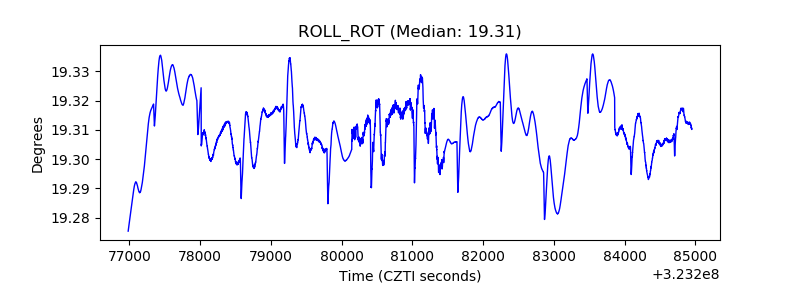 |
| _Roll_DEC | 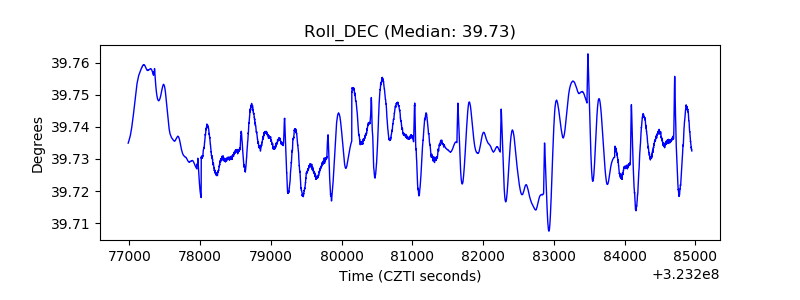 |
| _Roll_RA | 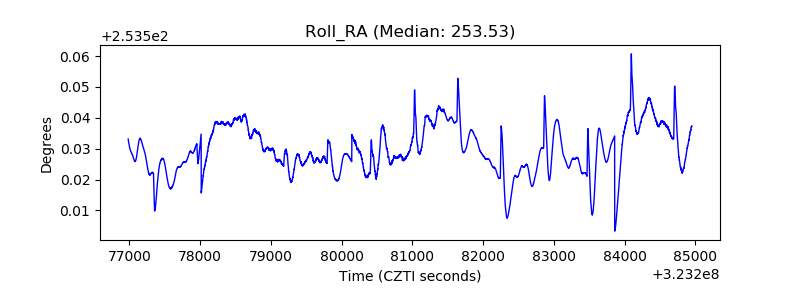 |
| Veto Counter | 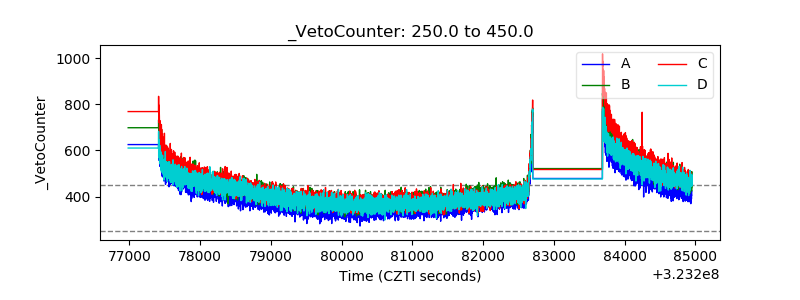 |