| Param | Original file | Final file |
|---|---|---|
| Filename | modeM0/AS1A07_145T01_9000003594_24358cztM0_level2.evt | modeM0/AS1A07_145T01_9000003594_24358cztM0_level2_quad_clean.evt |
| Size (bytes) | 730,586,880 | 89,300,160 |
| Size | 696.7 MB | 85.2 MB |
| Events in quadrant A | 3,318,280 | 582,080 |
| Events in quadrant B | 3,355,630 | 597,292 |
| Events in quadrant C | 3,473,727 | 580,316 |
| Events in quadrant D | 11,535,390 | 487,293 |
| Mode M0 | |||
|---|---|---|---|
| Quadrant | BADHDUFLAG | Total packets | Discarded packets |
| A | 0 | 14242 | 3 |
| B | 0 | 14292 | 2 |
| C | 0 | 14611 | 2 |
| D | 0 | 38786 | 2 |
| Mode M9 | |||
|---|---|---|---|
| Quadrant | BADHDUFLAG | Total packets | Discarded packets |
| A | 0 | 22 | 0 |
| B | 0 | 22 | 0 |
| C | 0 | 22 | 0 |
| D | 0 | 22 | 0 |
| Mode SS | |||
|---|---|---|---|
| Quadrant | BADHDUFLAG | Total packets | Discarded packets |
| A | 0 | 134 | 0 |
| B | 0 | 134 | 0 |
| C | 0 | 134 | 0 |
| D | 0 | 134 | 0 |
| Quadrant | Total seconds | Saturated seconds | Saturation percentage |
|---|---|---|---|
| A | 6550 | 75 | 1.145038% |
| B | 6551 | 89 | 1.358571% |
| C | 6551 | 152 | 2.320256% |
| D | 6551 | 3065 | 46.786750% |
Noise dominated data is calculated using 1-second bins in cleaned event files. If a bin has >2000 counts, and if more than 50% of those come from <1% of pixels, then it is considered to be noise-dominated and hence unusable.
| Quadrant | # 1 sec bins | Bins with >0 counts | Bins with >2000 counts | High rate bins dominated by noise | Noise dominated (total time) | Noise dominated (detector-on time) | Marked lightcurve |
|---|---|---|---|---|---|---|---|
| A | 8675 | 6552 | 0 | 0 | 0.00% | 0.00% | 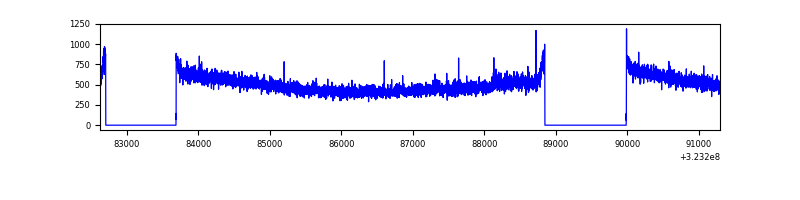 |
| B | 8676 | 6553 | 0 | 0 | 0.00% | 0.00% | 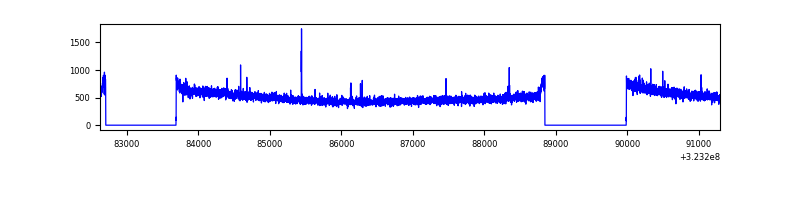 |
| C | 8676 | 6553 | 1 | 1 | 0.01% | 0.02% | 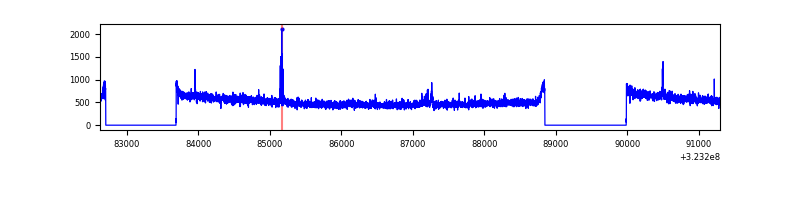 |
| D | 8676 | 6553 | 2782 | 2782 | 32.07% | 42.45% | 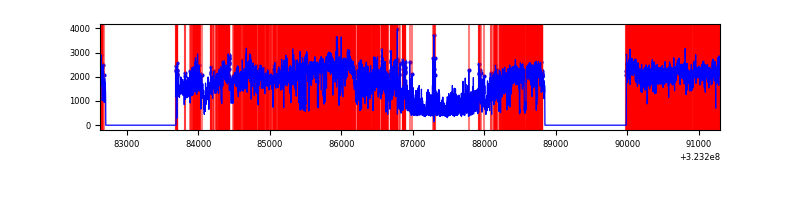 |
Top three noisy pixels from each quadrant. If the there are fewer than three noisy pixels in the level2.evt file, extra rows are filled as -1
| Pixel properties | Quadrant properties | ||||||
|---|---|---|---|---|---|---|---|
| Quadrant | DetID | PixID | Counts | Sigma | Mean | Median | Sigma |
| A | 6 | 16 | 17602 | 97.15 | 854 | 838 | 172.6 |
| A | 13 | 254 | 10282 | 54.73 | 854 | 838 | 172.6 |
| A | 3 | 1 | 8419 | 43.93 | 854 | 838 | 172.6 |
| B | 12 | 111 | 19507 | 114.93 | 854 | 833 | 162.5 |
| B | 11 | 111 | 17404 | 101.99 | 854 | 833 | 162.5 |
| B | 14 | 111 | 15494 | 90.23 | 854 | 833 | 162.5 |
| C | 14 | 238 | 132841 | 674.83 | 837 | 843 | 195.6 |
| C | 2 | 16 | 49544 | 248.98 | 837 | 843 | 195.6 |
| C | 4 | 175 | 13199 | 63.17 | 837 | 843 | 195.6 |
| D | 9 | 35 | 7317990 | 41059.69 | 734 | 714 | 178.2 |
| D | 7 | 238 | 710449 | 3982.56 | 734 | 714 | 178.2 |
| D | 1 | 52 | 394192 | 2207.94 | 734 | 714 | 178.2 |
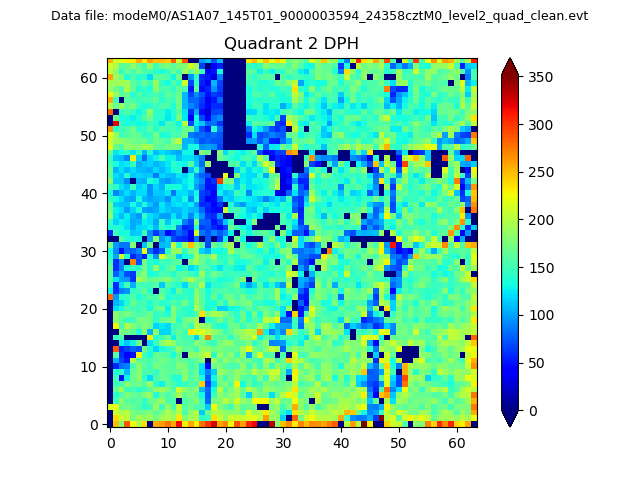
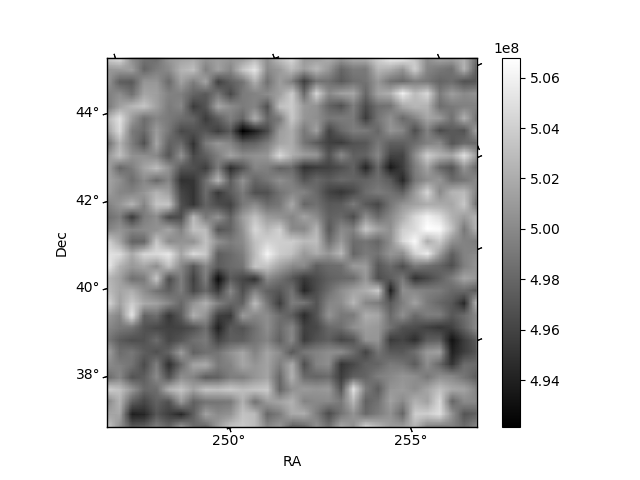
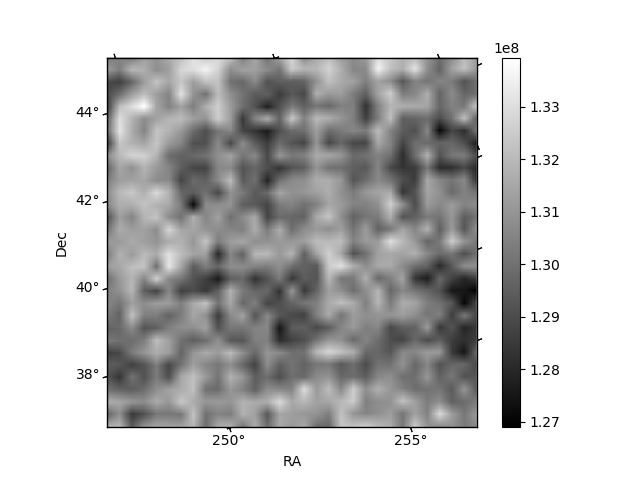
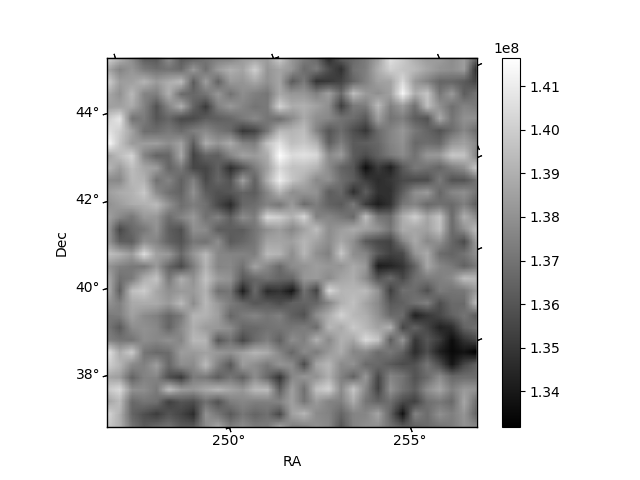
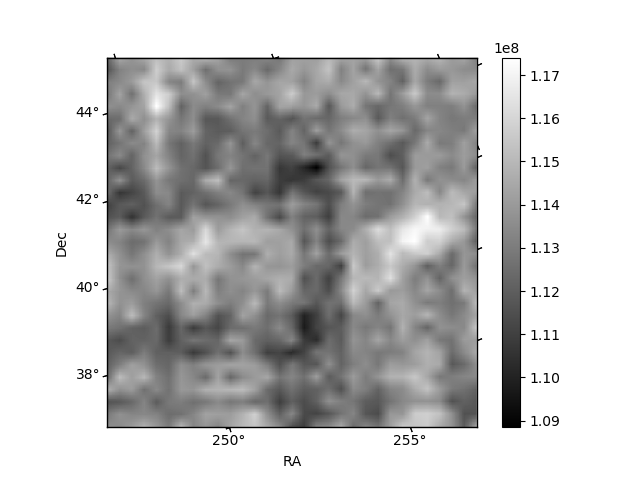
Histogram calculated using DETX and DETY for each event in the final _common_clean file
| Quadrant A | 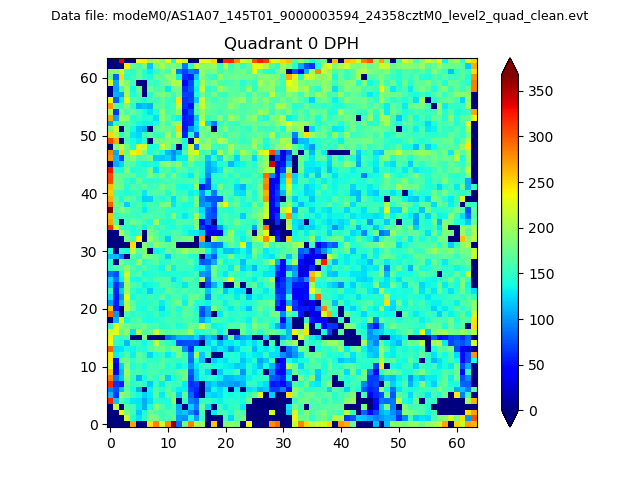 |
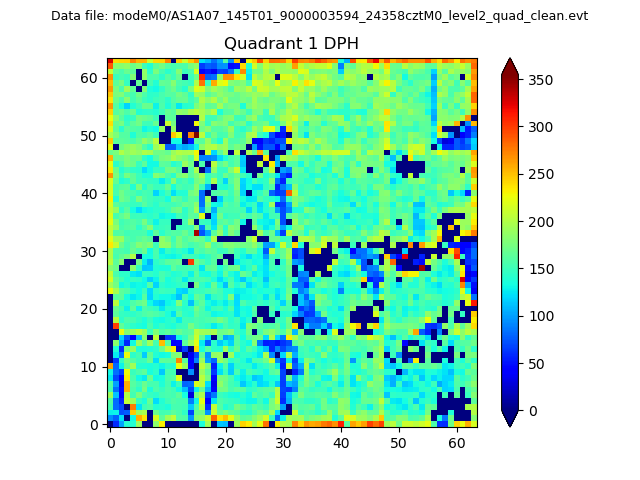 |
Quadrant B |
|---|---|---|---|
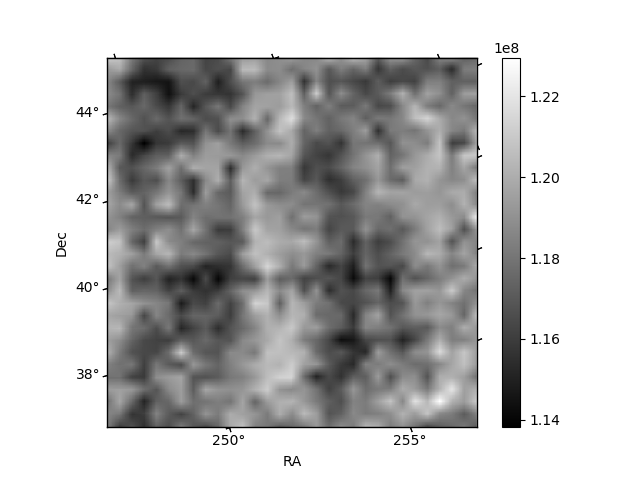
| Quadrant D | 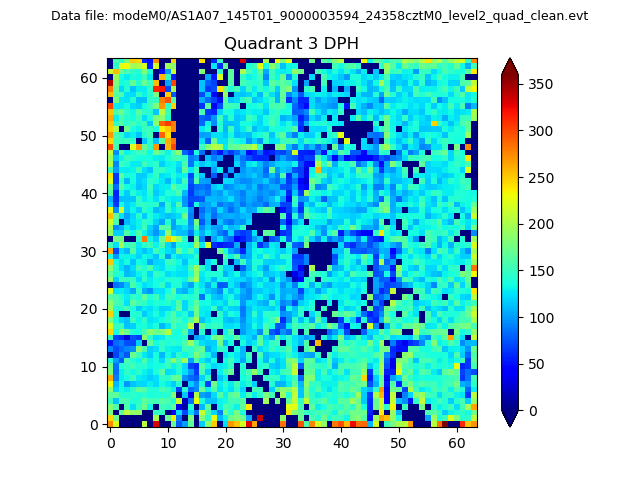 |
 |
Quadrant C |
| Plot type | Count rate plots | Images |
|---|---|---|
| Comparison with Poisson distribution Blue bars denote a histogram of data divided into 1 sec bins. Red curve is a Poisson curve with rate = median count rate of data. |
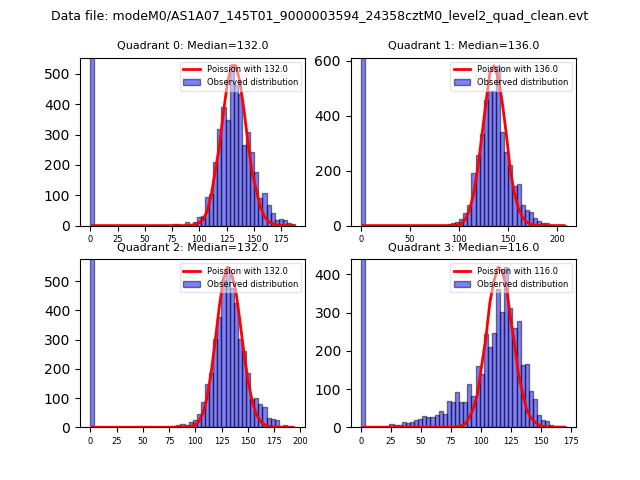 |
 |
| Quadrant-wise count rates Data is divided into 100 sec bins |
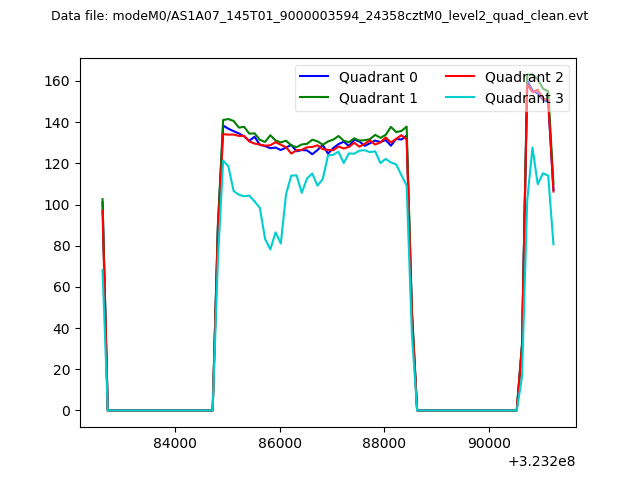 |
|
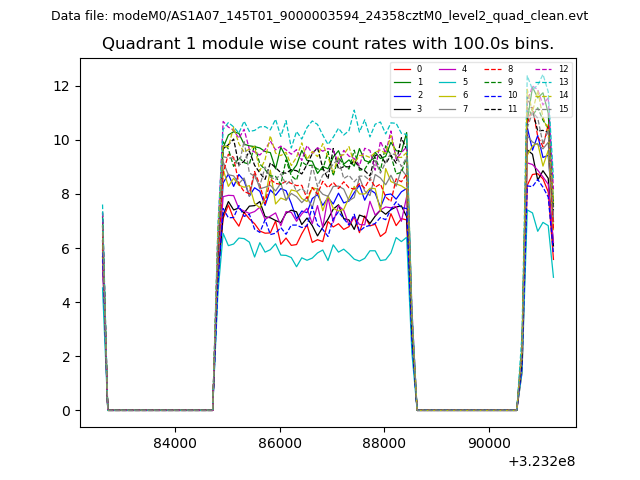
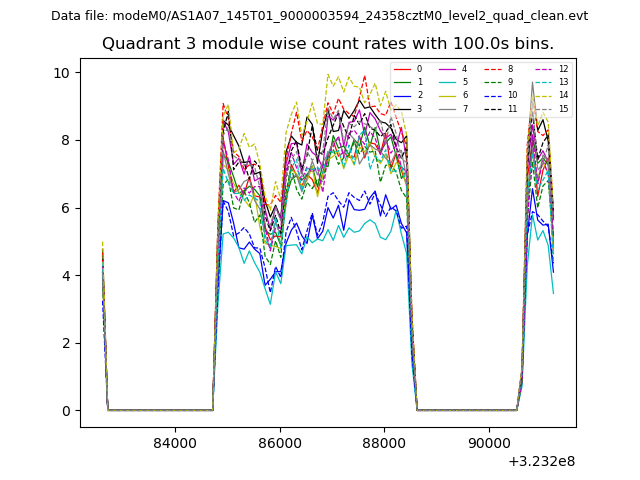
| Module-wise count rates for Quadrant A Data is divided into 100 sec bins |
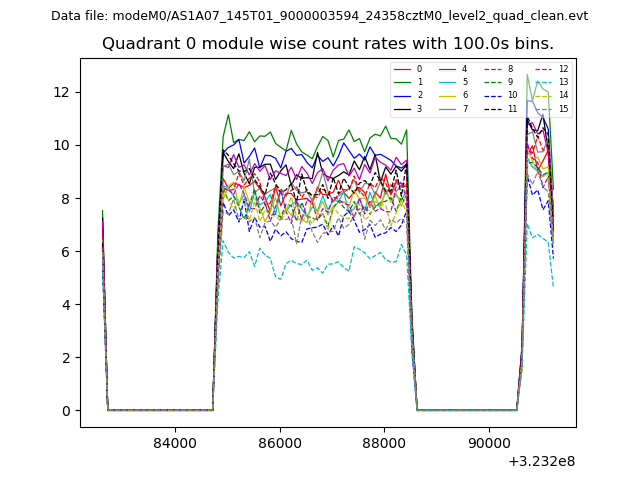 |
 |
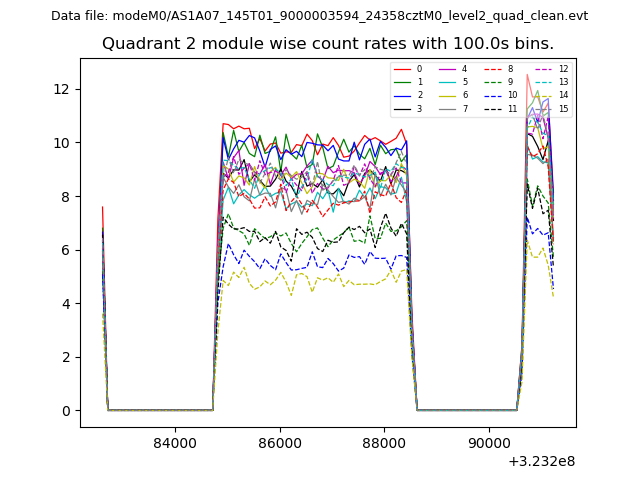
| Module-wise count rates for Quadrant B Data is divided into 100 sec bins |
 |
 |
| Module-wise count rates for Quadrant C Data is divided into 100 sec bins |
 |
 |
| Module-wise count rates for Quadrant D Data is divided into 100 sec bins |
 |
 |
| Parameter | Plot |
|---|---|
| CZT HV Monitor | 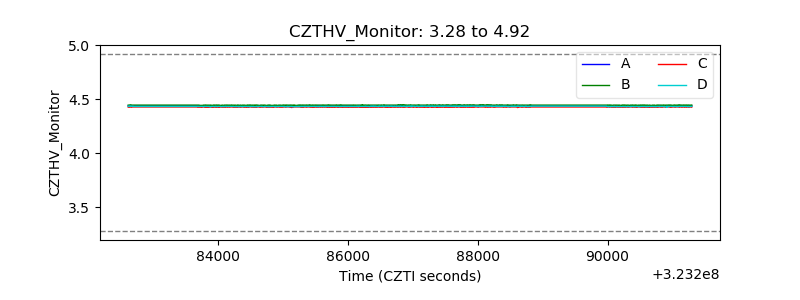 |
| D_VDD | 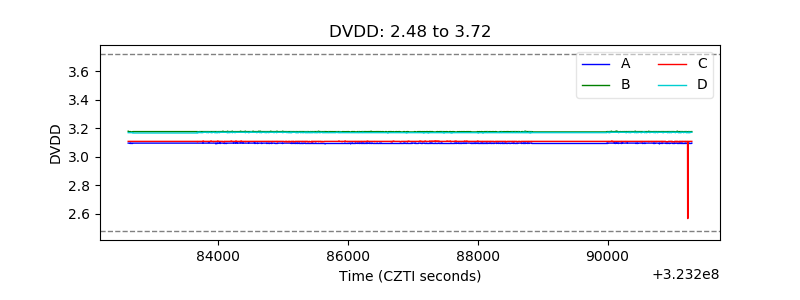 |
| Temperature 1 | 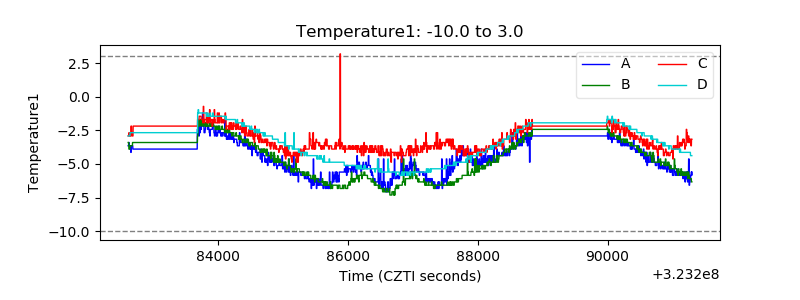 |
| Veto HV Monitor | 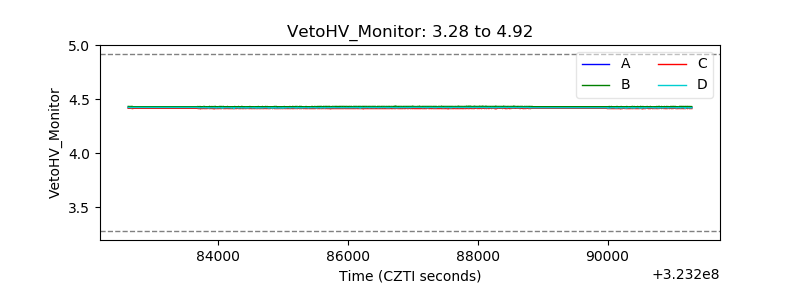 |
| Veto LLD | 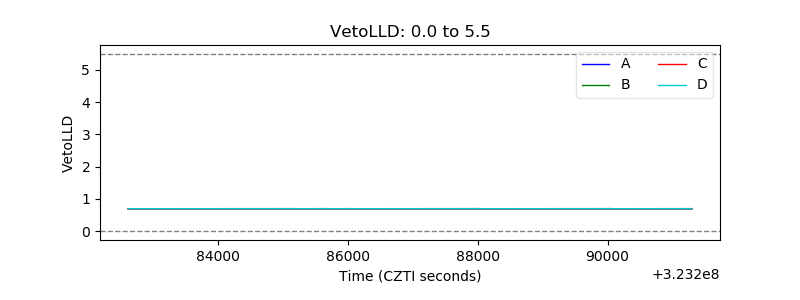 |
| Alpha Counter | 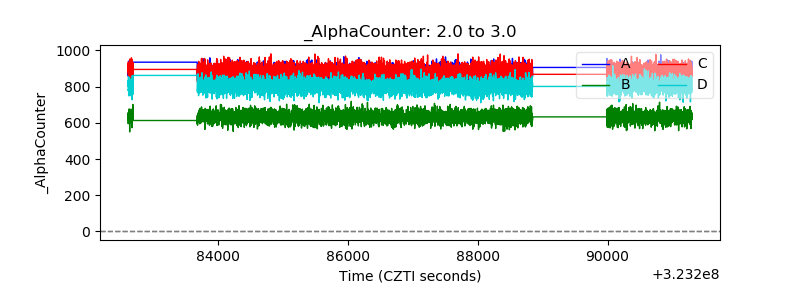 |
| _CPM_Rate | 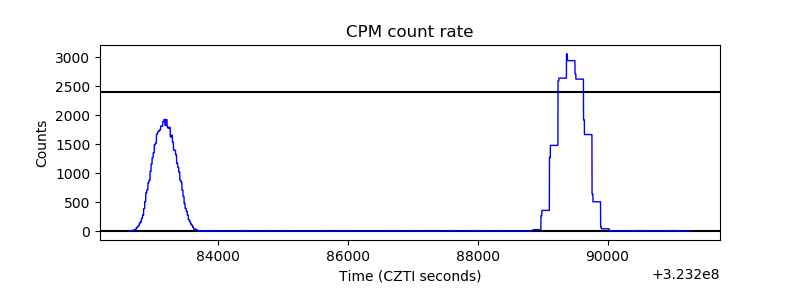 |
| CZT Counter | 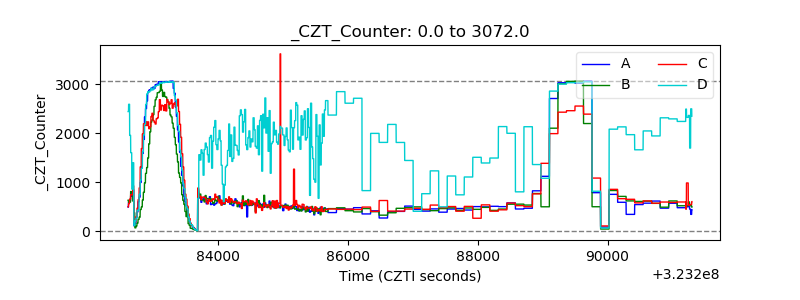 |
| +2.5 Volts monitor |  |
| +5 Volts monitor |  |
| _ROLL_ROT | 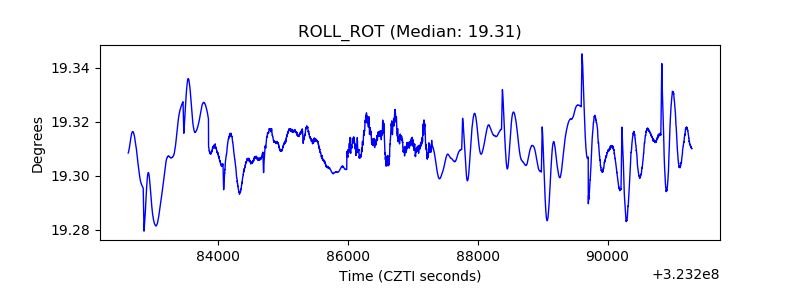 |
| _Roll_DEC | 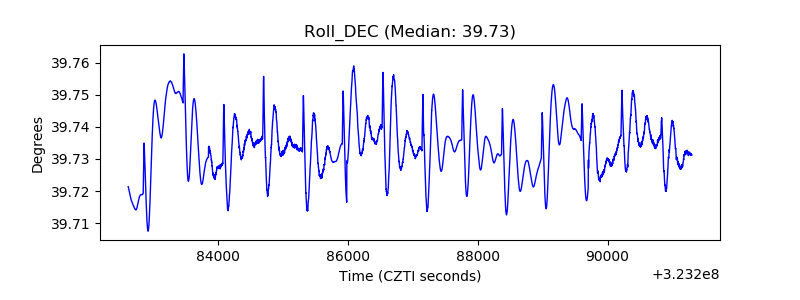 |
| _Roll_RA | 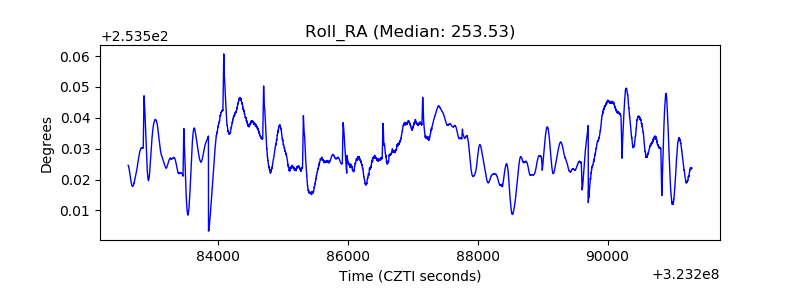 |
| Veto Counter | 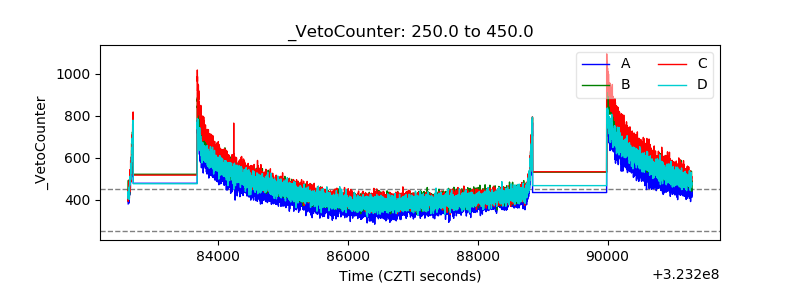 |