| Param | Original file | Final file |
|---|---|---|
| Filename | modeM0/AS1A07_145T01_9000003594_24359cztM0_level2.evt | modeM0/AS1A07_145T01_9000003594_24359cztM0_level2_quad_clean.evt |
| Size (bytes) | 691,577,280 | 98,066,880 |
| Size | 659.5 MB | 93.5 MB |
| Events in quadrant A | 3,117,635 | 658,023 |
| Events in quadrant B | 3,233,581 | 680,477 |
| Events in quadrant C | 3,353,757 | 663,233 |
| Events in quadrant D | 10,824,325 | 539,177 |
| Mode M0 | |||
|---|---|---|---|
| Quadrant | BADHDUFLAG | Total packets | Discarded packets |
| A | 0 | 13308 | 1 |
| B | 0 | 13610 | 1 |
| C | 0 | 13936 | 1 |
| D | 0 | 36386 | 1 |
| Mode M9 | |||
|---|---|---|---|
| Quadrant | BADHDUFLAG | Total packets | Discarded packets |
| A | 0 | 12 | 0 |
| B | 0 | 12 | 0 |
| C | 0 | 12 | 0 |
| D | 0 | 12 | 0 |
| Mode SS | |||
|---|---|---|---|
| Quadrant | BADHDUFLAG | Total packets | Discarded packets |
| A | 0 | 124 | 0 |
| B | 0 | 124 | 0 |
| C | 0 | 124 | 0 |
| D | 0 | 124 | 0 |
| Quadrant | Total seconds | Saturated seconds | Saturation percentage |
|---|---|---|---|
| A | 6133 | 59 | 0.962009% |
| B | 6133 | 70 | 1.141366% |
| C | 6134 | 125 | 2.037822% |
| D | 6134 | 3358 | 54.744050% |
Noise dominated data is calculated using 1-second bins in cleaned event files. If a bin has >2000 counts, and if more than 50% of those come from <1% of pixels, then it is considered to be noise-dominated and hence unusable.
| Quadrant | # 1 sec bins | Bins with >0 counts | Bins with >2000 counts | High rate bins dominated by noise | Noise dominated (total time) | Noise dominated (detector-on time) | Marked lightcurve |
|---|---|---|---|---|---|---|---|
| A | 7353 | 6134 | 0 | 0 | 0.00% | 0.00% | 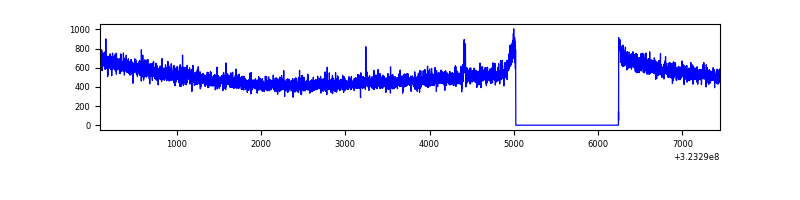 |
| B | 7353 | 6134 | 0 | 0 | 0.00% | 0.00% | 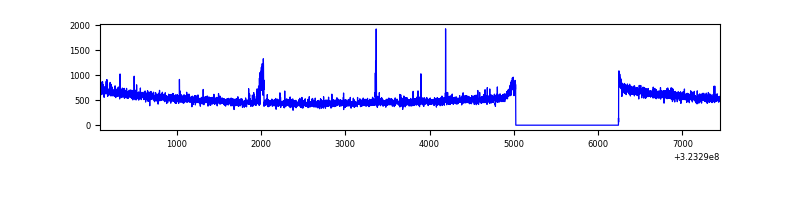 |
| C | 7354 | 6135 | 0 | 0 | 0.00% | 0.00% | 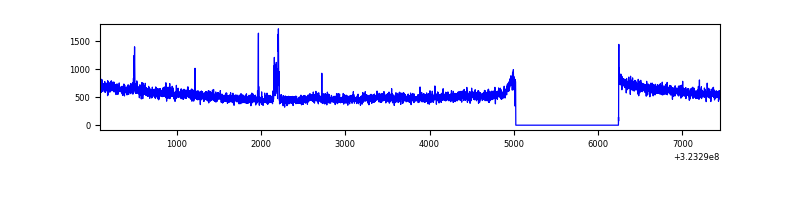 |
| D | 7354 | 6135 | 3185 | 3185 | 43.31% | 51.92% | 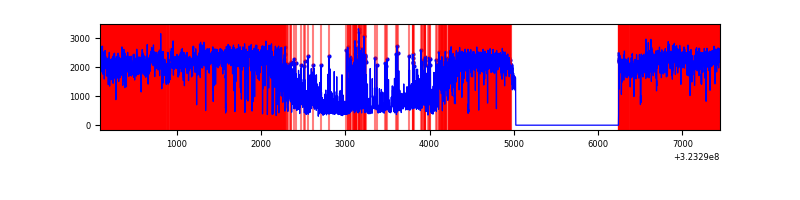 |
Top three noisy pixels from each quadrant. If the there are fewer than three noisy pixels in the level2.evt file, extra rows are filled as -1
| Pixel properties | Quadrant properties | ||||||
|---|---|---|---|---|---|---|---|
| Quadrant | DetID | PixID | Counts | Sigma | Mean | Median | Sigma |
| A | 13 | 254 | 10046 | 57.76 | 807 | 791 | 160.2 |
| A | 3 | 1 | 8126 | 45.77 | 807 | 791 | 160.2 |
| A | 3 | 137 | 7048 | 39.05 | 807 | 791 | 160.2 |
| B | 0 | 230 | 39998 | 256.12 | 814 | 795 | 153.1 |
| B | 12 | 111 | 17879 | 111.61 | 814 | 795 | 153.1 |
| B | 11 | 111 | 16226 | 100.81 | 814 | 795 | 153.1 |
| C | 14 | 238 | 128078 | 685.25 | 798 | 803 | 185.7 |
| C | 7 | 247 | 58845 | 312.5 | 798 | 803 | 185.7 |
| C | 2 | 16 | 52201 | 276.73 | 798 | 803 | 185.7 |
| D | 9 | 35 | 7052702 | 42198.86 | 691 | 673 | 167.1 |
| D | 7 | 238 | 902696 | 5397.64 | 691 | 673 | 167.1 |
| D | 1 | 52 | 108505 | 645.26 | 691 | 673 | 167.1 |
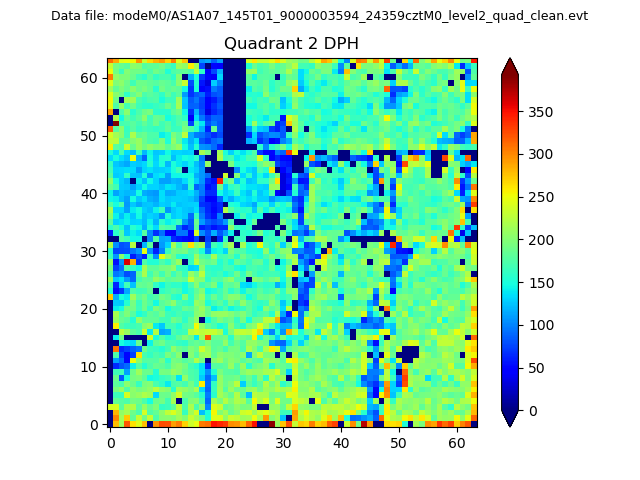
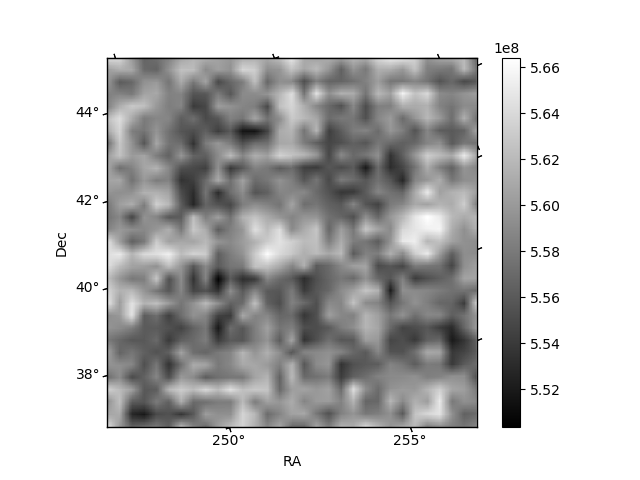
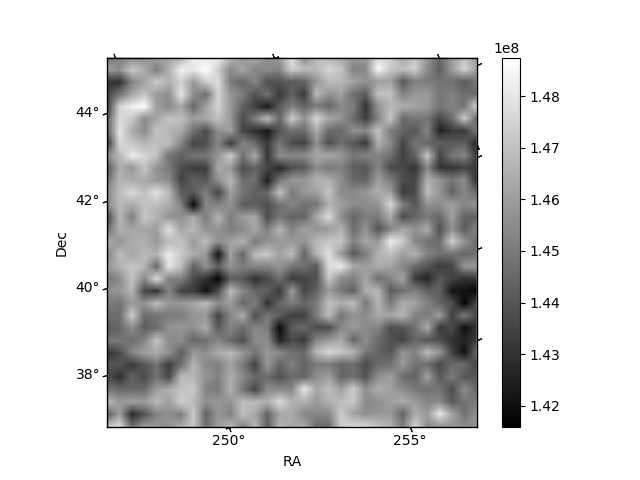
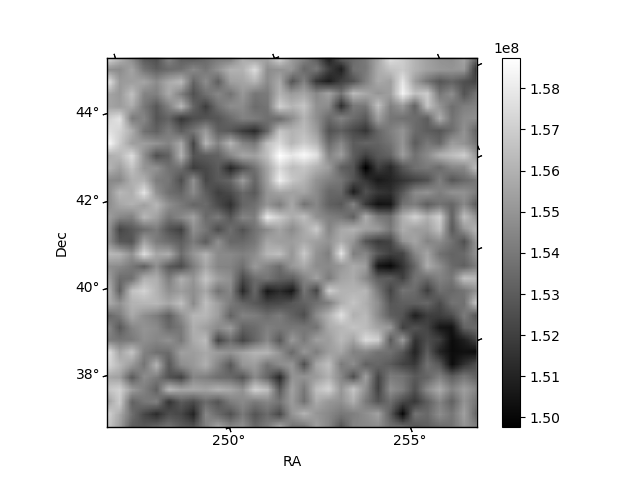
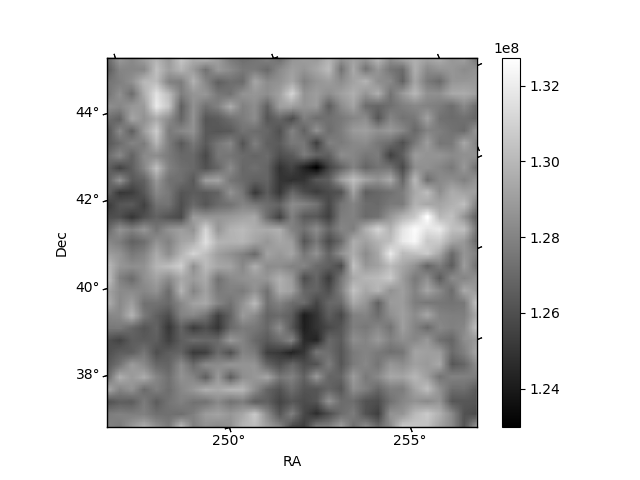
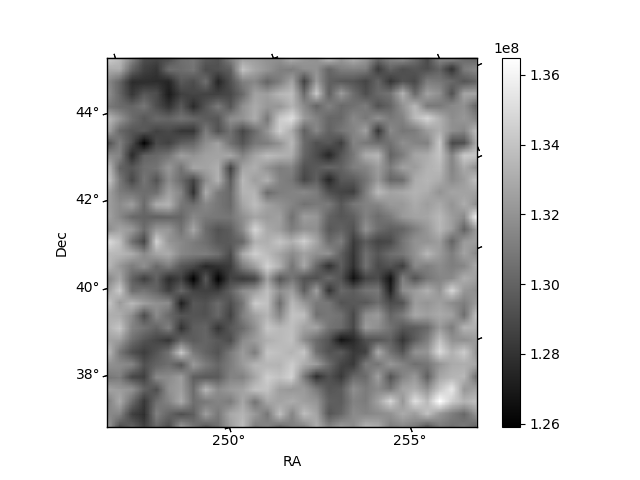
Histogram calculated using DETX and DETY for each event in the final _common_clean file
| Quadrant A | 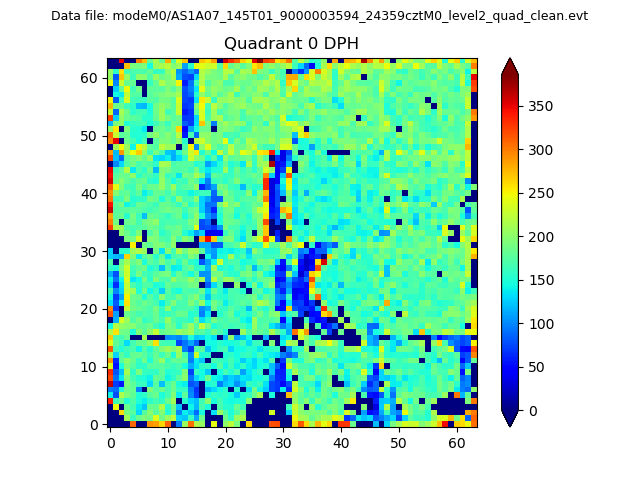 |
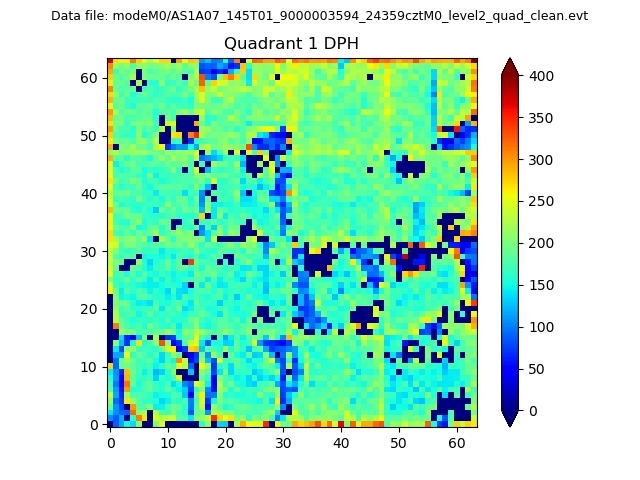 |
Quadrant B |
|---|---|---|---|
| Quadrant D | 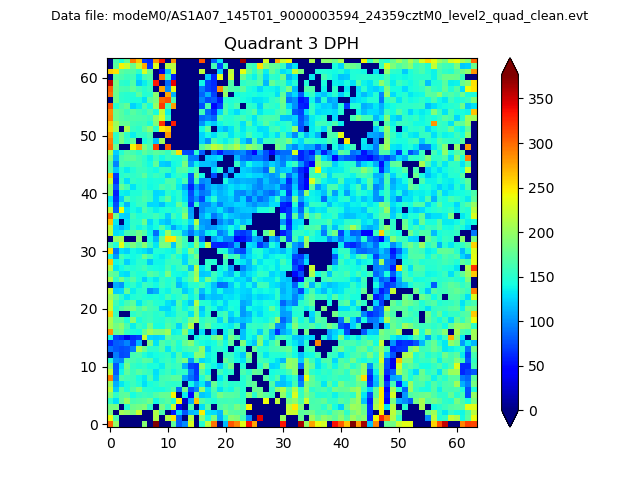 |
 |
Quadrant C |
| Plot type | Count rate plots | Images |
|---|---|---|
| Comparison with Poisson distribution Blue bars denote a histogram of data divided into 1 sec bins. Red curve is a Poisson curve with rate = median count rate of data. |
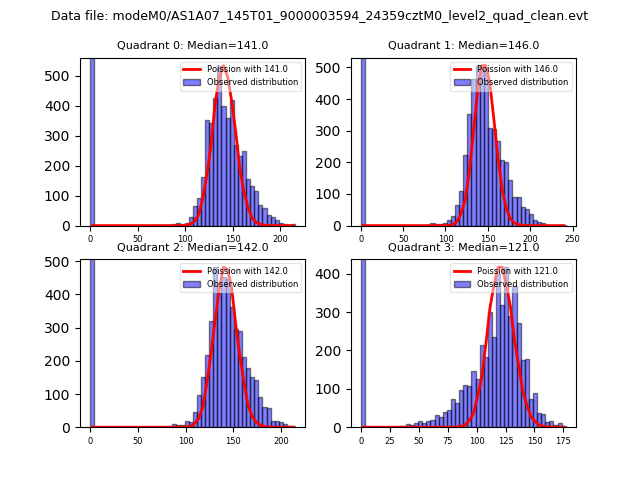 |
 |
| Quadrant-wise count rates Data is divided into 100 sec bins |
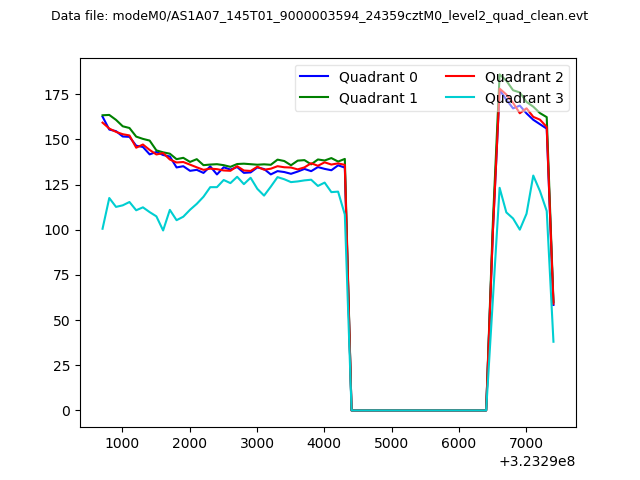 |
|
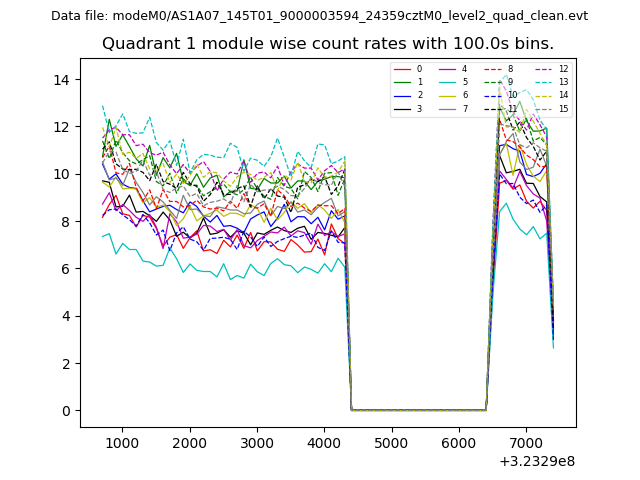
| Module-wise count rates for Quadrant A Data is divided into 100 sec bins |
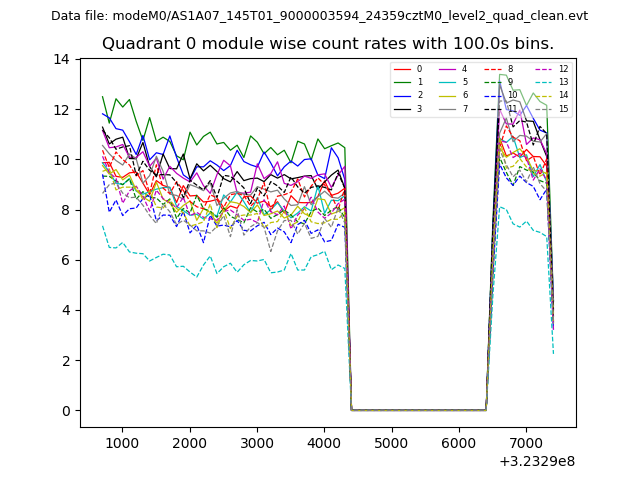 |
 |
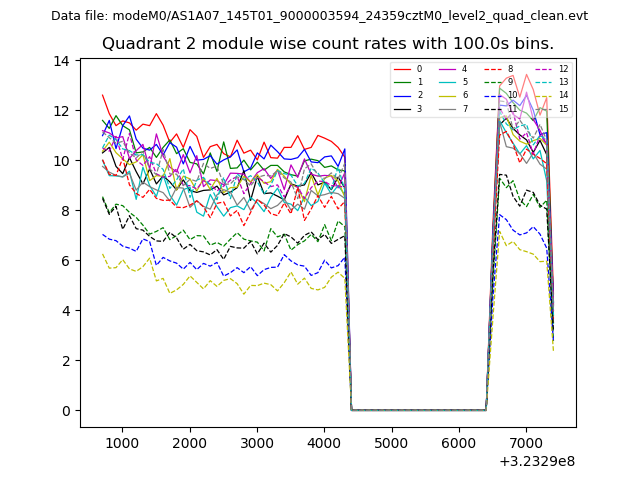
| Module-wise count rates for Quadrant B Data is divided into 100 sec bins |
 |
 |
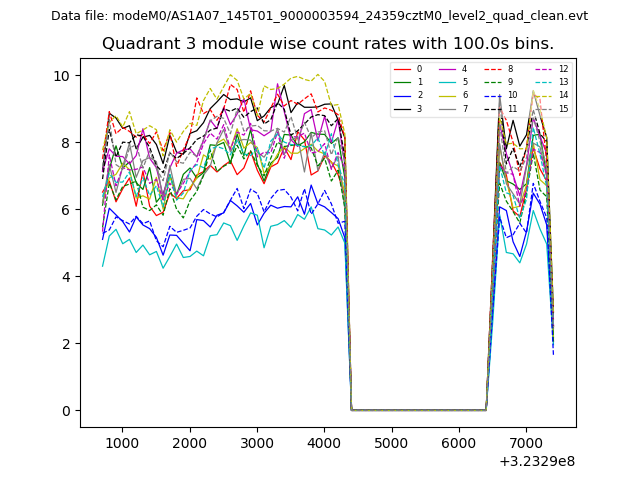
| Module-wise count rates for Quadrant C Data is divided into 100 sec bins |
 |
 |
| Module-wise count rates for Quadrant D Data is divided into 100 sec bins |
 |
 |
| Parameter | Plot |
|---|---|
| CZT HV Monitor | 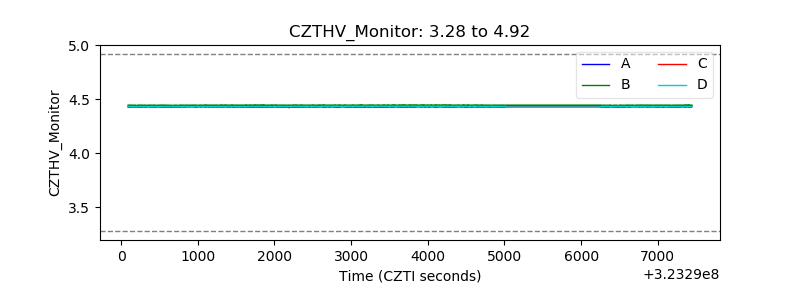 |
| D_VDD | 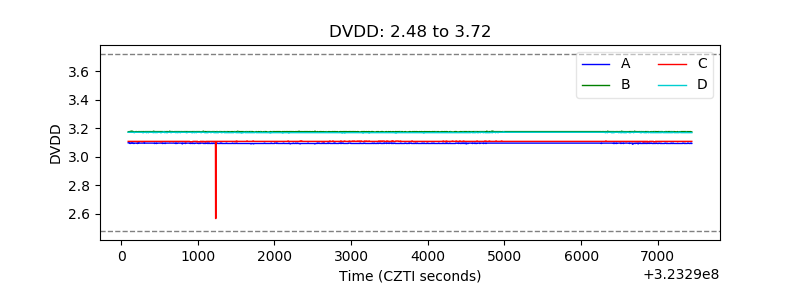 |
| Temperature 1 | 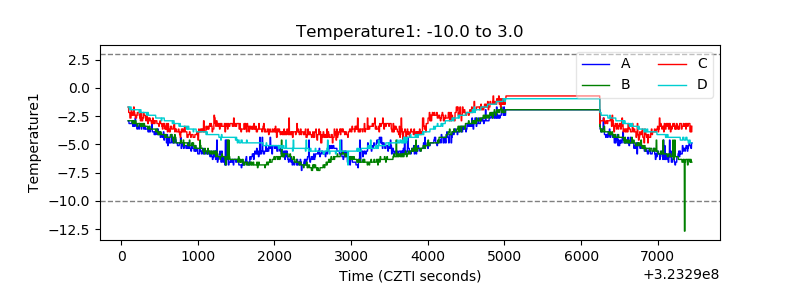 |
| Veto HV Monitor | 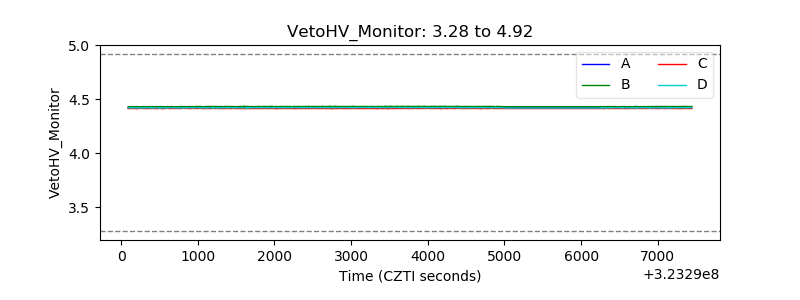 |
| Veto LLD | 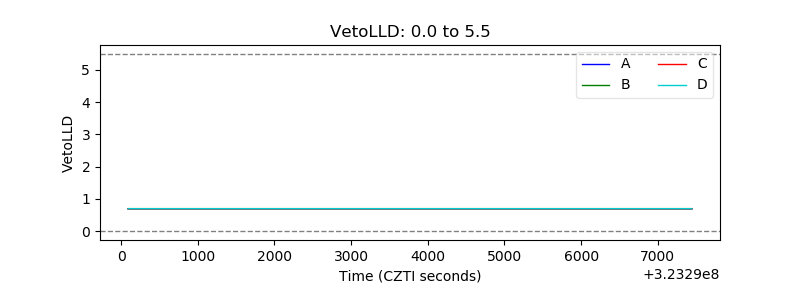 |
| Alpha Counter | 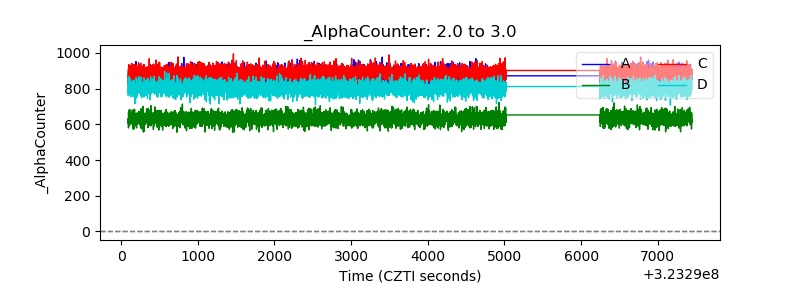 |
| _CPM_Rate | 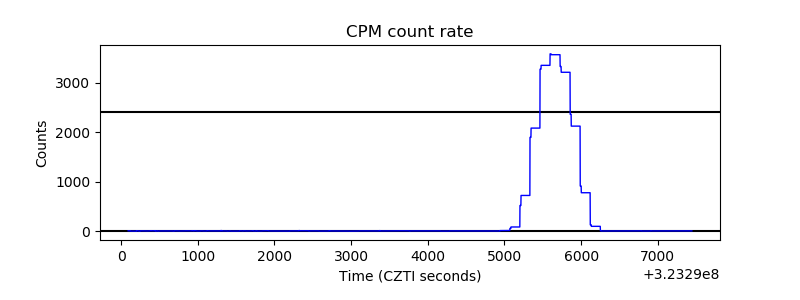 |
| CZT Counter |  |
| +2.5 Volts monitor |  |
| +5 Volts monitor | 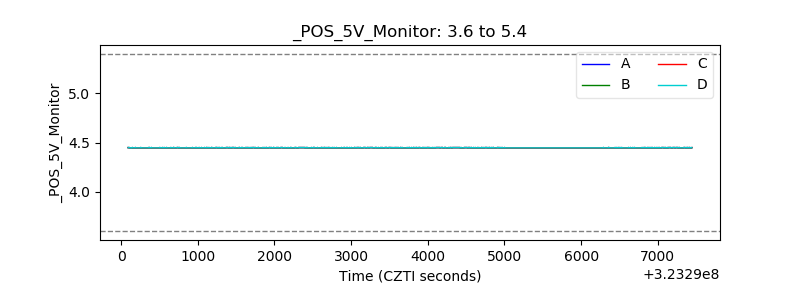 |
| _ROLL_ROT | 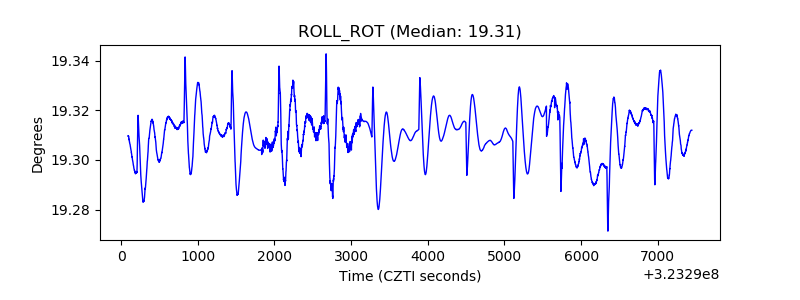 |
| _Roll_DEC | 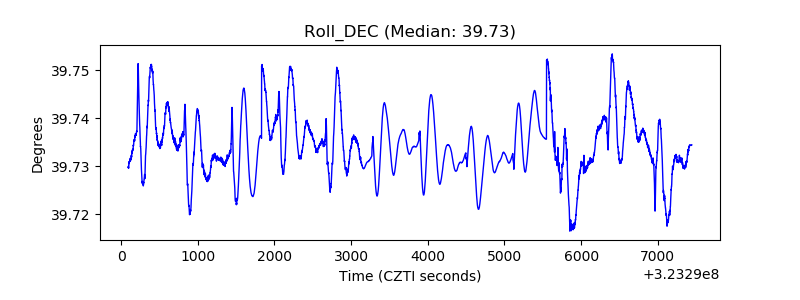 |
| _Roll_RA |  |
| Veto Counter | 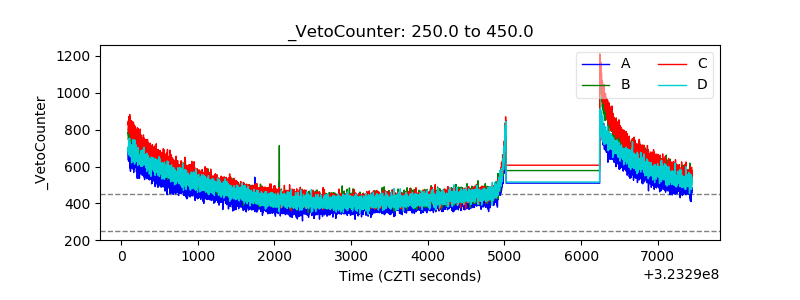 |