| Param | Original file | Final file |
|---|---|---|
| Filename | modeM0/AS1A07_145T01_9000003594_24360cztM0_level2.evt | modeM0/AS1A07_145T01_9000003594_24360cztM0_level2_quad_clean.evt |
| Size (bytes) | 681,649,920 | 110,583,360 |
| Size | 650.1 MB | 105.5 MB |
| Events in quadrant A | 3,279,556 | 750,167 |
| Events in quadrant B | 3,295,171 | 785,906 |
| Events in quadrant C | 3,429,505 | 760,930 |
| Events in quadrant D | 10,218,997 | 617,855 |
| Mode M0 | |||
|---|---|---|---|
| Quadrant | BADHDUFLAG | Total packets | Discarded packets |
| A | 0 | 13678 | 1 |
| B | 0 | 13768 | 1 |
| C | 0 | 14227 | 1 |
| D | 0 | 34709 | 1 |
| Mode M9 | |||
|---|---|---|---|
| Quadrant | BADHDUFLAG | Total packets | Discarded packets |
| A | 0 | 17 | 0 |
| B | 0 | 18 | 0 |
| C | 0 | 18 | 0 |
| D | 0 | 18 | 0 |
| Mode SS | |||
|---|---|---|---|
| Quadrant | BADHDUFLAG | Total packets | Discarded packets |
| A | 0 | 124 | 0 |
| B | 0 | 124 | 0 |
| C | 0 | 124 | 0 |
| D | 0 | 124 | 0 |
| Quadrant | Total seconds | Saturated seconds | Saturation percentage |
|---|---|---|---|
| A | 6212 | 43 | 0.692209% |
| B | 6211 | 60 | 0.966028% |
| C | 6211 | 118 | 1.899855% |
| D | 6211 | 3141 | 50.571567% |
Noise dominated data is calculated using 1-second bins in cleaned event files. If a bin has >2000 counts, and if more than 50% of those come from <1% of pixels, then it is considered to be noise-dominated and hence unusable.
| Quadrant | # 1 sec bins | Bins with >0 counts | Bins with >2000 counts | High rate bins dominated by noise | Noise dominated (total time) | Noise dominated (detector-on time) | Marked lightcurve |
|---|---|---|---|---|---|---|---|
| A | 7512 | 6213 | 2 | 2 | 0.03% | 0.03% | 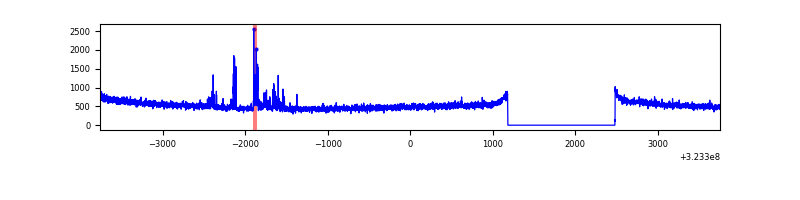 |
| B | 7511 | 6212 | 0 | 0 | 0.00% | 0.00% | 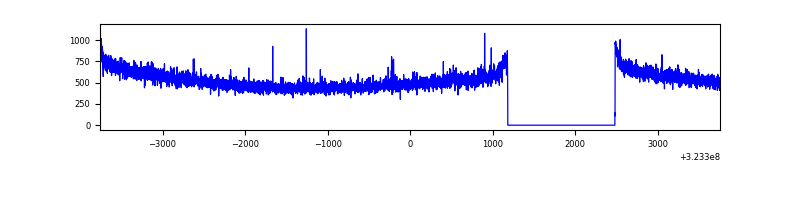 |
| C | 7511 | 6212 | 0 | 0 | 0.00% | 0.00% | 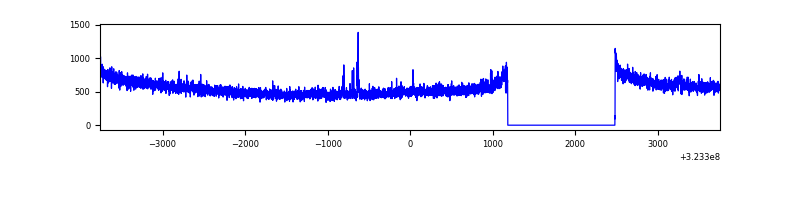 |
| D | 7511 | 6212 | 2924 | 2924 | 38.93% | 47.07% | 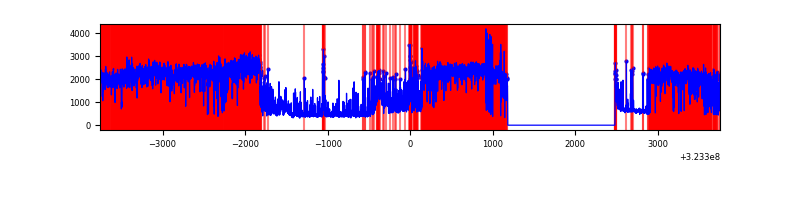 |
Top three noisy pixels from each quadrant. If the there are fewer than three noisy pixels in the level2.evt file, extra rows are filled as -1
| Pixel properties | Quadrant properties | ||||||
|---|---|---|---|---|---|---|---|
| Quadrant | DetID | PixID | Counts | Sigma | Mean | Median | Sigma |
| A | 4 | 2 | 97221 | 586.41 | 824 | 809 | 164.4 |
| A | 13 | 254 | 9966 | 55.7 | 824 | 809 | 164.4 |
| A | 3 | 137 | 6985 | 37.56 | 824 | 809 | 164.4 |
| B | 12 | 111 | 18545 | 113.08 | 839 | 819 | 156.8 |
| B | 11 | 111 | 16265 | 98.54 | 839 | 819 | 156.8 |
| B | 14 | 111 | 14558 | 87.65 | 839 | 819 | 156.8 |
| C | 14 | 238 | 131209 | 690.99 | 820 | 827 | 188.7 |
| C | 7 | 247 | 75002 | 393.11 | 820 | 827 | 188.7 |
| C | 3 | 233 | 18827 | 95.39 | 820 | 827 | 188.7 |
| D | 9 | 35 | 5656432 | 34655.72 | 680 | 662 | 163.2 |
| D | 7 | 238 | 1812797 | 11103.85 | 680 | 662 | 163.2 |
| D | 12 | 218 | 76360 | 463.84 | 680 | 662 | 163.2 |
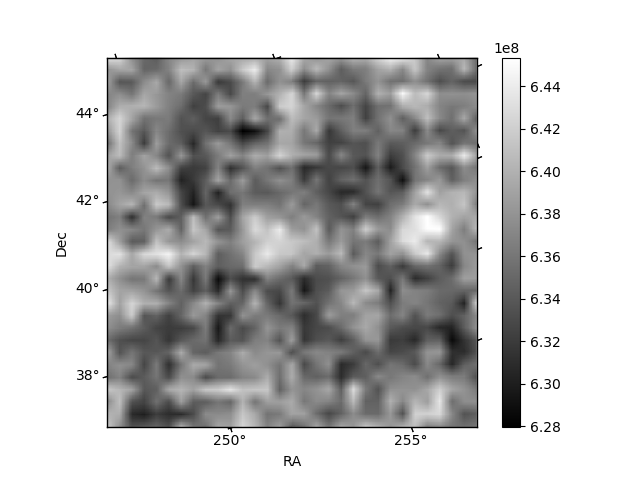
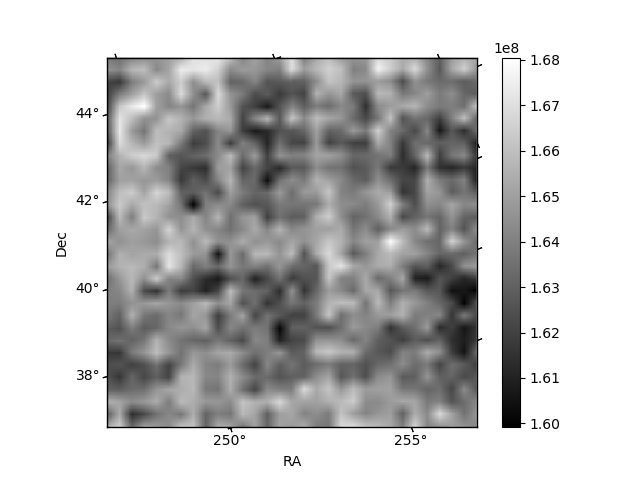
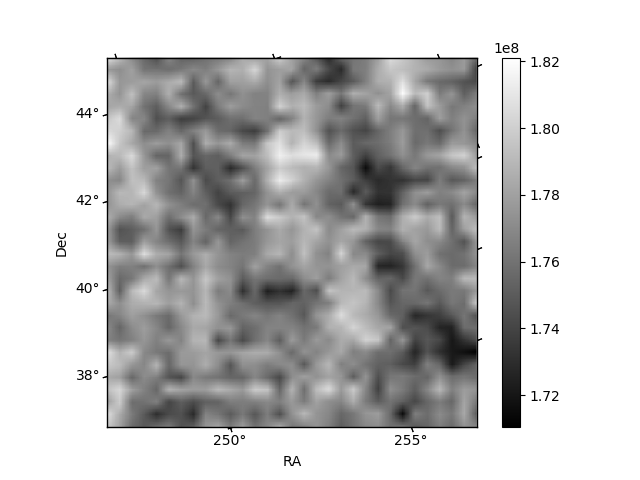
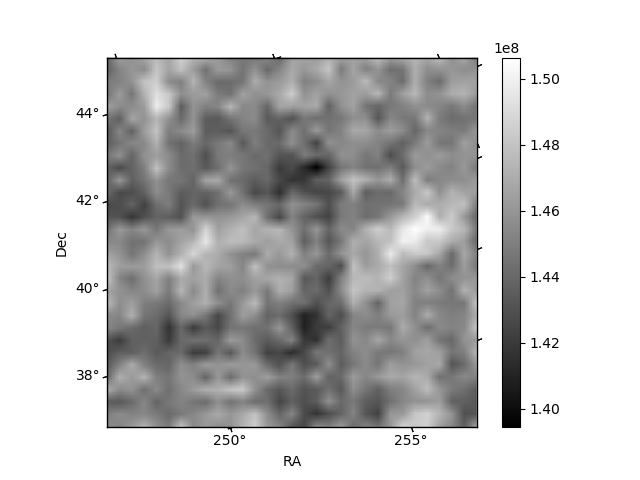
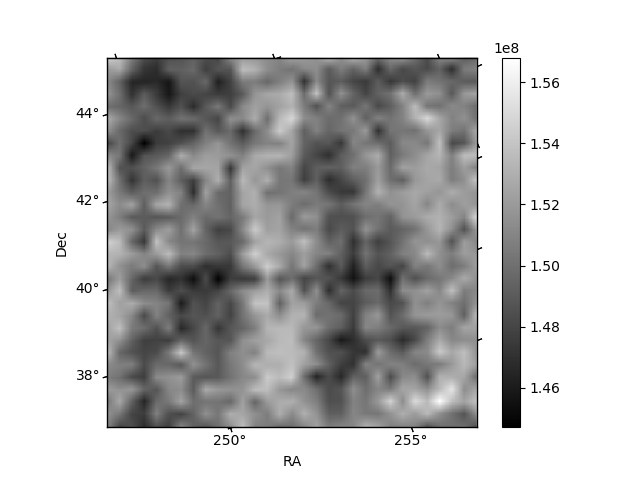
Histogram calculated using DETX and DETY for each event in the final _common_clean file
| Quadrant A | 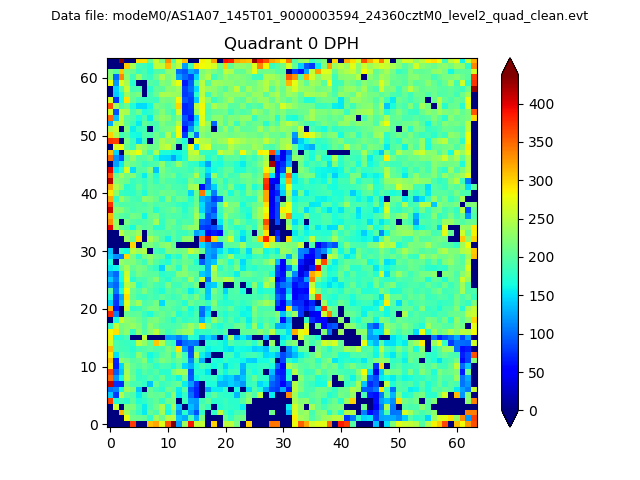 |
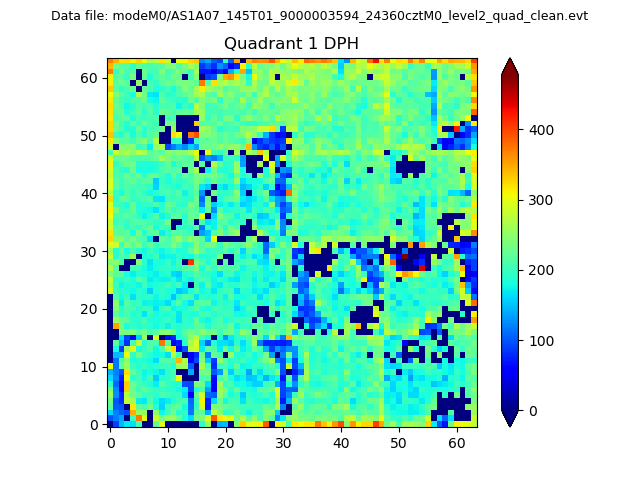 |
Quadrant B |
|---|---|---|---|
| Quadrant D |  |
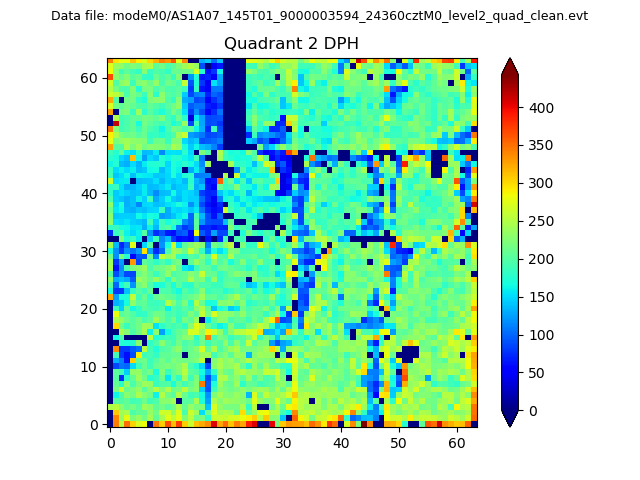 |
Quadrant C |
| Plot type | Count rate plots | Images |
|---|---|---|
| Comparison with Poisson distribution Blue bars denote a histogram of data divided into 1 sec bins. Red curve is a Poisson curve with rate = median count rate of data. |
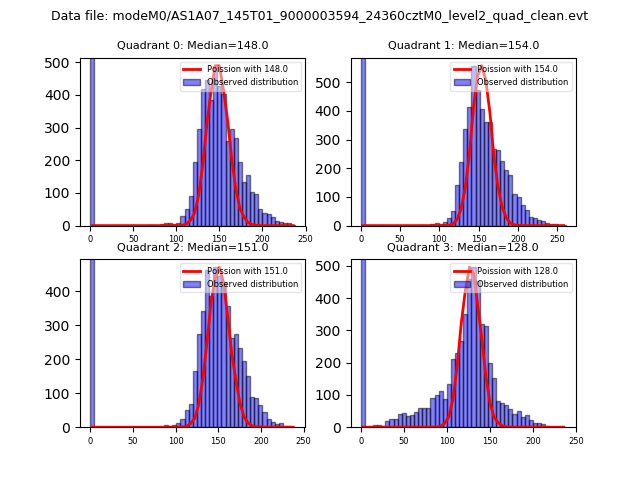 |
 |
| Quadrant-wise count rates Data is divided into 100 sec bins |
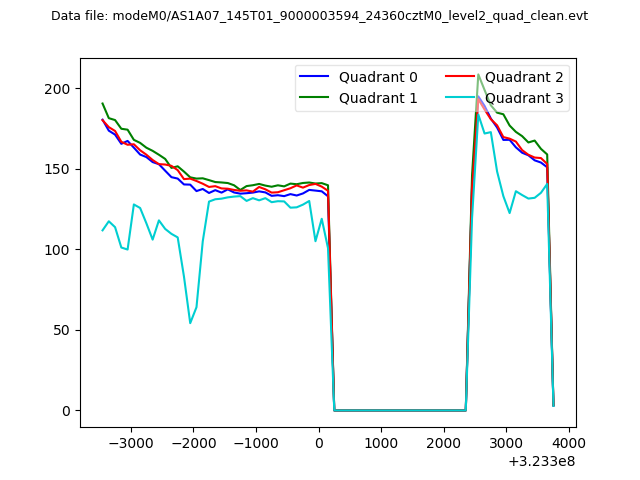 |
|
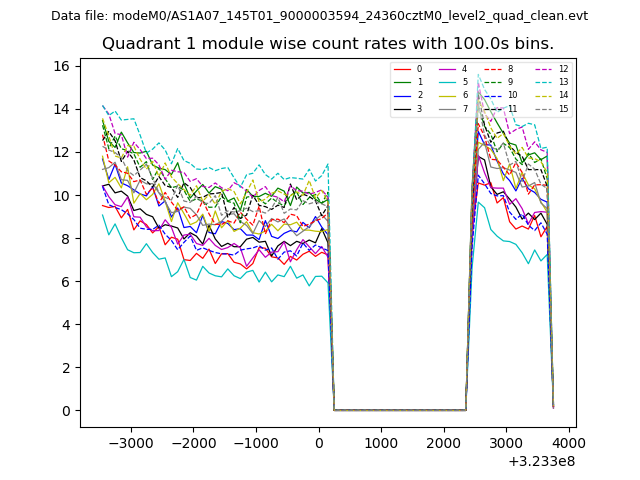
| Module-wise count rates for Quadrant A Data is divided into 100 sec bins |
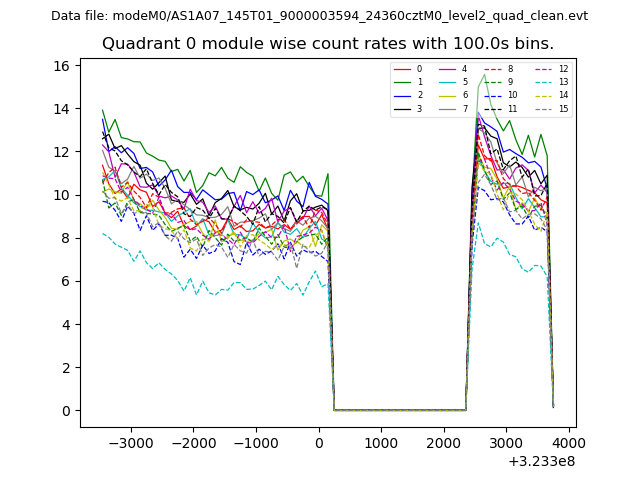 |
 |
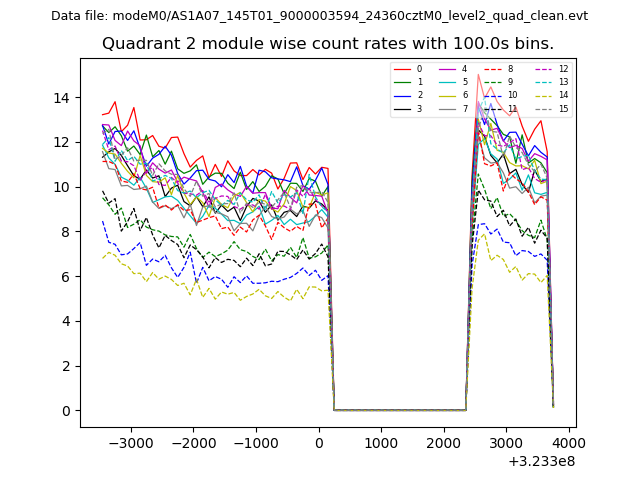
| Module-wise count rates for Quadrant B Data is divided into 100 sec bins |
 |
 |
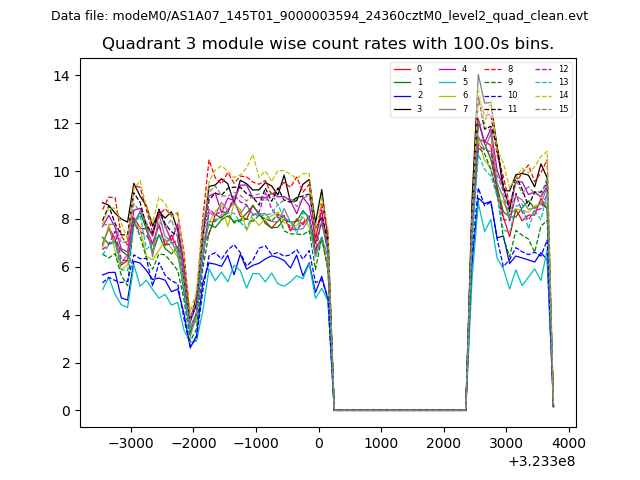
| Module-wise count rates for Quadrant C Data is divided into 100 sec bins |
 |
 |
| Module-wise count rates for Quadrant D Data is divided into 100 sec bins |
 |
 |
| Parameter | Plot |
|---|---|
| CZT HV Monitor | 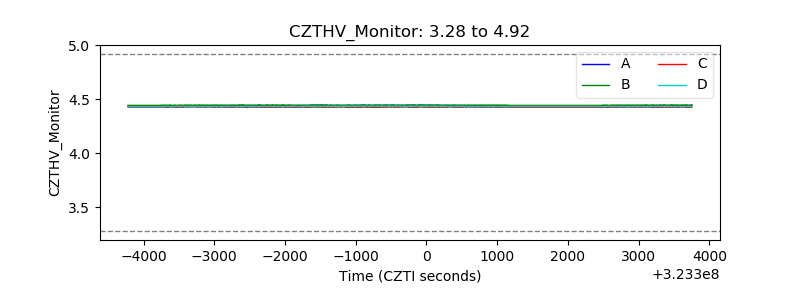 |
| D_VDD | 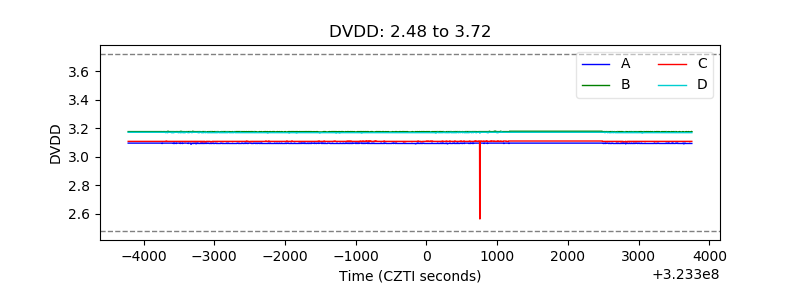 |
| Temperature 1 | 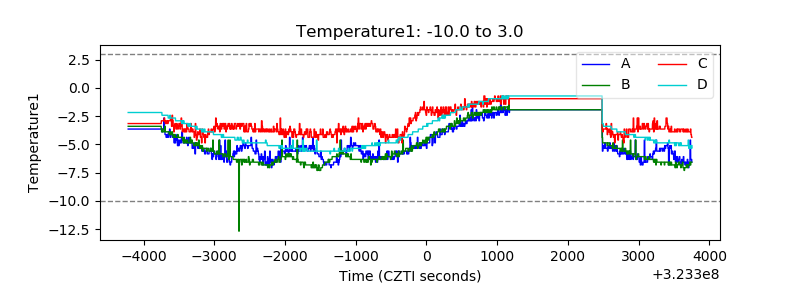 |
| Veto HV Monitor |  |
| Veto LLD | 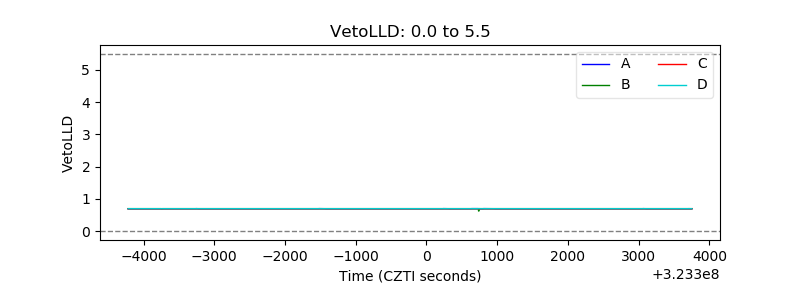 |
| Alpha Counter | 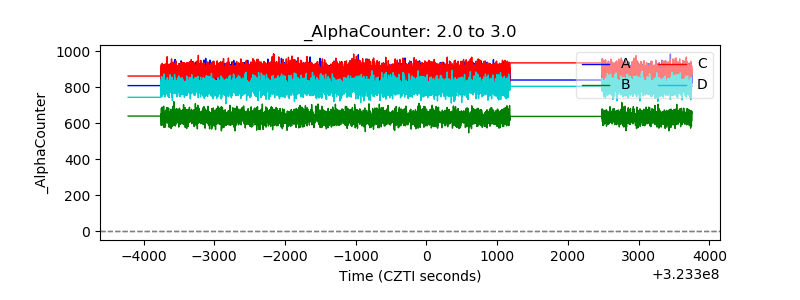 |
| _CPM_Rate | 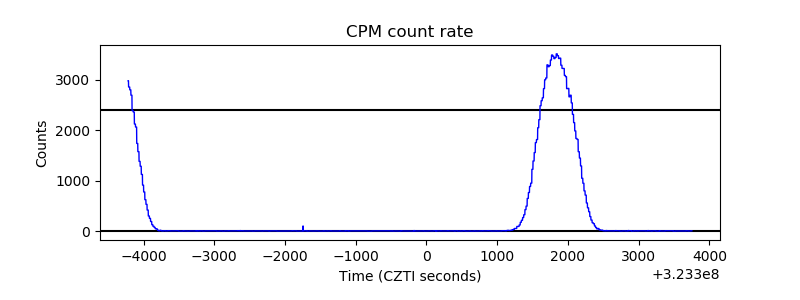 |
| CZT Counter | 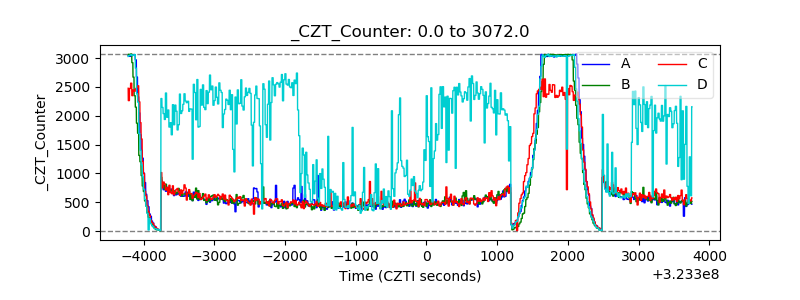 |
| +2.5 Volts monitor | 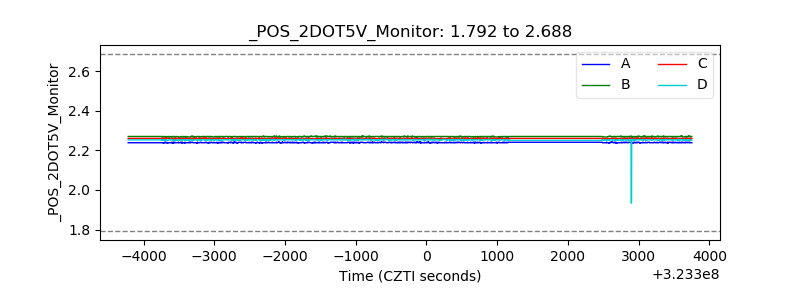 |
| +5 Volts monitor |  |
| _ROLL_ROT | 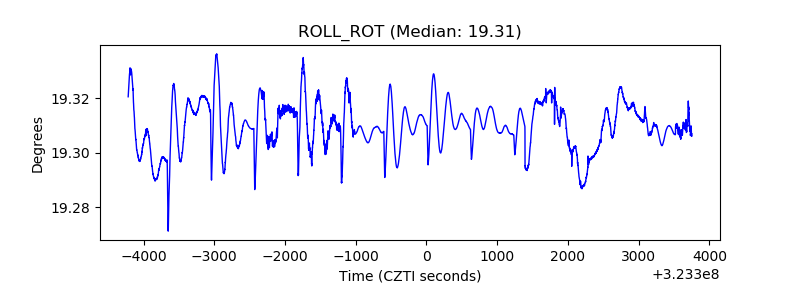 |
| _Roll_DEC | 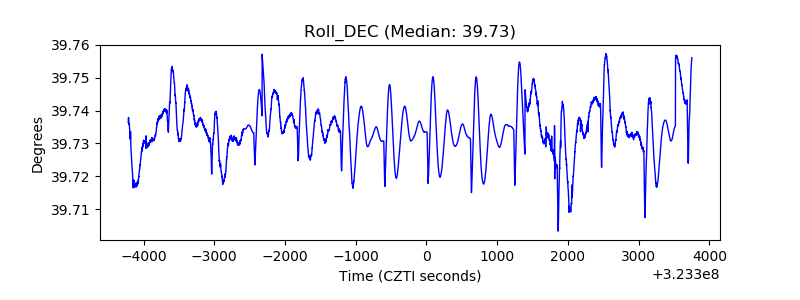 |
| _Roll_RA | 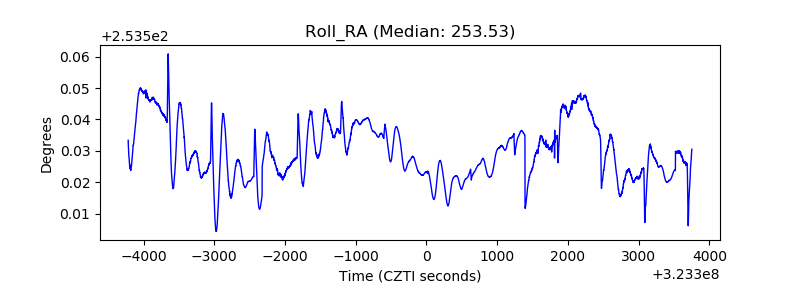 |
| Veto Counter | 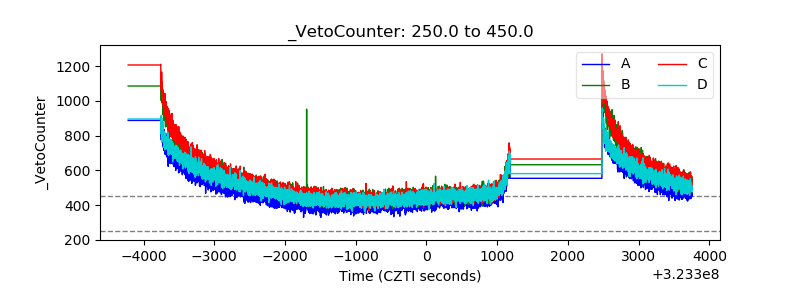 |