| Param | Original file | Final file |
|---|---|---|
| Filename | modeM0/AS1A07_145T01_9000003594_24362cztM0_level2.evt | modeM0/AS1A07_145T01_9000003594_24362cztM0_level2_quad_clean.evt |
| Size (bytes) | 587,223,360 | 98,156,160 |
| Size | 560.0 MB | 93.6 MB |
| Events in quadrant A | 3,057,562 | 646,971 |
| Events in quadrant B | 3,157,682 | 678,719 |
| Events in quadrant C | 3,221,905 | 649,762 |
| Events in quadrant D | 7,926,413 | 563,435 |
| Mode M0 | |||
|---|---|---|---|
| Quadrant | BADHDUFLAG | Total packets | Discarded packets |
| A | 0 | 12995 | 1 |
| B | 0 | 13217 | 1 |
| C | 0 | 13431 | 1 |
| D | 0 | 27802 | 1 |
| Mode M9 | |||
|---|---|---|---|
| Quadrant | BADHDUFLAG | Total packets | Discarded packets |
| A | 0 | 18 | 0 |
| B | 0 | 19 | 0 |
| C | 0 | 19 | 0 |
| D | 0 | 19 | 0 |
| Mode SS | |||
|---|---|---|---|
| Quadrant | BADHDUFLAG | Total packets | Discarded packets |
| A | 0 | 124 | 0 |
| B | 0 | 124 | 0 |
| C | 0 | 124 | 0 |
| D | 0 | 124 | 0 |
| Quadrant | Total seconds | Saturated seconds | Saturation percentage |
|---|---|---|---|
| A | 6210 | 25 | 0.402576% |
| B | 6210 | 36 | 0.579710% |
| C | 6210 | 94 | 1.513688% |
| D | 6210 | 1465 | 23.590982% |
Noise dominated data is calculated using 1-second bins in cleaned event files. If a bin has >2000 counts, and if more than 50% of those come from <1% of pixels, then it is considered to be noise-dominated and hence unusable.
| Quadrant | # 1 sec bins | Bins with >0 counts | Bins with >2000 counts | High rate bins dominated by noise | Noise dominated (total time) | Noise dominated (detector-on time) | Marked lightcurve |
|---|---|---|---|---|---|---|---|
| A | 7510 | 6211 | 0 | 0 | 0.00% | 0.00% | 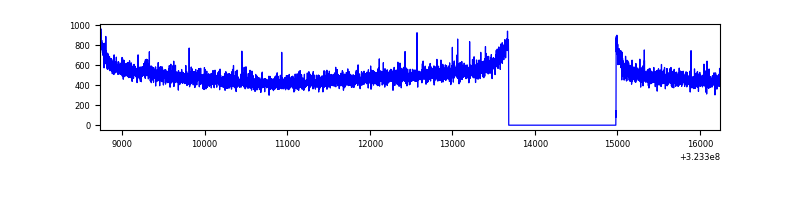 |
| B | 7510 | 6211 | 0 | 0 | 0.00% | 0.00% | 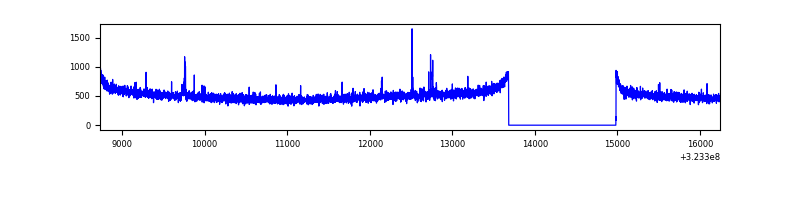 |
| C | 7510 | 6211 | 2 | 2 | 0.03% | 0.03% | 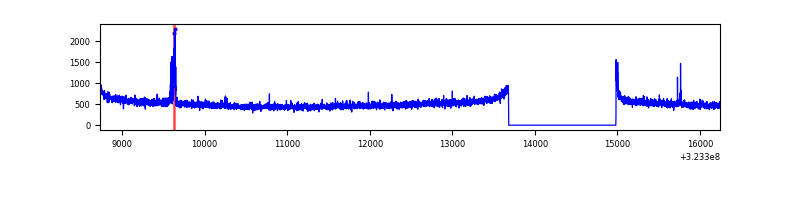 |
| D | 7510 | 6211 | 1121 | 1121 | 14.93% | 18.05% | 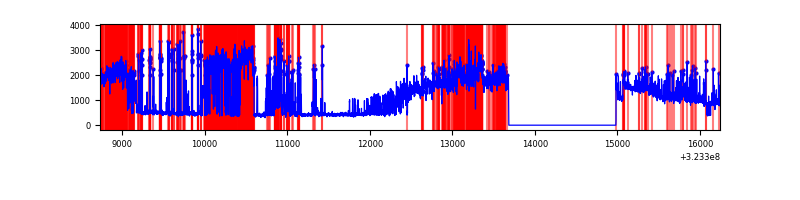 |
Top three noisy pixels from each quadrant. If the there are fewer than three noisy pixels in the level2.evt file, extra rows are filled as -1
| Pixel properties | Quadrant properties | ||||||
|---|---|---|---|---|---|---|---|
| Quadrant | DetID | PixID | Counts | Sigma | Mean | Median | Sigma |
| A | 13 | 254 | 9877 | 57.5 | 792 | 778 | 158.2 |
| A | 3 | 137 | 6848 | 38.36 | 792 | 778 | 158.2 |
| A | 0 | 226 | 6763 | 37.82 | 792 | 778 | 158.2 |
| B | 12 | 111 | 17942 | 114.19 | 801 | 783 | 150.3 |
| B | 0 | 230 | 17617 | 112.03 | 801 | 783 | 150.3 |
| B | 11 | 111 | 15837 | 100.18 | 801 | 783 | 150.3 |
| C | 14 | 238 | 124373 | 685.05 | 774 | 780 | 180.4 |
| C | 3 | 233 | 66123 | 362.18 | 774 | 780 | 180.4 |
| C | 7 | 247 | 18175 | 96.42 | 774 | 780 | 180.4 |
| D | 9 | 35 | 4206409 | 24321.29 | 711 | 691 | 172.9 |
| D | 12 | 233 | 411073 | 2373.2 | 711 | 691 | 172.9 |
| D | 9 | 19 | 313863 | 1811.05 | 711 | 691 | 172.9 |
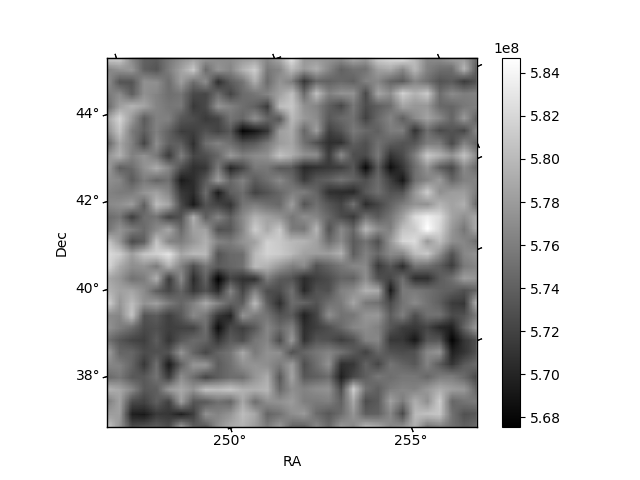
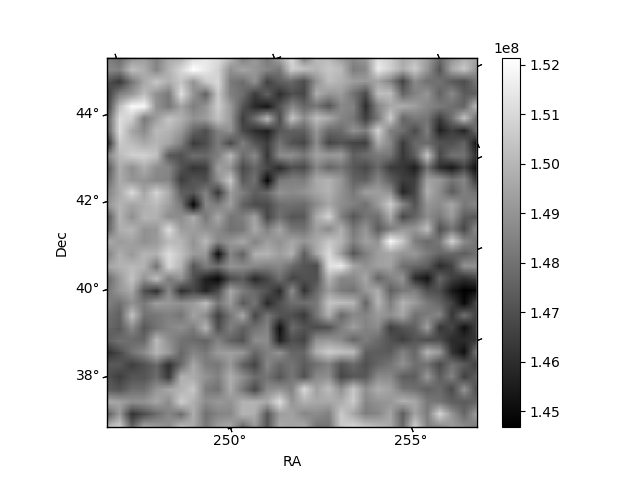
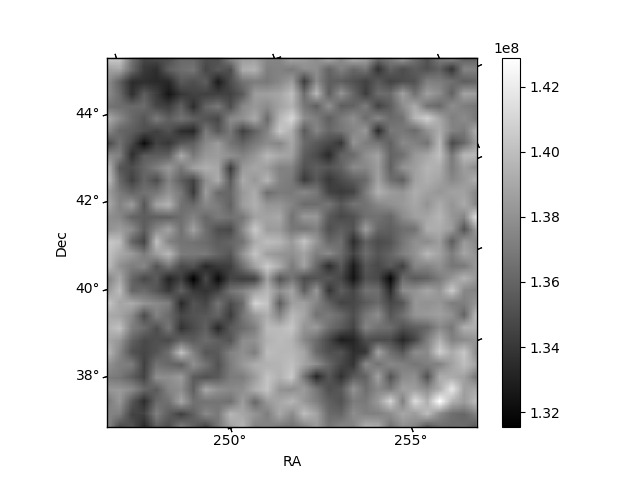
Histogram calculated using DETX and DETY for each event in the final _common_clean file
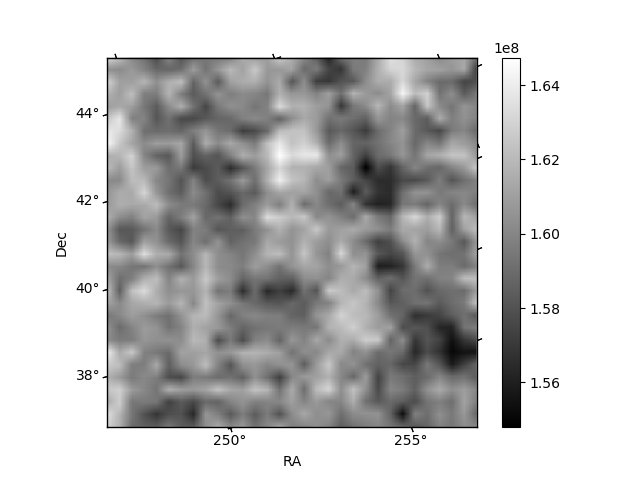
| Quadrant A | 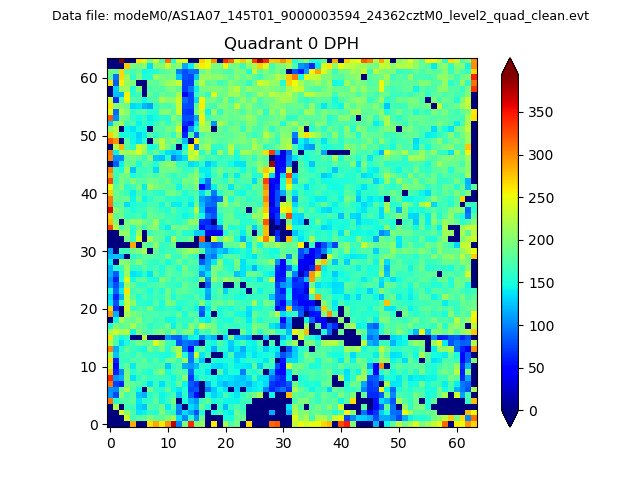 |
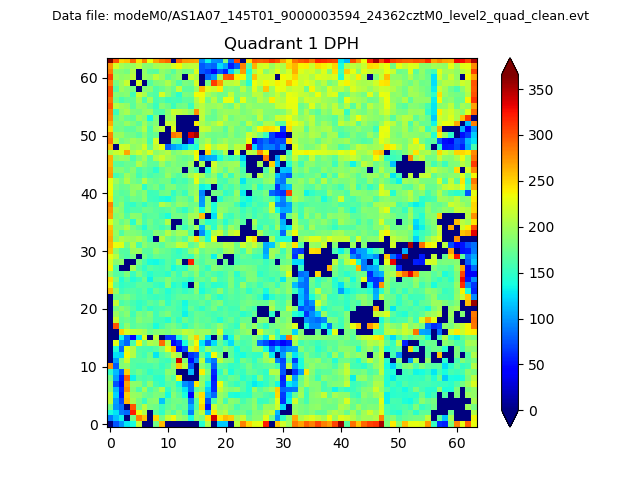 |
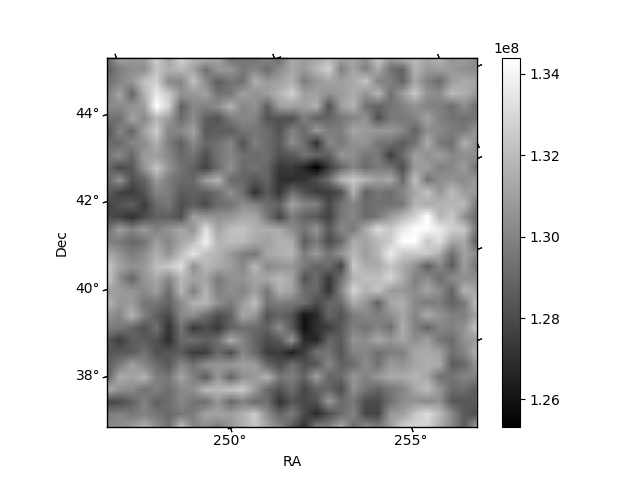
Quadrant B |
|---|---|---|---|
| Quadrant D | 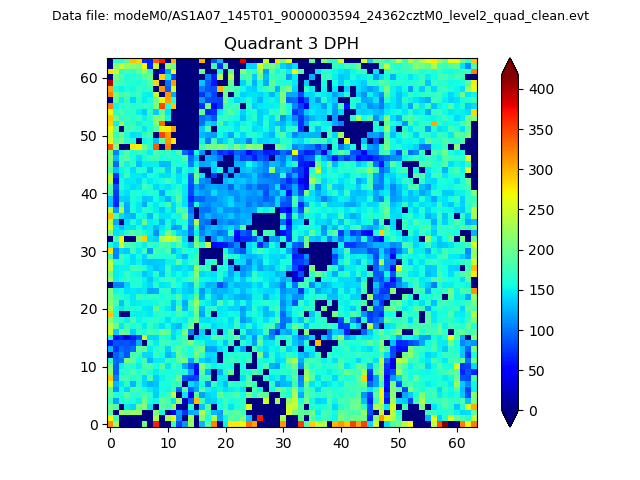 |
 |
Quadrant C |
| Plot type | Count rate plots | Images |
|---|---|---|
| Comparison with Poisson distribution Blue bars denote a histogram of data divided into 1 sec bins. Red curve is a Poisson curve with rate = median count rate of data. |
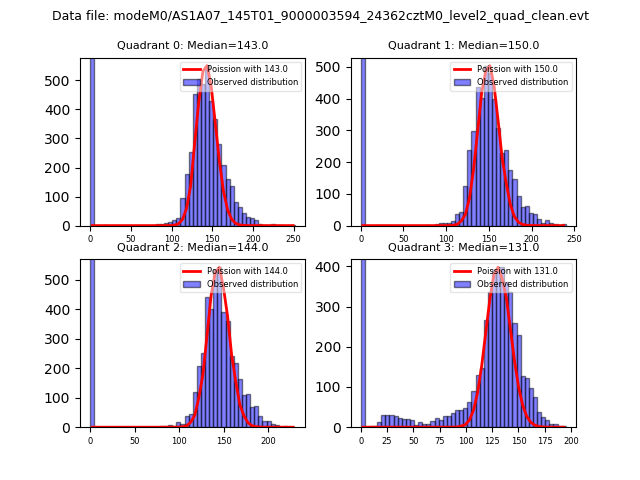 |
 |
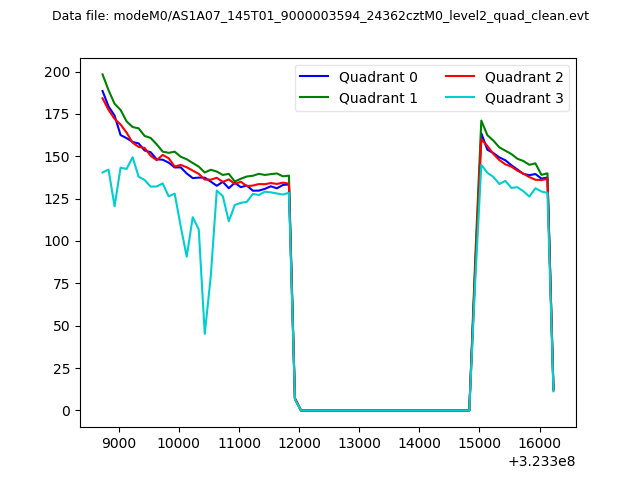
| Quadrant-wise count rates Data is divided into 100 sec bins |
 |
|
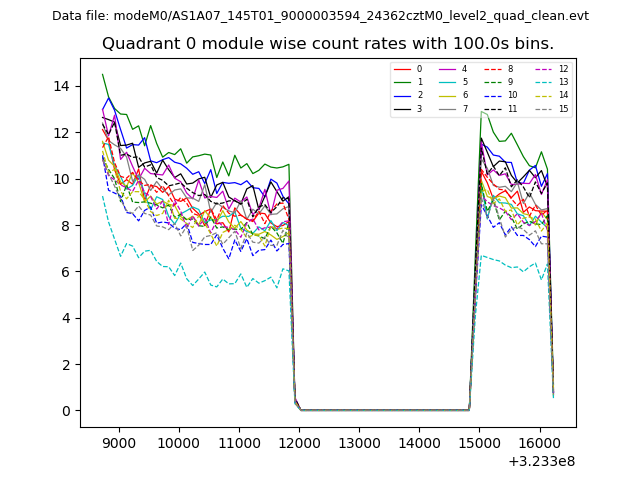
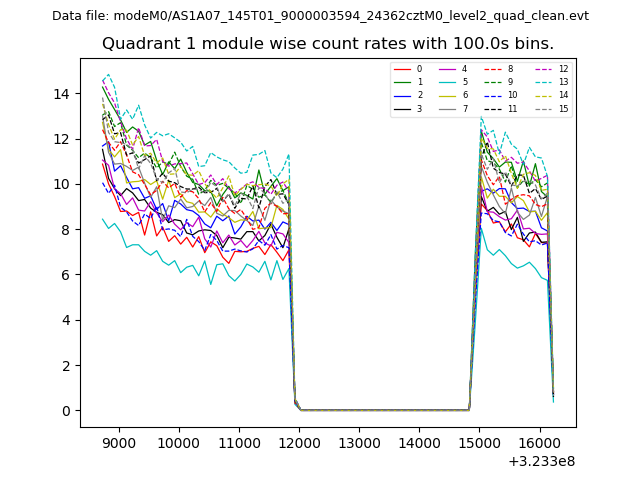
| Module-wise count rates for Quadrant A Data is divided into 100 sec bins |
 |
 |
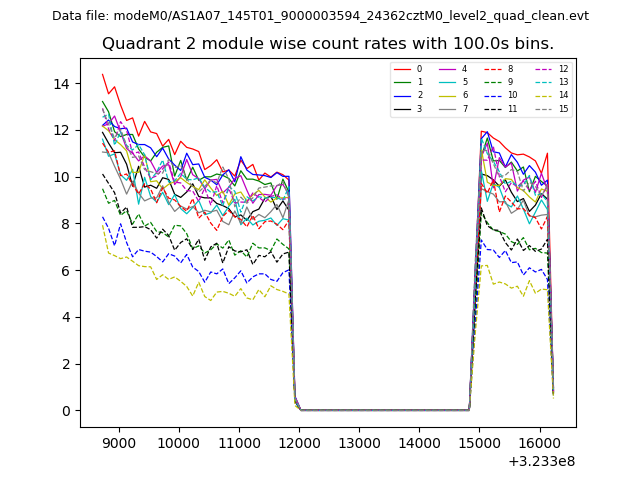
| Module-wise count rates for Quadrant B Data is divided into 100 sec bins |
 |
 |
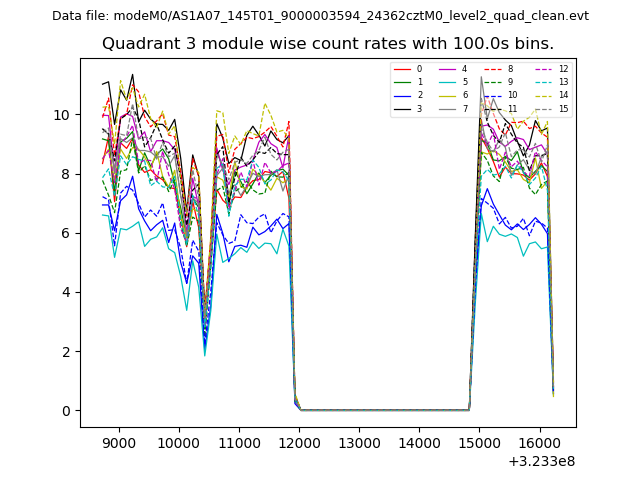
| Module-wise count rates for Quadrant C Data is divided into 100 sec bins |
 |
 |
| Module-wise count rates for Quadrant D Data is divided into 100 sec bins |
 |
 |
| Parameter | Plot |
|---|---|
| CZT HV Monitor | 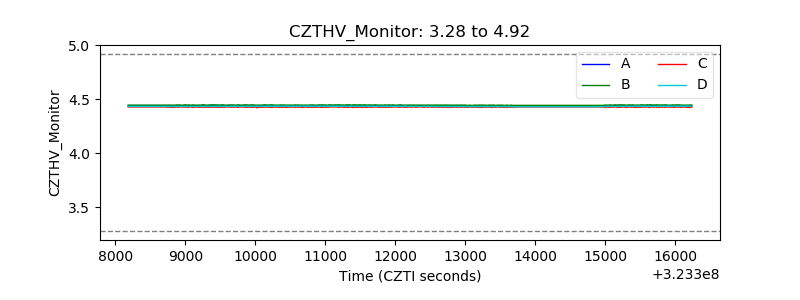 |
| D_VDD | 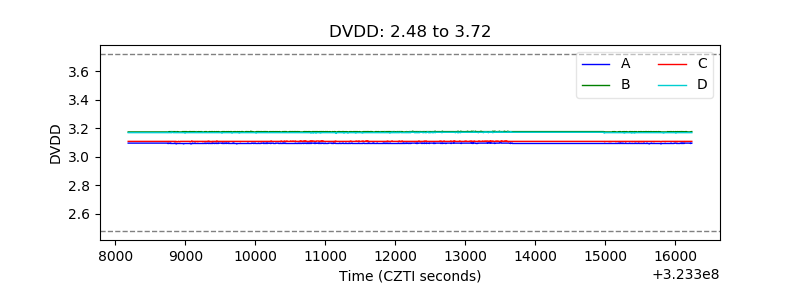 |
| Temperature 1 | 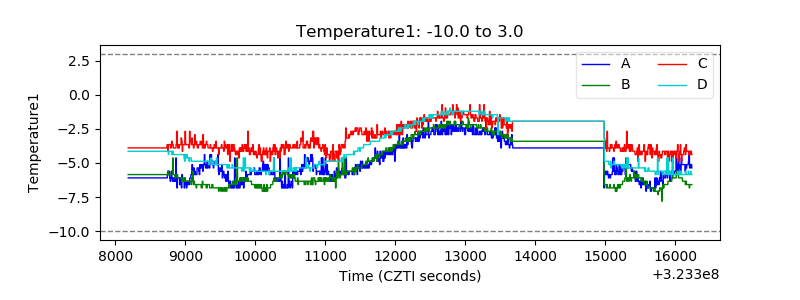 |
| Veto HV Monitor | 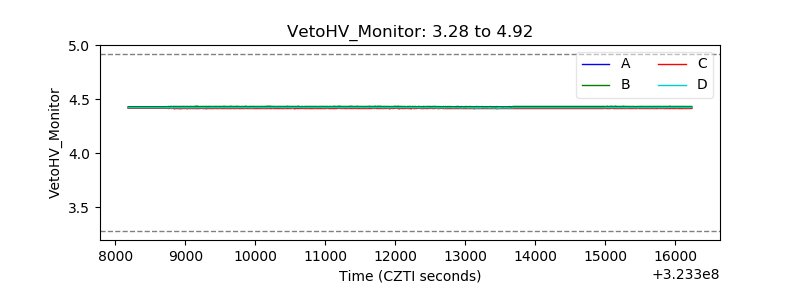 |
| Veto LLD | 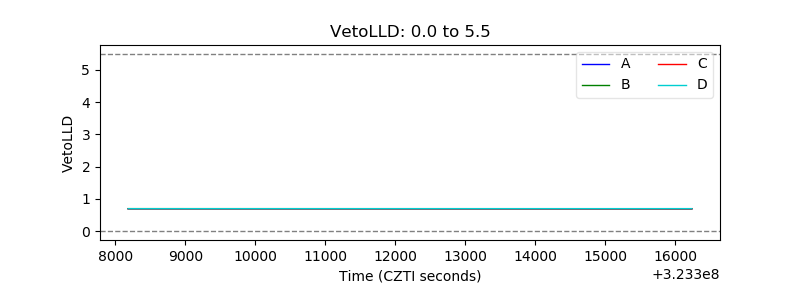 |
| Alpha Counter | 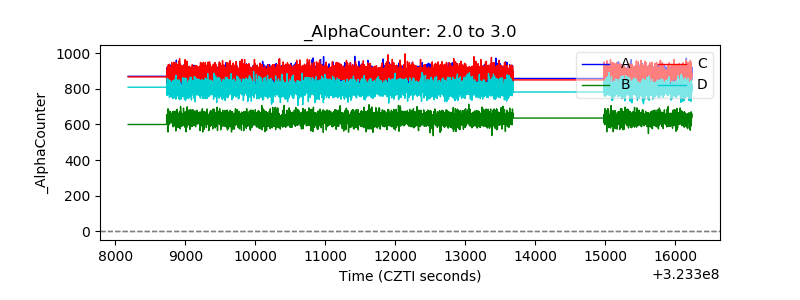 |
| _CPM_Rate | 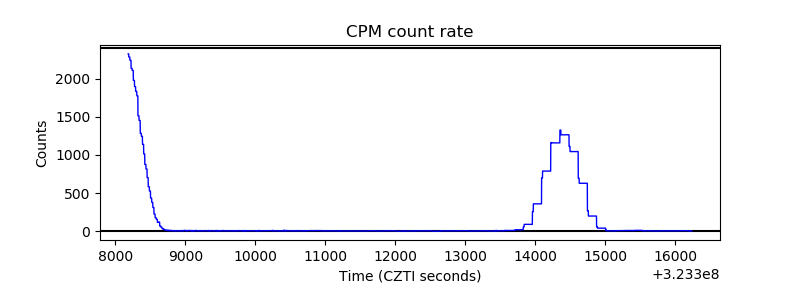 |
| CZT Counter | 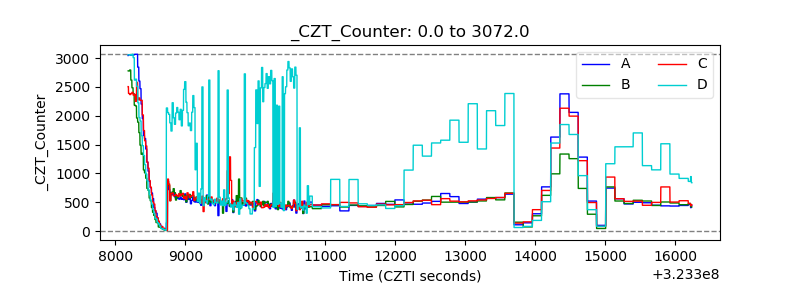 |
| +2.5 Volts monitor |  |
| +5 Volts monitor | 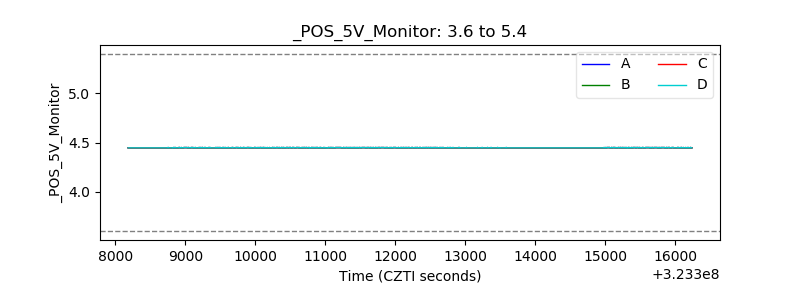 |
| _ROLL_ROT | 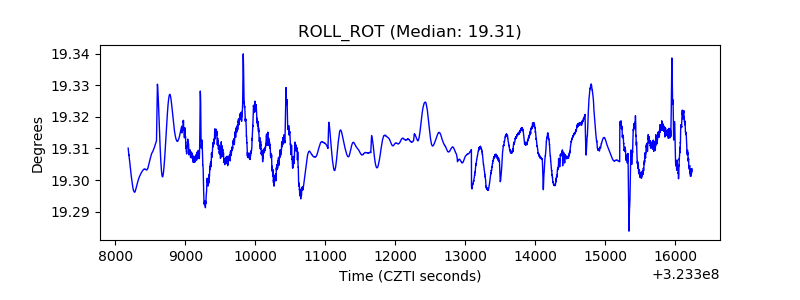 |
| _Roll_DEC |  |
| _Roll_RA | 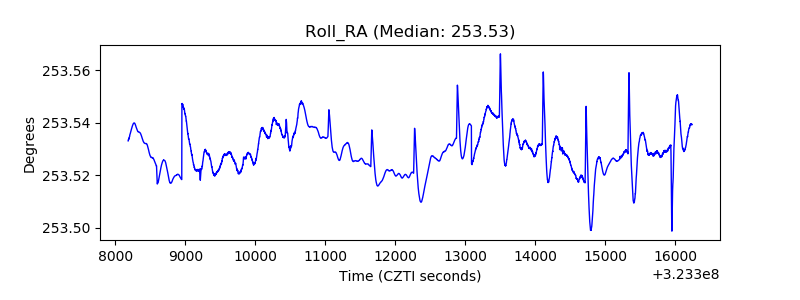 |
| Veto Counter | 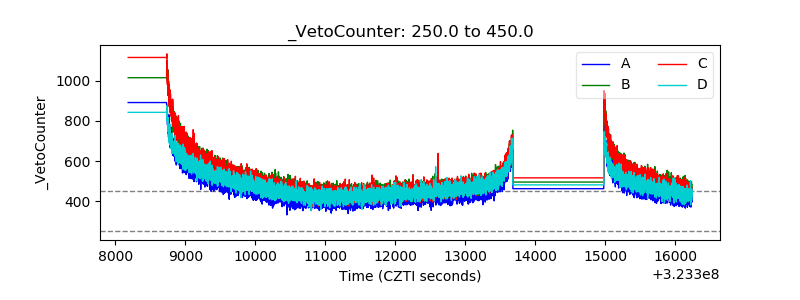 |