| Param | Original file | Final file |
|---|---|---|
| Filename | modeM0/AS1A07_145T01_9000003594_24363cztM0_level2.evt | modeM0/AS1A07_145T01_9000003594_24363cztM0_level2_quad_clean.evt |
| Size (bytes) | 366,537,600 | 56,678,400 |
| Size | 349.6 MB | 54.1 MB |
| Events in quadrant A | 1,998,131 | 356,748 |
| Events in quadrant B | 2,043,381 | 371,428 |
| Events in quadrant C | 2,108,269 | 358,497 |
| Events in quadrant D | 4,667,481 | 336,794 |
| Mode M0 | |||
|---|---|---|---|
| Quadrant | BADHDUFLAG | Total packets | Discarded packets |
| A | 0 | 10094 | 1441 |
| B | 0 | 10185 | 1515 |
| C | 0 | 10215 | 1416 |
| D | 0 | 21095 | 4358 |
| Mode M9 | |||
|---|---|---|---|
| Quadrant | BADHDUFLAG | Total packets | Discarded packets |
| A | 0 | 13 | 1 |
| B | 0 | 13 | 1 |
| C | 0 | 13 | 0 |
| D | 0 | 13 | 0 |
| Mode SS | |||
|---|---|---|---|
| Quadrant | BADHDUFLAG | Total packets | Discarded packets |
| A | 0 | 97 | 11 |
| B | 0 | 98 | 16 |
| C | 0 | 98 | 10 |
| D | 0 | 98 | 10 |
| Quadrant | Total seconds | Saturated seconds | Saturation percentage |
|---|---|---|---|
| A | 4198 | 16 | 0.381134% |
| B | 4165 | 32 | 0.768307% |
| C | 4215 | 66 | 1.565836% |
| D | 3994 | 680 | 17.025538% |
Noise dominated data is calculated using 1-second bins in cleaned event files. If a bin has >2000 counts, and if more than 50% of those come from <1% of pixels, then it is considered to be noise-dominated and hence unusable.
| Quadrant | # 1 sec bins | Bins with >0 counts | Bins with >2000 counts | High rate bins dominated by noise | Noise dominated (total time) | Noise dominated (detector-on time) | Marked lightcurve |
|---|---|---|---|---|---|---|---|
| A | 6050 | 4472 | 0 | 0 | 0.00% | 0.00% | 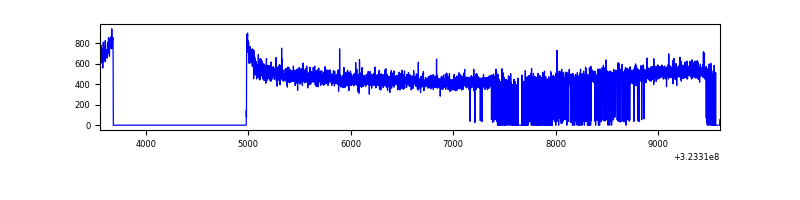 |
| B | 6033 | 4447 | 2 | 2 | 0.03% | 0.04% | 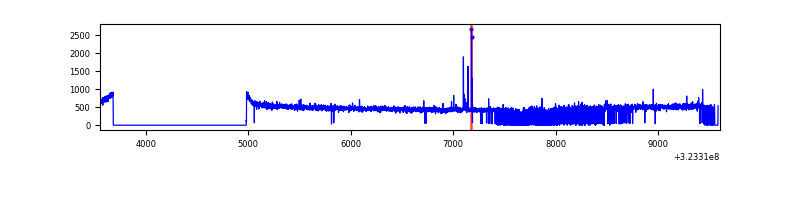 |
| C | 6041 | 4483 | 0 | 0 | 0.00% | 0.00% | 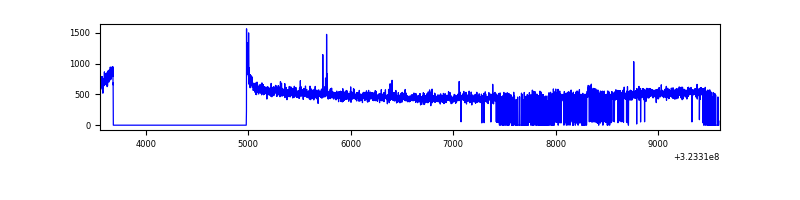 |
| D | 5952 | 4314 | 429 | 429 | 7.21% | 9.94% | 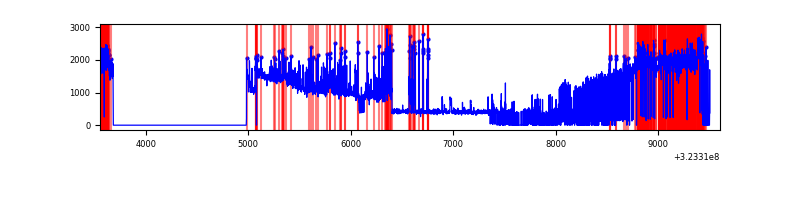 |
Top three noisy pixels from each quadrant. If the there are fewer than three noisy pixels in the level2.evt file, extra rows are filled as -1
| Pixel properties | Quadrant properties | ||||||
|---|---|---|---|---|---|---|---|
| Quadrant | DetID | PixID | Counts | Sigma | Mean | Median | Sigma |
| A | 13 | 254 | 6412 | 56.44 | 518 | 507 | 104.6 |
| A | 3 | 137 | 4473 | 37.9 | 518 | 507 | 104.6 |
| A | 0 | 226 | 4429 | 37.48 | 518 | 507 | 104.6 |
| B | 6 | 36 | 14147 | 137.43 | 516 | 503 | 99.3 |
| B | 12 | 111 | 11377 | 109.53 | 516 | 503 | 99.3 |
| B | 11 | 111 | 10333 | 99.02 | 516 | 503 | 99.3 |
| C | 14 | 238 | 82070 | 694.4 | 501 | 505 | 117.5 |
| C | 7 | 247 | 42242 | 355.32 | 501 | 505 | 117.5 |
| C | 3 | 233 | 22079 | 183.67 | 501 | 505 | 117.5 |
| D | 9 | 35 | 2337671 | 21099.06 | 455 | 441 | 110.8 |
| D | 9 | 19 | 319283 | 2878.31 | 455 | 441 | 110.8 |
| D | 12 | 233 | 84628 | 759.99 | 455 | 441 | 110.8 |
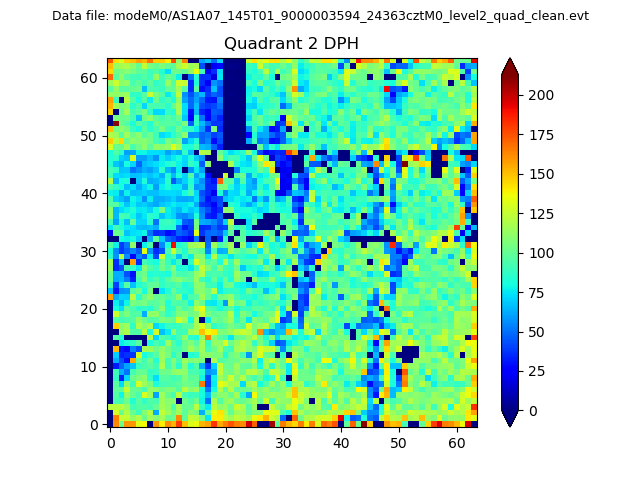
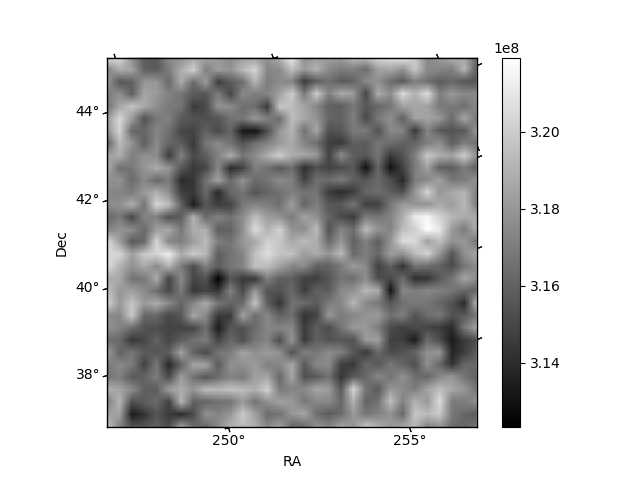
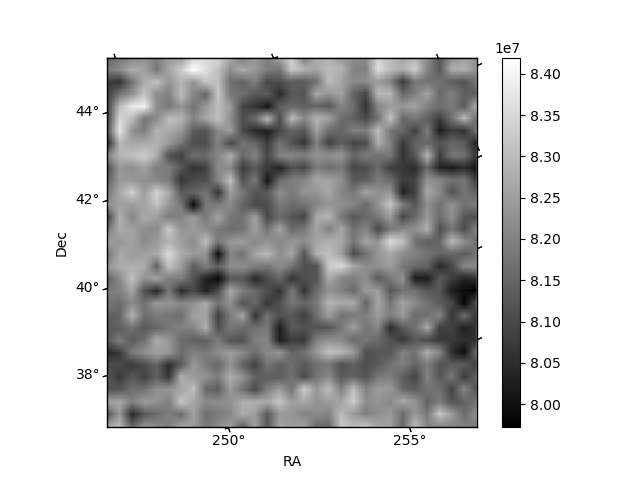
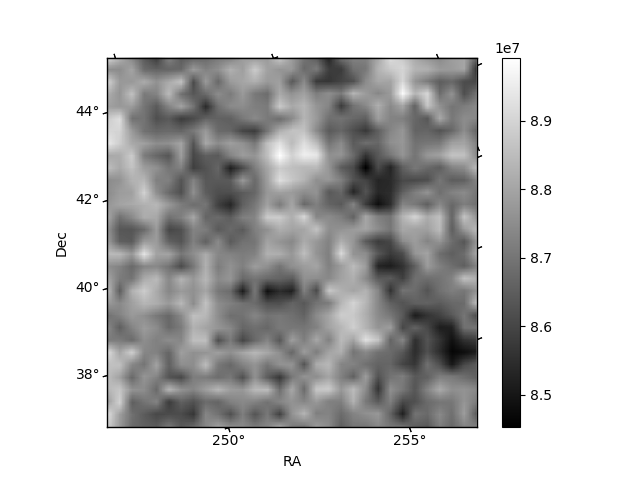
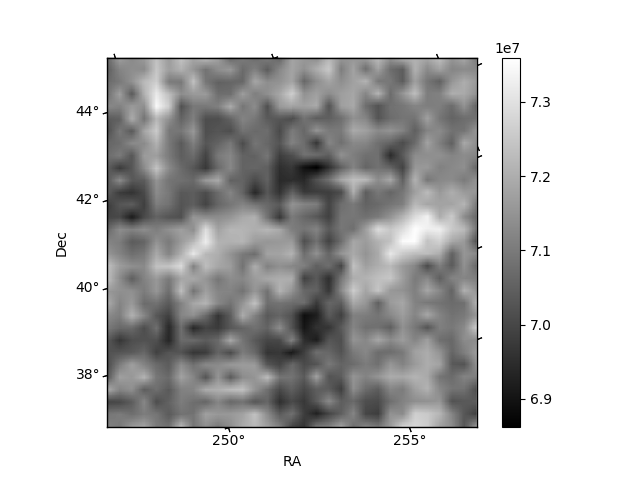
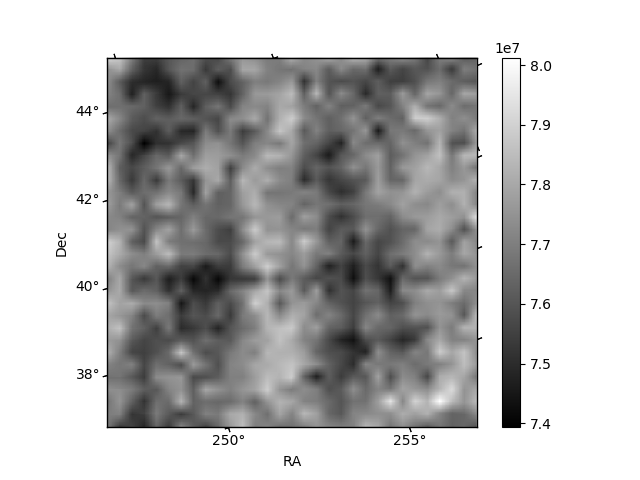
Histogram calculated using DETX and DETY for each event in the final _common_clean file
| Quadrant A | 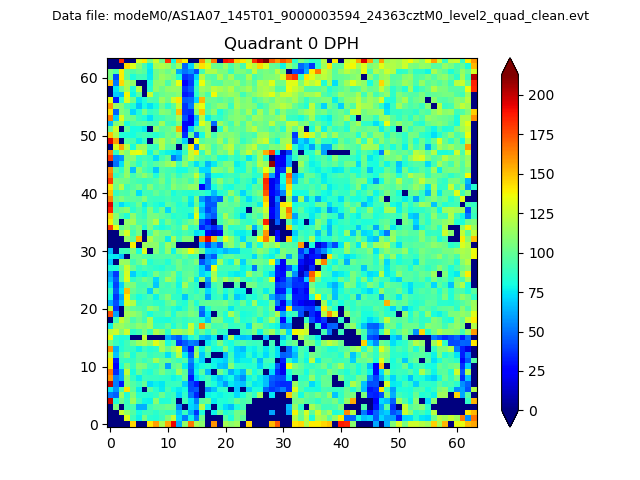 |
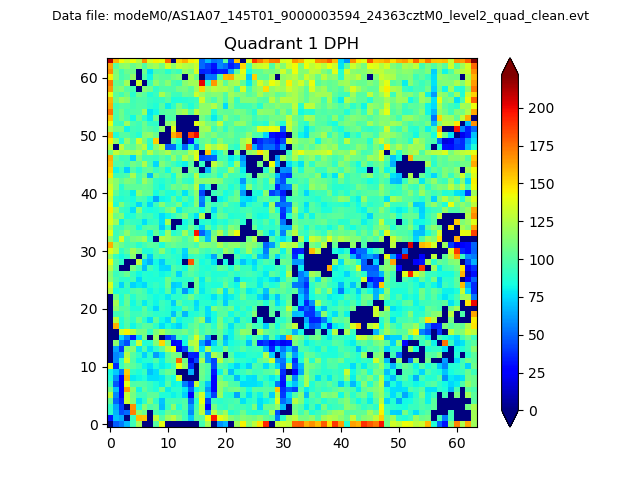 |
Quadrant B |
|---|---|---|---|
| Quadrant D | 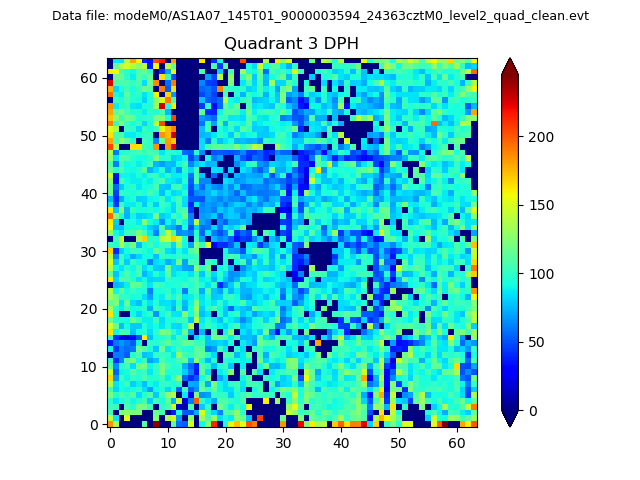 |
 |
Quadrant C |
| Plot type | Count rate plots | Images |
|---|---|---|
| Comparison with Poisson distribution Blue bars denote a histogram of data divided into 1 sec bins. Red curve is a Poisson curve with rate = median count rate of data. |
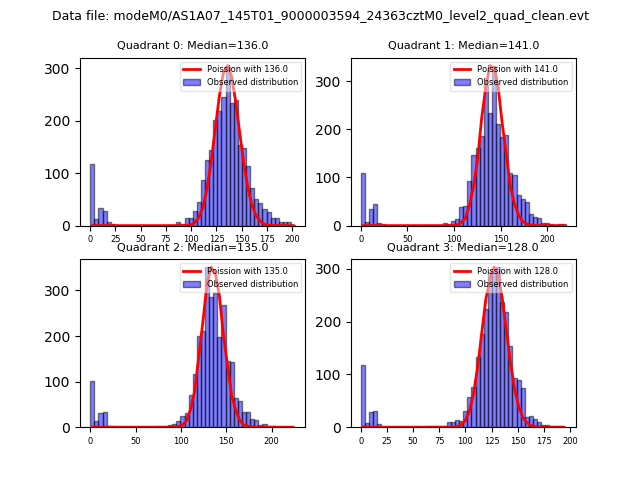 |
 |
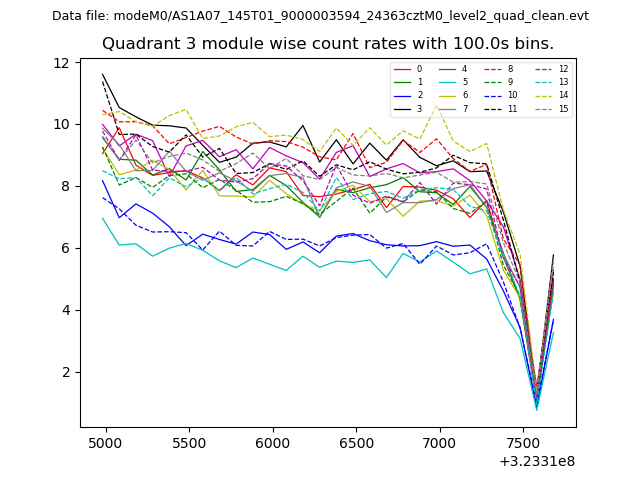
| Quadrant-wise count rates Data is divided into 100 sec bins |
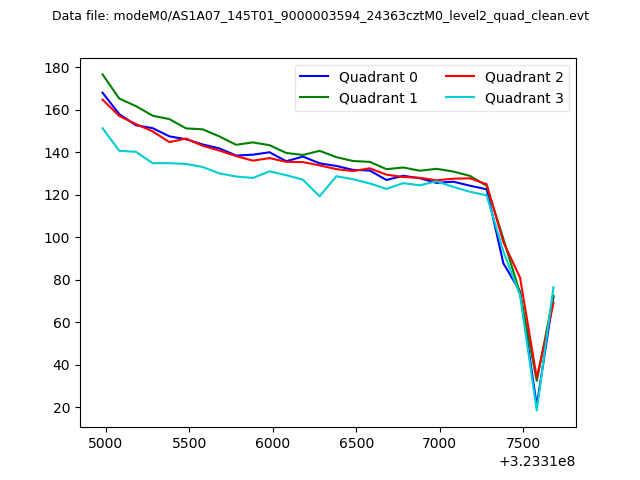 |
|
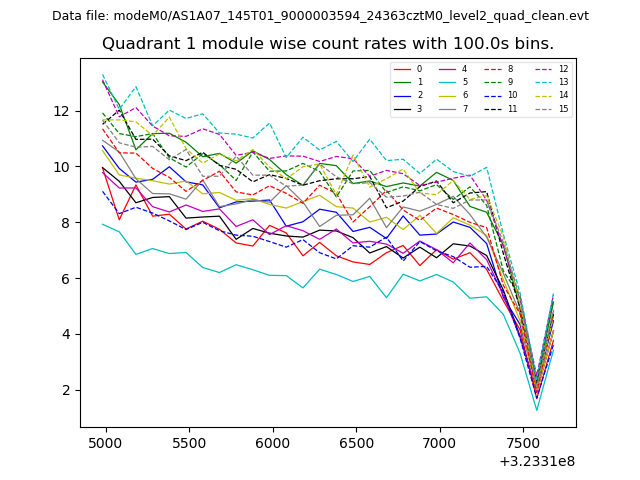
| Module-wise count rates for Quadrant A Data is divided into 100 sec bins |
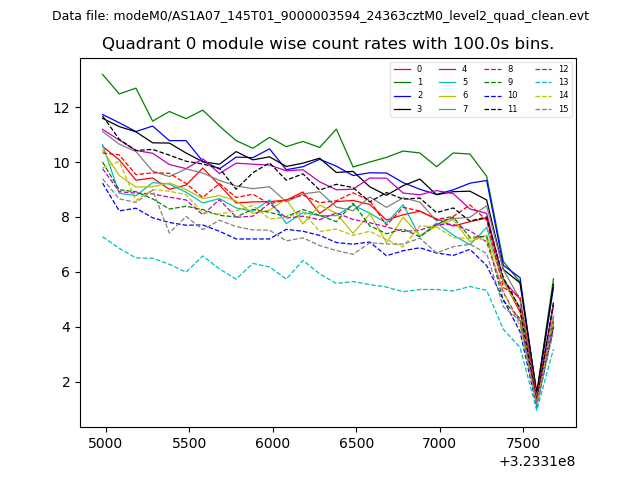 |
 |
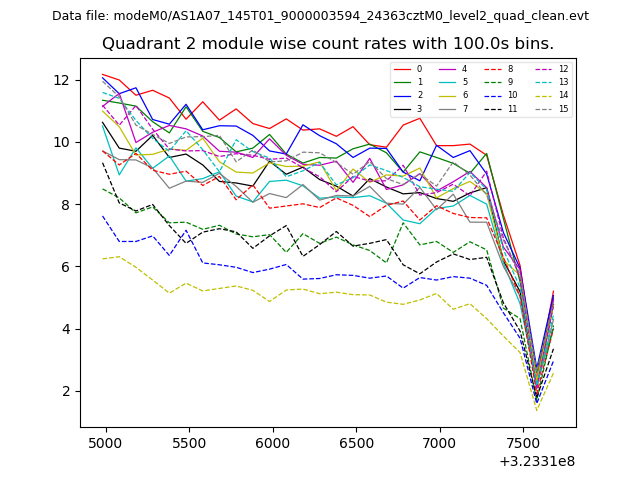
| Module-wise count rates for Quadrant B Data is divided into 100 sec bins |
 |
 |
| Module-wise count rates for Quadrant C Data is divided into 100 sec bins |
 |
 |
| Module-wise count rates for Quadrant D Data is divided into 100 sec bins |
 |
 |
| Parameter | Plot |
|---|---|
| CZT HV Monitor | 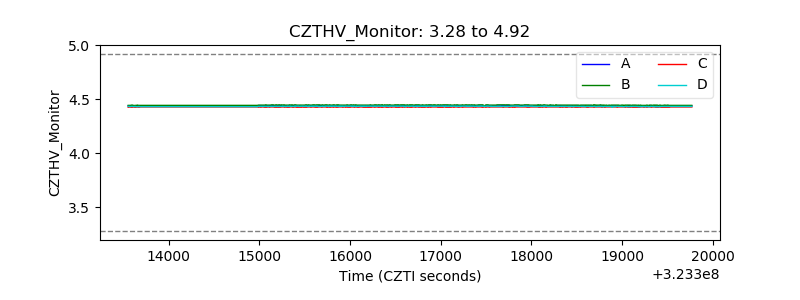 |
| D_VDD | 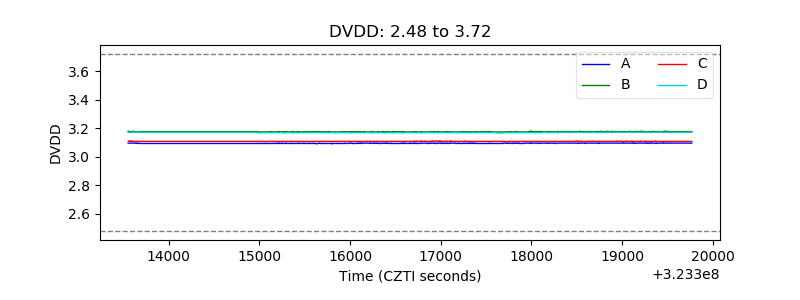 |
| Temperature 1 | 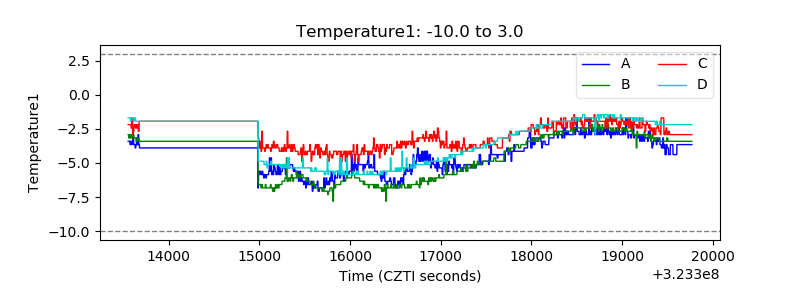 |
| Veto HV Monitor |  |
| Veto LLD |  |
| Alpha Counter | 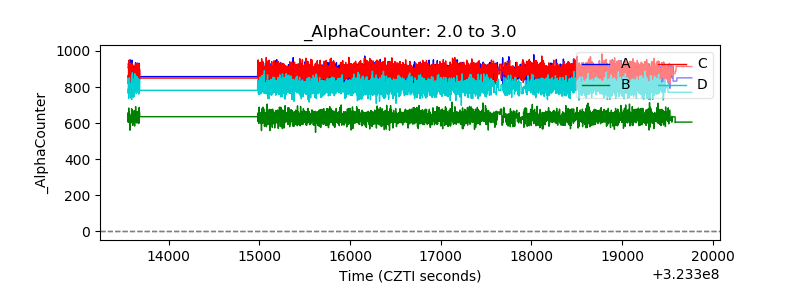 |
| _CPM_Rate | 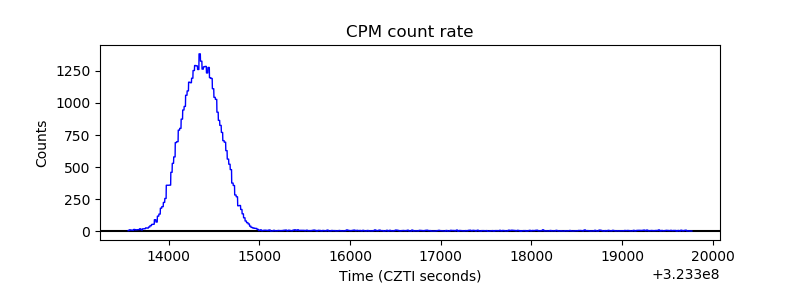 |
| CZT Counter | 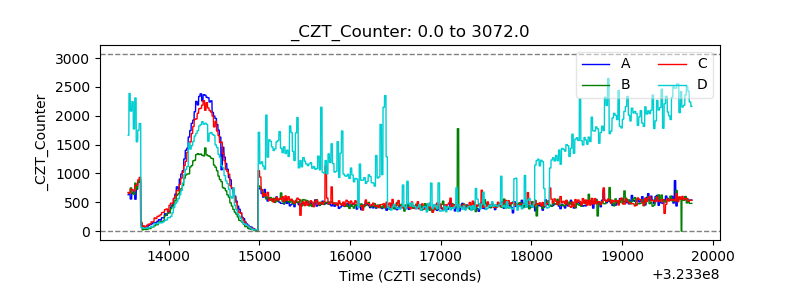 |
| +2.5 Volts monitor |  |
| +5 Volts monitor |  |
| _ROLL_ROT | 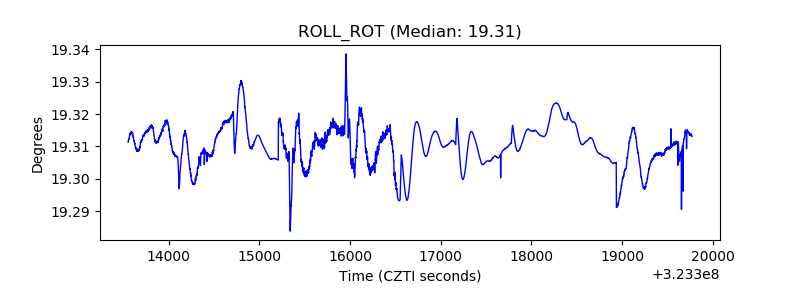 |
| _Roll_DEC | 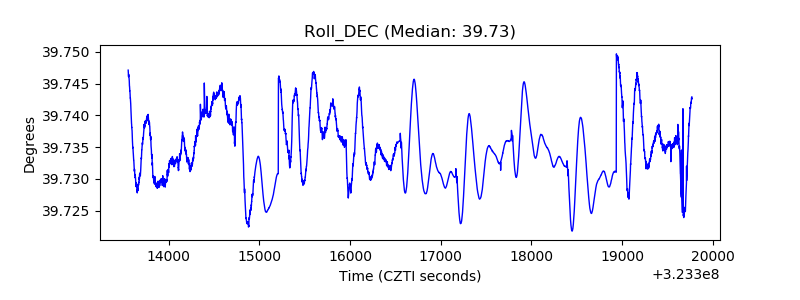 |
| _Roll_RA | 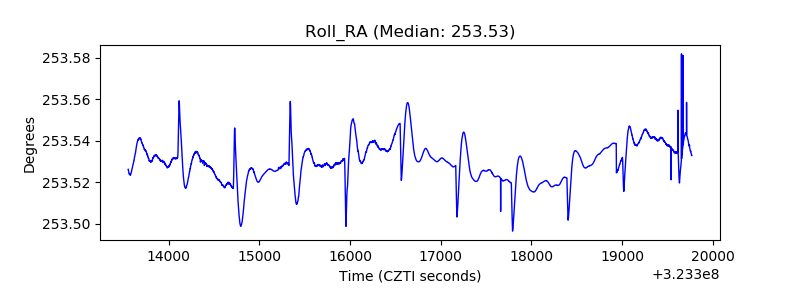 |
| Veto Counter | 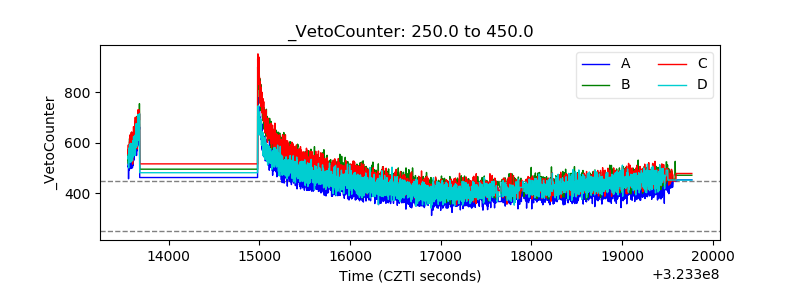 |