| Param | Original file | Final file |
|---|---|---|
| Filename | modeM0/AS1A07_145T01_9000003594_24364cztM0_level2.evt | modeM0/AS1A07_145T01_9000003594_24364cztM0_level2_quad_clean.evt |
| Size (bytes) | 593,925,120 | 90,927,360 |
| Size | 566.4 MB | 86.7 MB |
| Events in quadrant A | 3,115,750 | 577,962 |
| Events in quadrant B | 3,203,538 | 599,692 |
| Events in quadrant C | 3,397,918 | 574,241 |
| Events in quadrant D | 7,825,484 | 544,724 |
| Mode M0 | |||
|---|---|---|---|
| Quadrant | BADHDUFLAG | Total packets | Discarded packets |
| A | 0 | 14315 | 774 |
| B | 0 | 14471 | 751 |
| C | 0 | 15431 | 850 |
| D | 0 | 28674 | 862 |
| Mode M9 | |||
|---|---|---|---|
| Quadrant | BADHDUFLAG | Total packets | Discarded packets |
| A | 0 | 13 | 0 |
| B | 0 | 14 | 0 |
| C | 0 | 14 | 0 |
| D | 0 | 14 | 0 |
| Mode SS | |||
|---|---|---|---|
| Quadrant | BADHDUFLAG | Total packets | Discarded packets |
| A | 0 | 140 | 10 |
| B | 0 | 140 | 4 |
| C | 0 | 139 | 5 |
| D | 0 | 140 | 8 |
| Quadrant | Total seconds | Saturated seconds | Saturation percentage |
|---|---|---|---|
| A | 6552 | 101 | 1.541514% |
| B | 6563 | 137 | 2.087460% |
| C | 6530 | 148 | 2.266462% |
| D | 6539 | 1737 | 26.563695% |
Noise dominated data is calculated using 1-second bins in cleaned event files. If a bin has >2000 counts, and if more than 50% of those come from <1% of pixels, then it is considered to be noise-dominated and hence unusable.
| Quadrant | # 1 sec bins | Bins with >0 counts | Bins with >2000 counts | High rate bins dominated by noise | Noise dominated (total time) | Noise dominated (detector-on time) | Marked lightcurve |
|---|---|---|---|---|---|---|---|
| A | 7505 | 6687 | 0 | 0 | 0.00% | 0.00% | 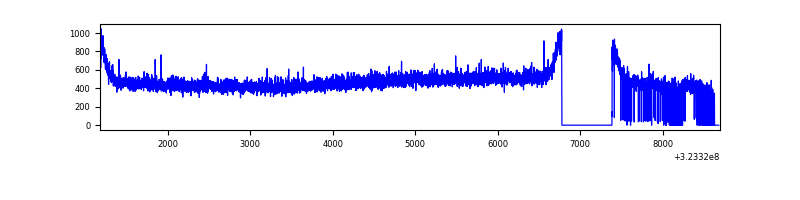 |
| B | 7519 | 6699 | 0 | 0 | 0.00% | 0.00% | 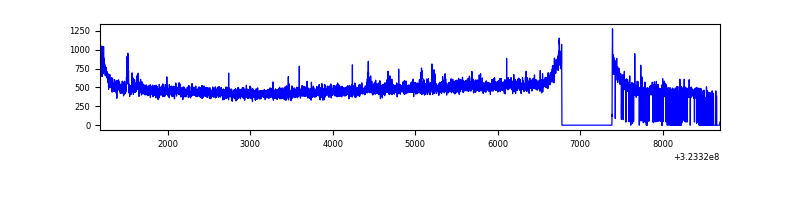 |
| C | 7474 | 6664 | 0 | 0 | 0.00% | 0.00% | 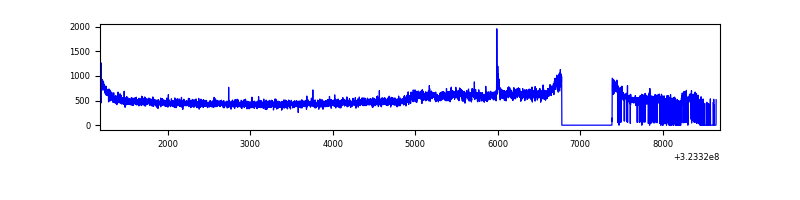 |
| D | 7438 | 6679 | 1549 | 1549 | 20.83% | 23.19% | 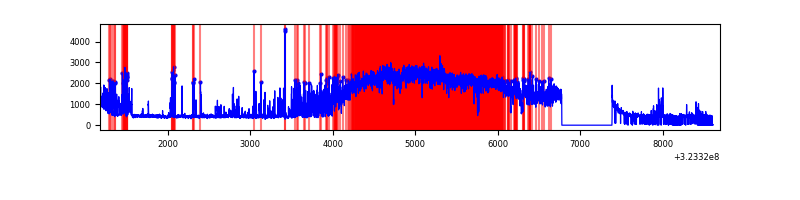 |
Top three noisy pixels from each quadrant. If the there are fewer than three noisy pixels in the level2.evt file, extra rows are filled as -1
| Pixel properties | Quadrant properties | ||||||
|---|---|---|---|---|---|---|---|
| Quadrant | DetID | PixID | Counts | Sigma | Mean | Median | Sigma |
| A | 13 | 254 | 9942 | 55.83 | 808 | 790 | 163.9 |
| A | 3 | 137 | 7582 | 41.43 | 808 | 790 | 163.9 |
| A | 0 | 226 | 6864 | 37.05 | 808 | 790 | 163.9 |
| B | 12 | 111 | 19202 | 118.28 | 809 | 788 | 155.7 |
| B | 0 | 230 | 18431 | 113.33 | 809 | 788 | 155.7 |
| B | 11 | 111 | 17228 | 105.6 | 809 | 788 | 155.7 |
| C | 7 | 247 | 226076 | 1242.37 | 776 | 782 | 181.3 |
| C | 14 | 238 | 123507 | 676.76 | 776 | 782 | 181.3 |
| C | 2 | 16 | 19716 | 104.41 | 776 | 782 | 181.3 |
| D | 9 | 35 | 4334921 | 24368.27 | 724 | 701 | 177.9 |
| D | 1 | 52 | 353809 | 1985.28 | 724 | 701 | 177.9 |
| D | 7 | 238 | 272630 | 1528.86 | 724 | 701 | 177.9 |
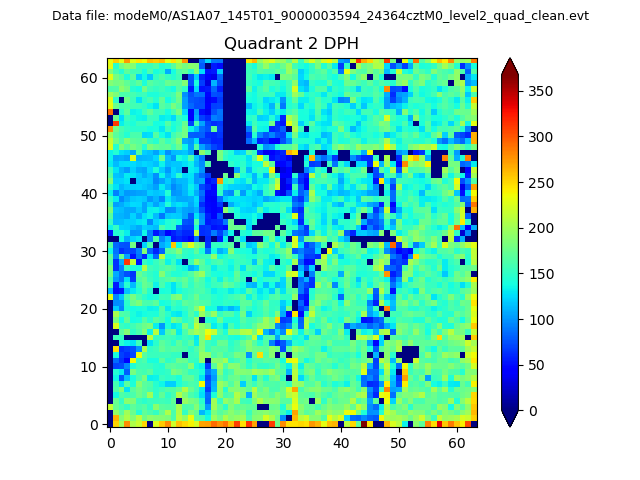
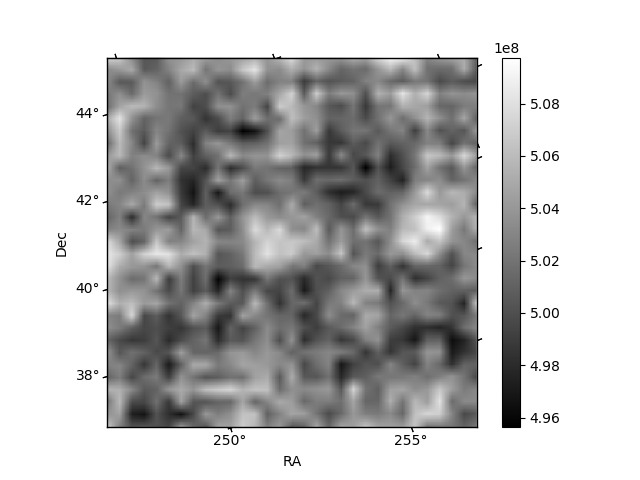
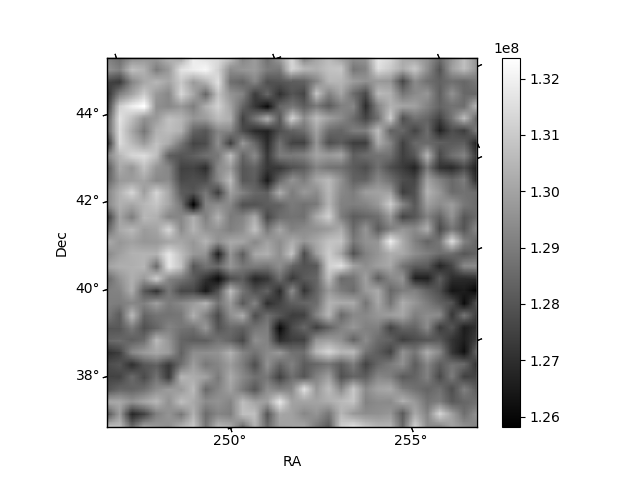
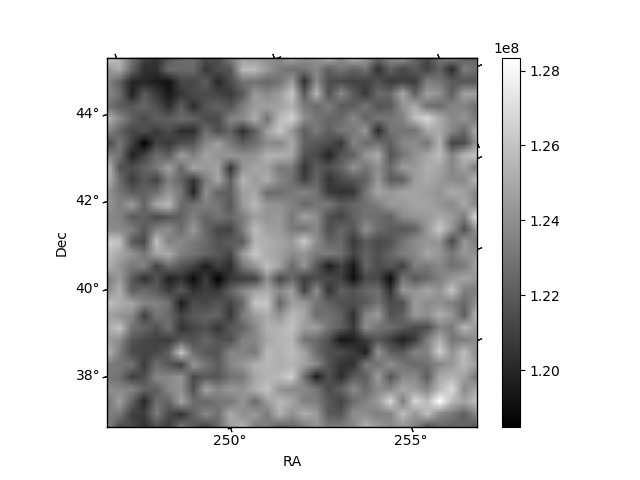
Histogram calculated using DETX and DETY for each event in the final _common_clean file
| Quadrant A | 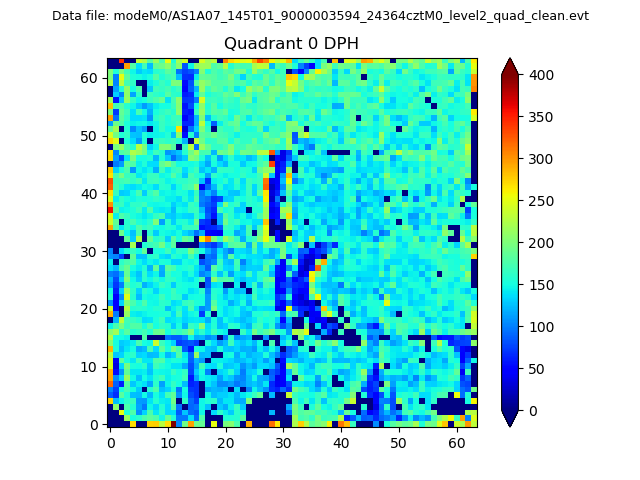 |
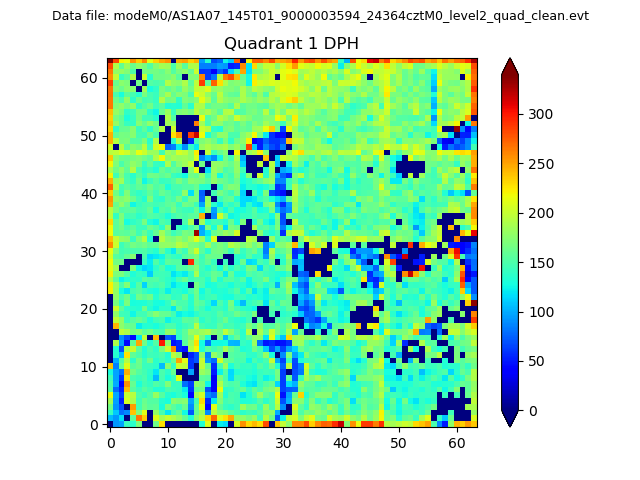 |
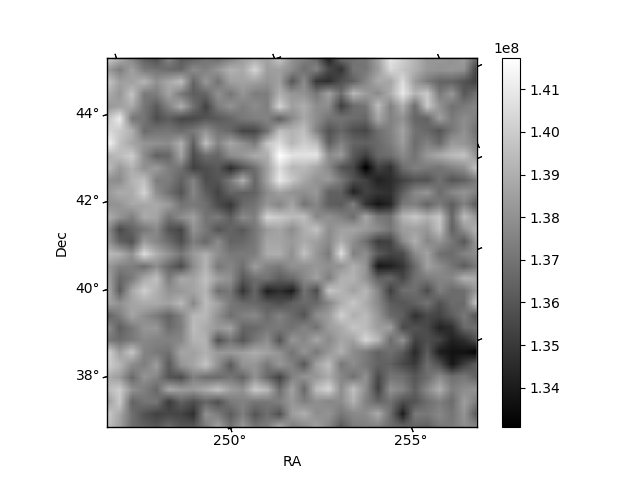
Quadrant B |
|---|---|---|---|
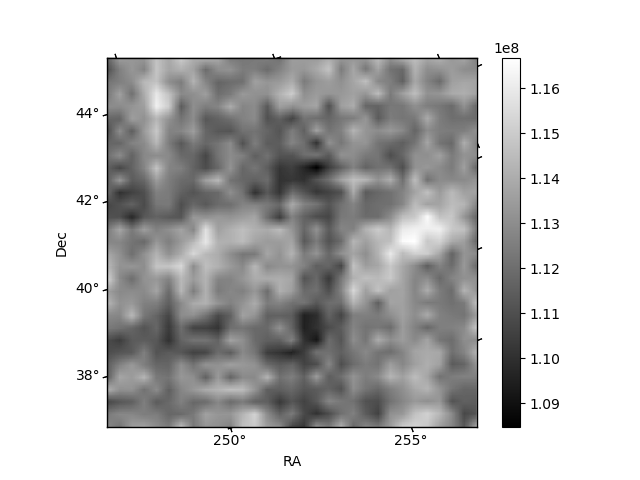
| Quadrant D | 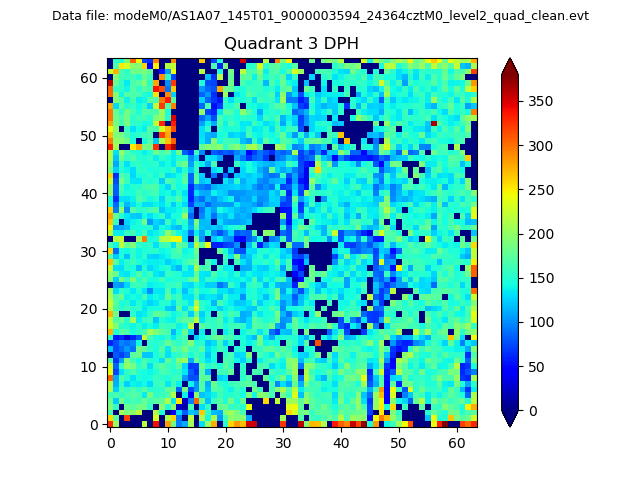 |
 |
Quadrant C |
| Plot type | Count rate plots | Images |
|---|---|---|
| Comparison with Poisson distribution Blue bars denote a histogram of data divided into 1 sec bins. Red curve is a Poisson curve with rate = median count rate of data. |
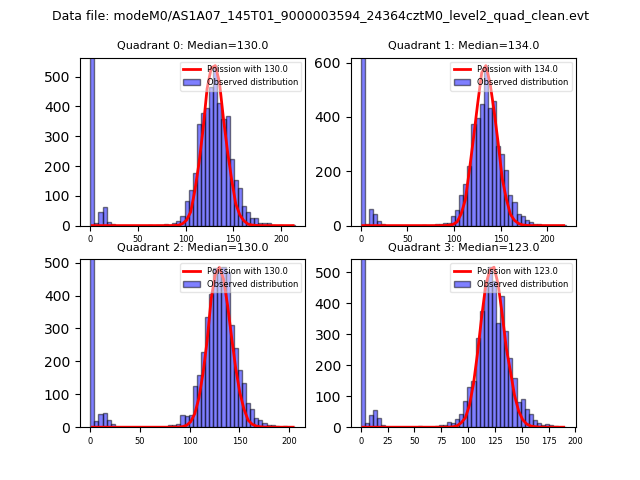 |
 |
| Quadrant-wise count rates Data is divided into 100 sec bins |
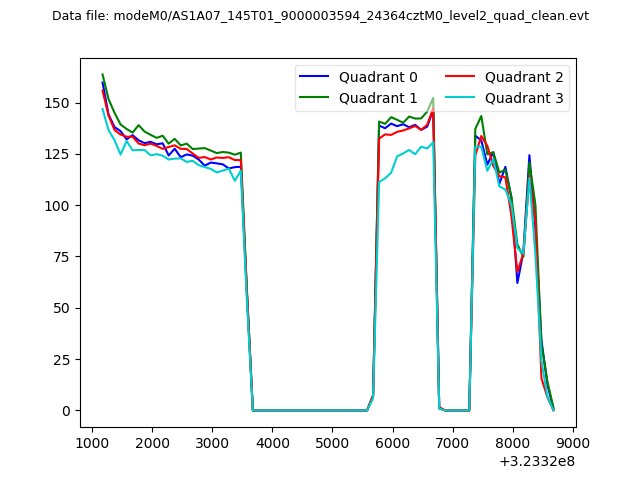 |
|
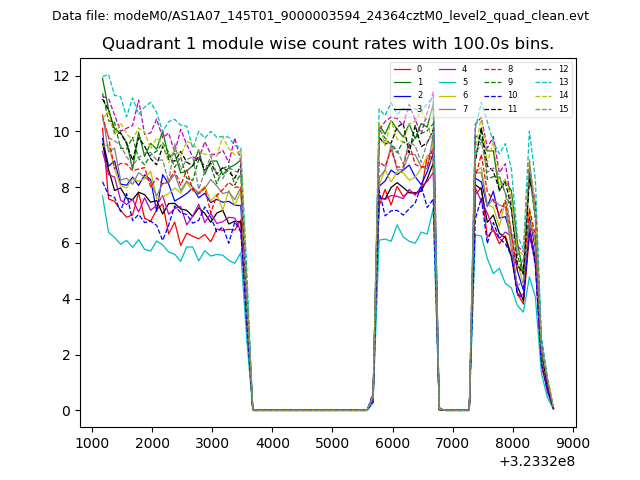
| Module-wise count rates for Quadrant A Data is divided into 100 sec bins |
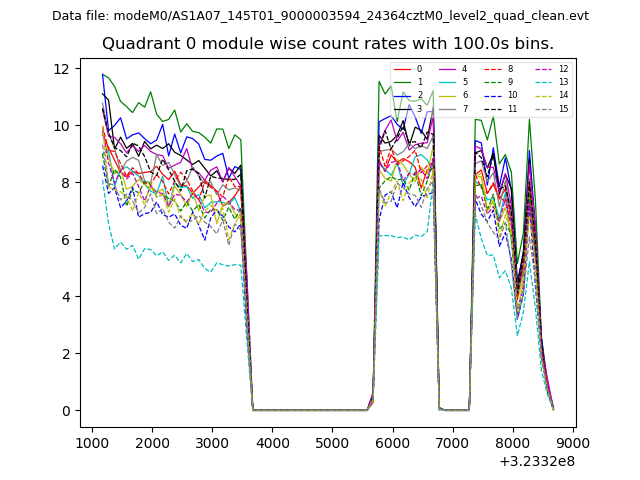 |
 |
| Module-wise count rates for Quadrant B Data is divided into 100 sec bins |
 |
 |
| Module-wise count rates for Quadrant C Data is divided into 100 sec bins |
 |
 |
| Module-wise count rates for Quadrant D Data is divided into 100 sec bins |
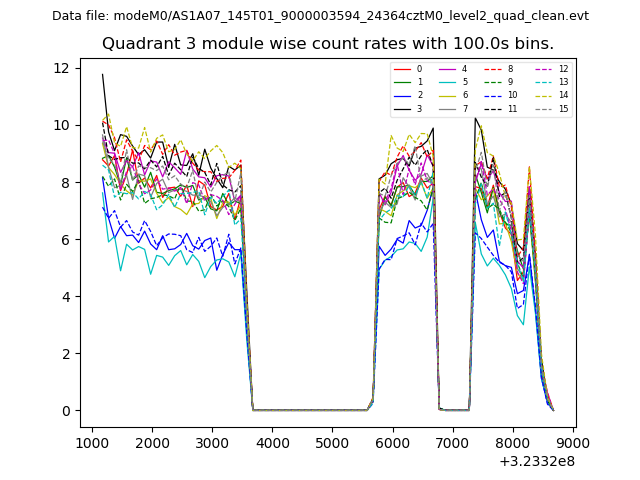 |
 |
| Parameter | Plot |
|---|---|
| CZT HV Monitor | 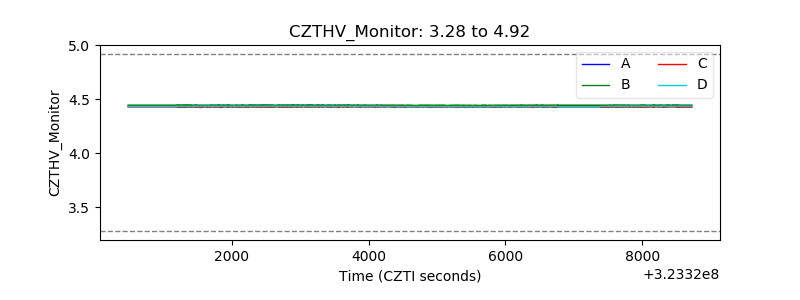 |
| D_VDD | 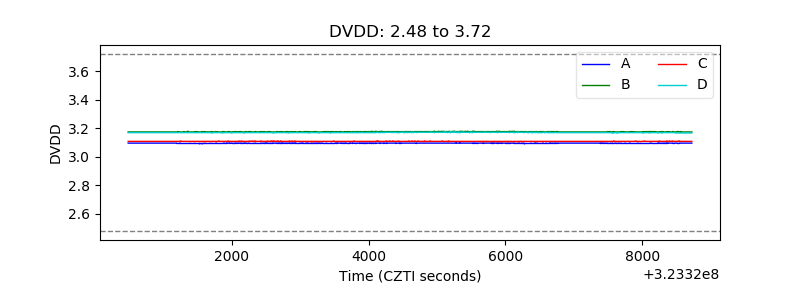 |
| Temperature 1 | 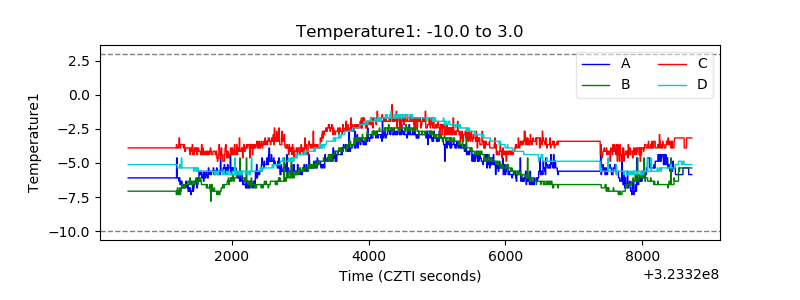 |
| Veto HV Monitor | 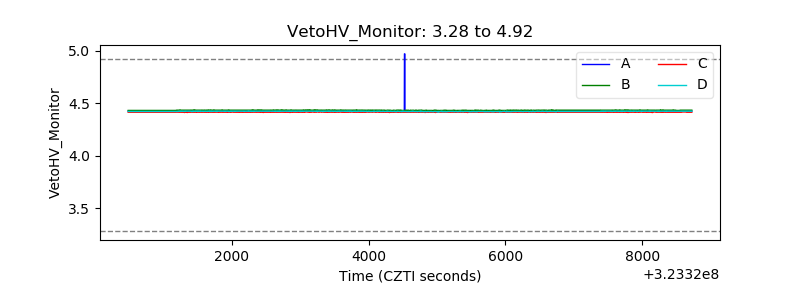 |
| Veto LLD | 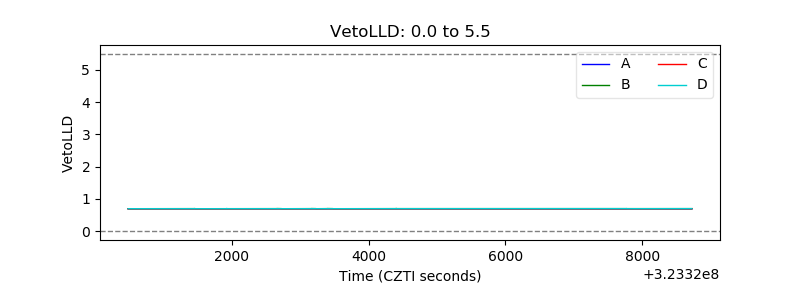 |
| Alpha Counter | 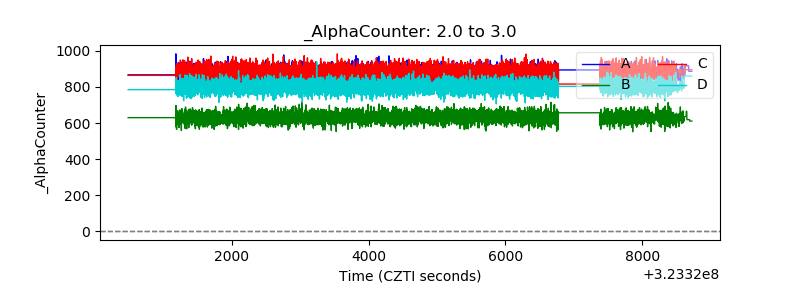 |
| _CPM_Rate | 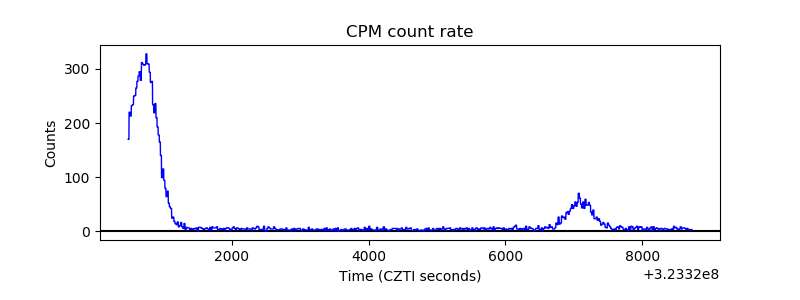 |
| CZT Counter | 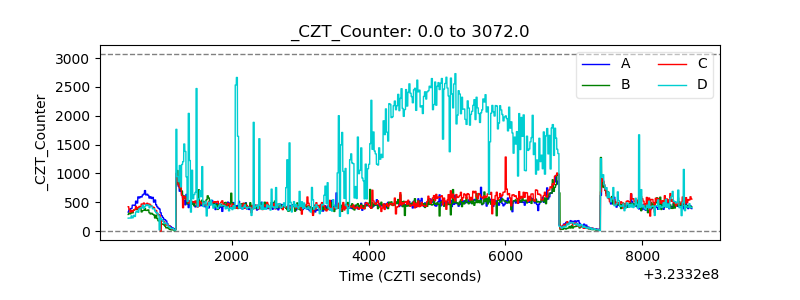 |
| +2.5 Volts monitor | 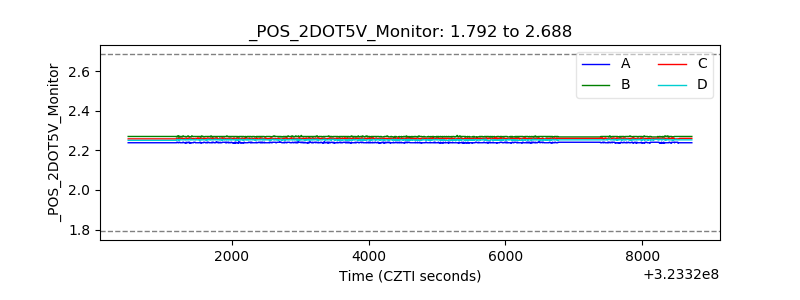 |
| +5 Volts monitor | 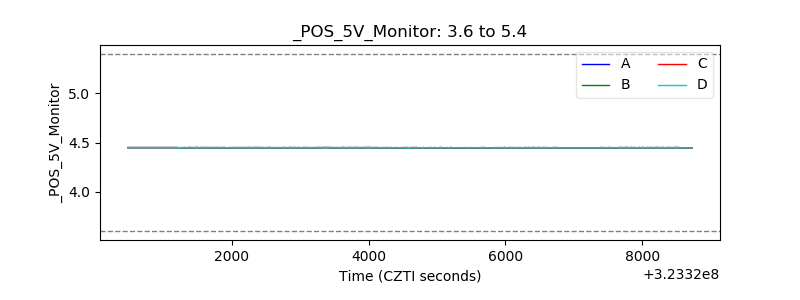 |
| _ROLL_ROT | 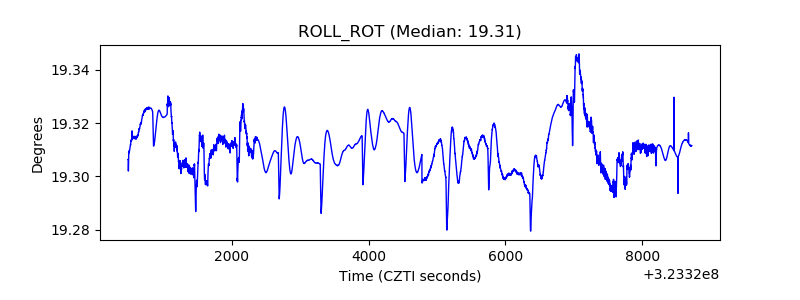 |
| _Roll_DEC | 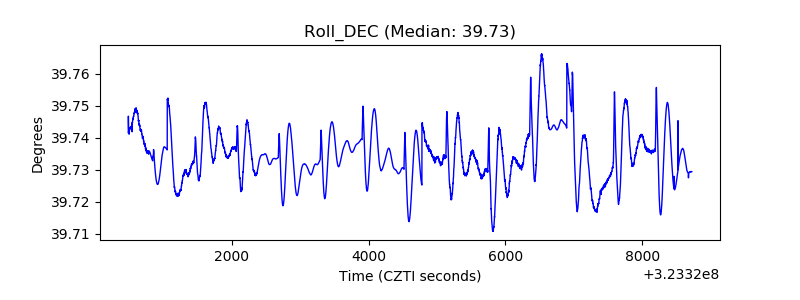 |
| _Roll_RA | 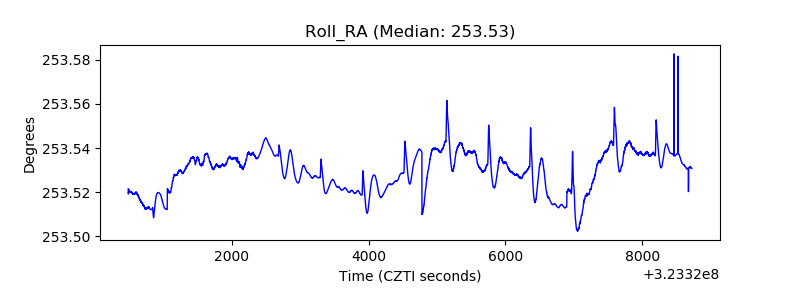 |
| Veto Counter | 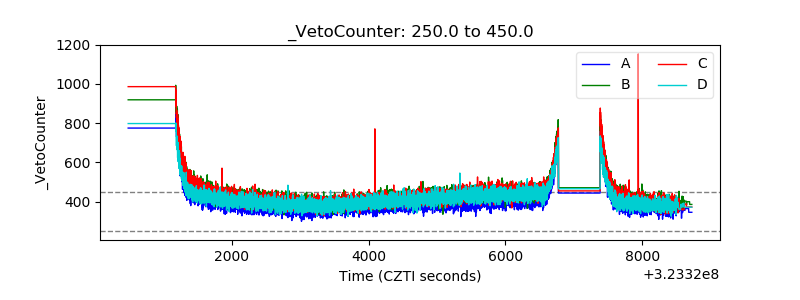 |