| Param | Original file | Final file |
|---|---|---|
| Filename | modeM0/AS1A07_145T01_9000003594_24365cztM0_level2.evt | modeM0/AS1A07_145T01_9000003594_24365cztM0_level2_quad_clean.evt |
| Size (bytes) | 371,727,360 | 56,056,320 |
| Size | 354.5 MB | 53.5 MB |
| Events in quadrant A | 2,136,402 | 348,075 |
| Events in quadrant B | 2,237,100 | 360,302 |
| Events in quadrant C | 2,450,064 | 342,853 |
| Events in quadrant D | 4,117,350 | 319,315 |
| Mode M0 | |||
|---|---|---|---|
| Quadrant | BADHDUFLAG | Total packets | Discarded packets |
| A | 0 | 13779 | 4279 |
| B | 0 | 14071 | 4362 |
| C | 0 | 15212 | 5330 |
| D | 0 | 23120 | 7787 |
| Mode M9 | |||
|---|---|---|---|
| Quadrant | BADHDUFLAG | Total packets | Discarded packets |
| A | 0 | 2 | 2 |
| B | 0 | 2 | 2 |
| C | 0 | 4 | 4 |
| D | 0 | 3 | 3 |
| Mode SS | |||
|---|---|---|---|
| Quadrant | BADHDUFLAG | Total packets | Discarded packets |
| A | 0 | 137 | 44 |
| B | 0 | 136 | 38 |
| C | 0 | 136 | 46 |
| D | 0 | 137 | 37 |
| Quadrant | Total seconds | Saturated seconds | Saturation percentage |
|---|---|---|---|
| A | 4716 | 12 | 0.254453% |
| B | 4722 | 17 | 0.360017% |
| C | 4686 | 30 | 0.640205% |
| D | 4420 | 383 | 8.665158% |
Noise dominated data is calculated using 1-second bins in cleaned event files. If a bin has >2000 counts, and if more than 50% of those come from <1% of pixels, then it is considered to be noise-dominated and hence unusable.
| Quadrant | # 1 sec bins | Bins with >0 counts | Bins with >2000 counts | High rate bins dominated by noise | Noise dominated (total time) | Noise dominated (detector-on time) | Marked lightcurve |
|---|---|---|---|---|---|---|---|
| A | 7109 | 5092 | 0 | 0 | 0.00% | 0.00% | 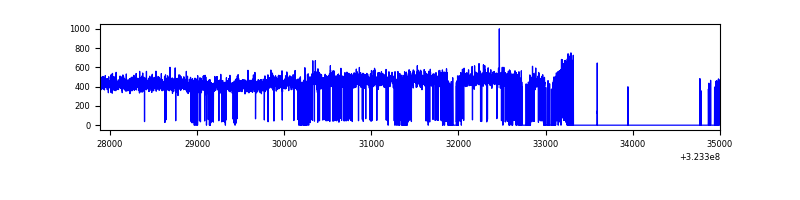 |
| B | 7116 | 5087 | 2 | 2 | 0.03% | 0.04% | 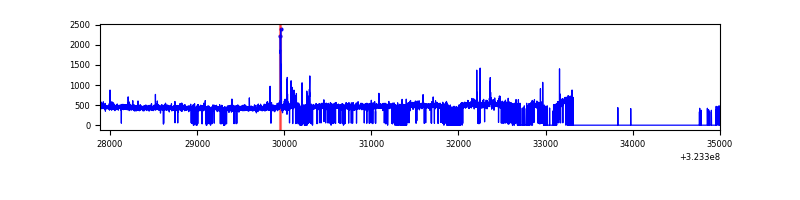 |
| C | 7110 | 5031 | 0 | 0 | 0.00% | 0.00% | 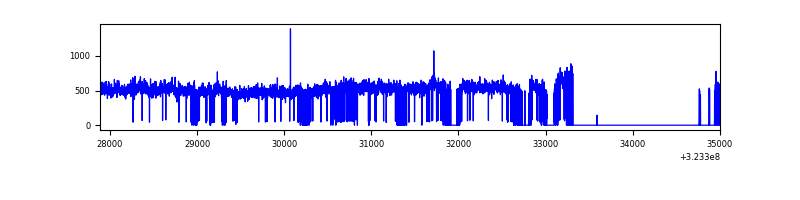 |
| D | 7109 | 4854 | 315 | 315 | 4.43% | 6.49% | 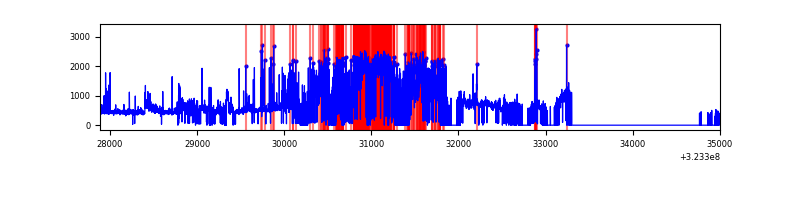 |
Top three noisy pixels from each quadrant. If the there are fewer than three noisy pixels in the level2.evt file, extra rows are filled as -1
| Pixel properties | Quadrant properties | ||||||
|---|---|---|---|---|---|---|---|
| Quadrant | DetID | PixID | Counts | Sigma | Mean | Median | Sigma |
| A | 13 | 254 | 7494 | 61.76 | 553 | 541 | 112.6 |
| A | 3 | 137 | 5176 | 41.17 | 553 | 541 | 112.6 |
| A | 0 | 226 | 4657 | 36.56 | 553 | 541 | 112.6 |
| B | 5 | 172 | 36818 | 335.91 | 556 | 541 | 108.0 |
| B | 0 | 190 | 13611 | 121.02 | 556 | 541 | 108.0 |
| B | 12 | 111 | 13055 | 115.87 | 556 | 541 | 108.0 |
| C | 7 | 247 | 295900 | 2343.18 | 530 | 532 | 126.1 |
| C | 14 | 238 | 84917 | 669.43 | 530 | 532 | 126.1 |
| C | 2 | 16 | 4553 | 31.9 | 530 | 532 | 126.1 |
| D | 9 | 35 | 1209795 | 9975.72 | 496 | 481 | 121.2 |
| D | 7 | 238 | 702190 | 5788.45 | 496 | 481 | 121.2 |
| D | 8 | 195 | 148628 | 1222.08 | 496 | 481 | 121.2 |
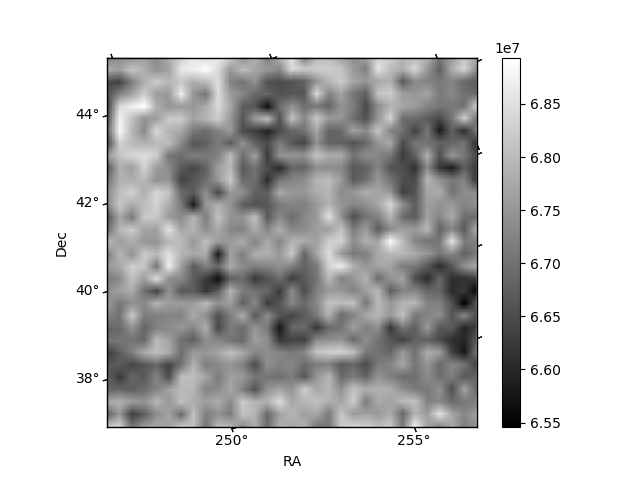
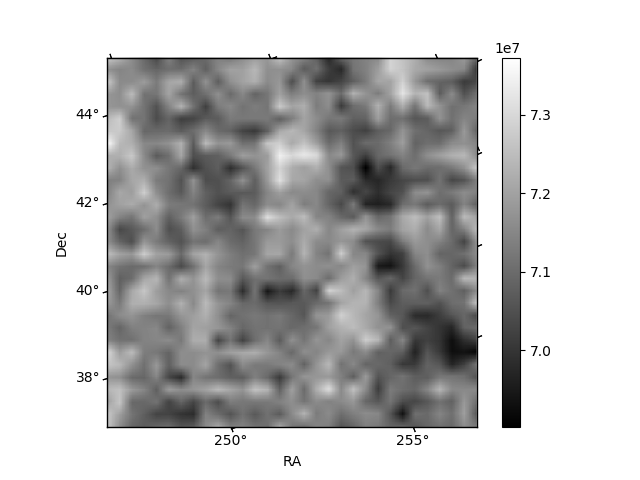
Histogram calculated using DETX and DETY for each event in the final _common_clean file
| Quadrant A | 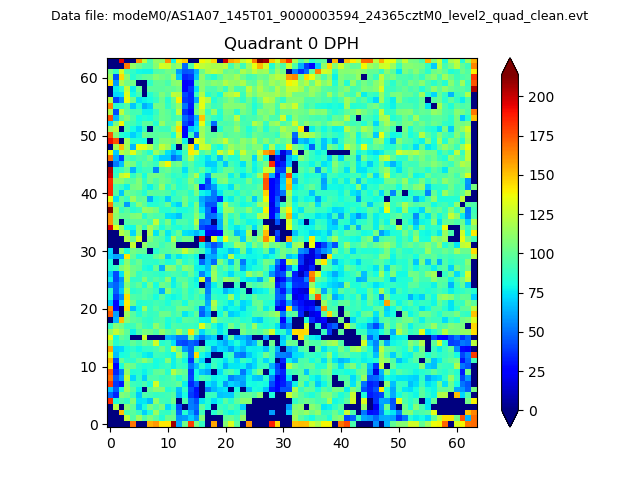 |
 |
Quadrant B |
|---|---|---|---|
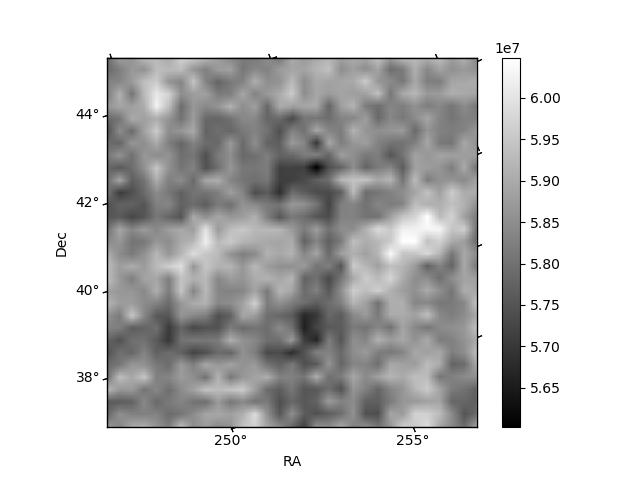
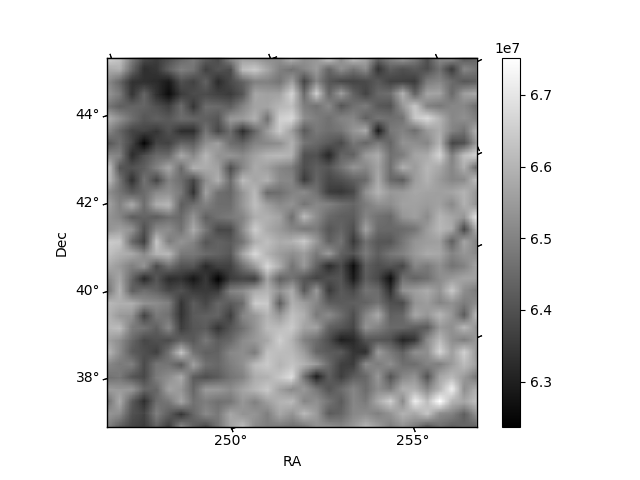
| Quadrant D |  |
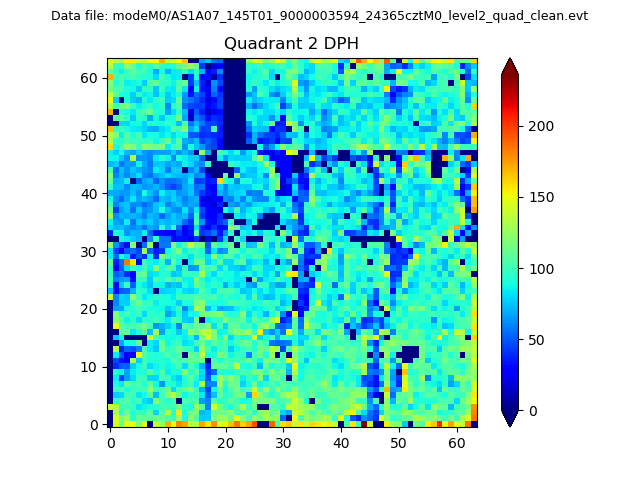 |
Quadrant C |
| Plot type | Count rate plots | Images |
|---|---|---|
| Comparison with Poisson distribution Blue bars denote a histogram of data divided into 1 sec bins. Red curve is a Poisson curve with rate = median count rate of data. |
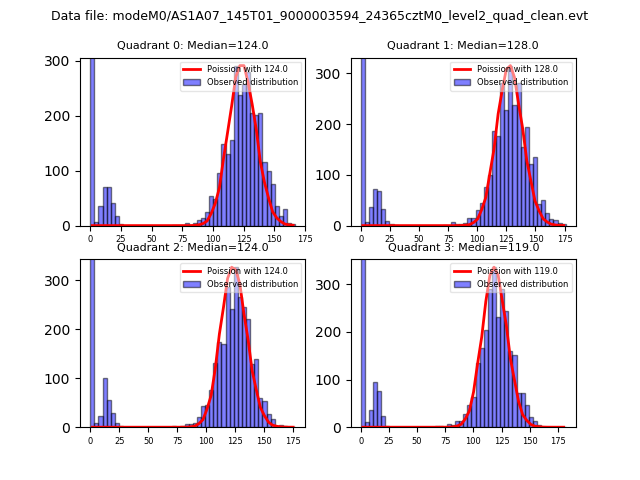 |
 |
| Quadrant-wise count rates Data is divided into 100 sec bins |
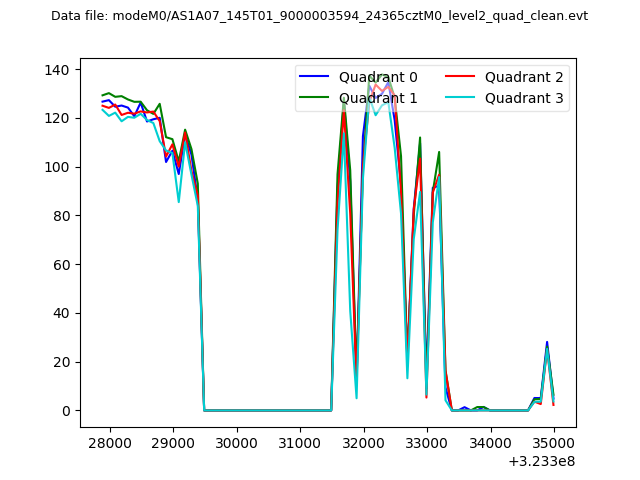 |
|
| Module-wise count rates for Quadrant A Data is divided into 100 sec bins |
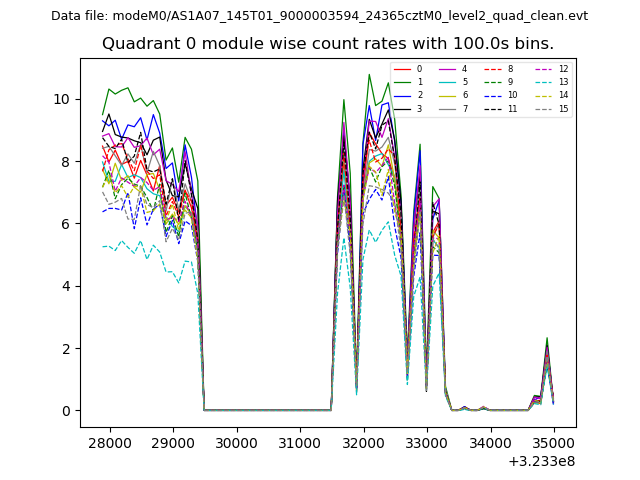 |
 |
| Module-wise count rates for Quadrant B Data is divided into 100 sec bins |
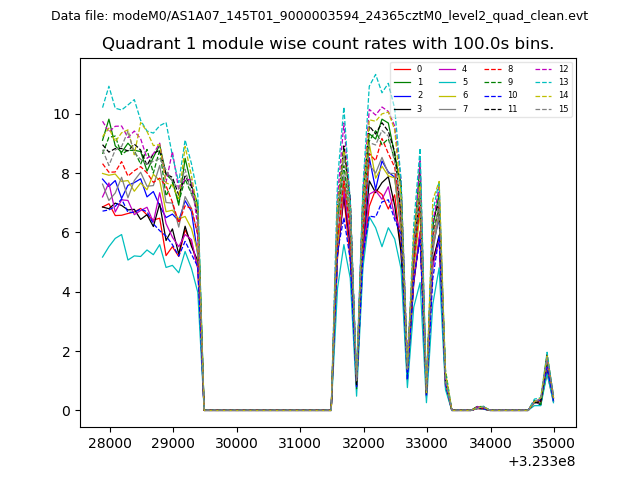 |
 |
| Module-wise count rates for Quadrant C Data is divided into 100 sec bins |
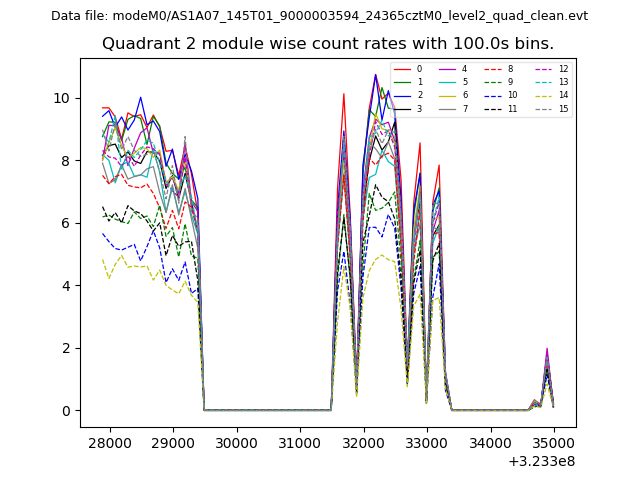 |
 |
| Module-wise count rates for Quadrant D Data is divided into 100 sec bins |
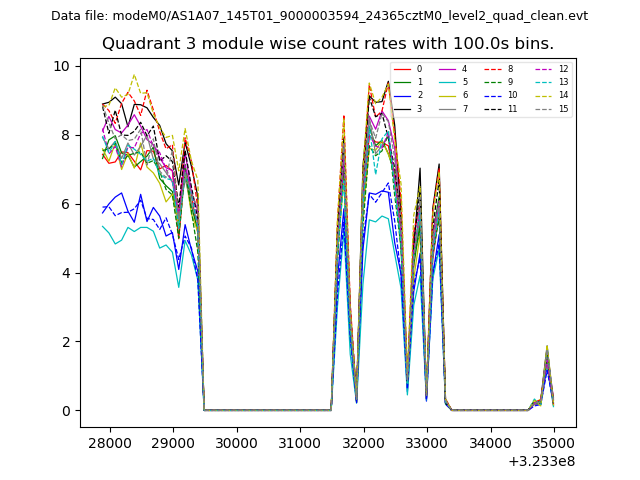 |
 |
| Parameter | Plot |
|---|---|
| CZT HV Monitor | 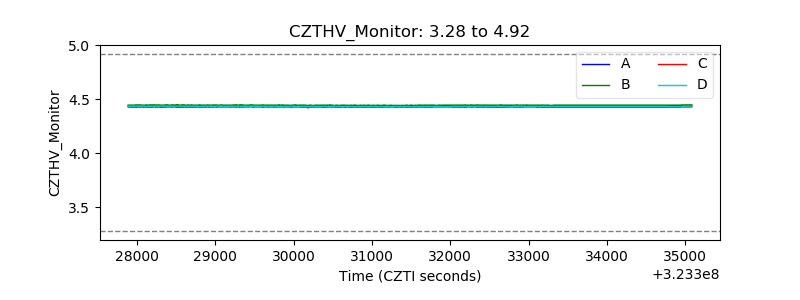 |
| D_VDD | 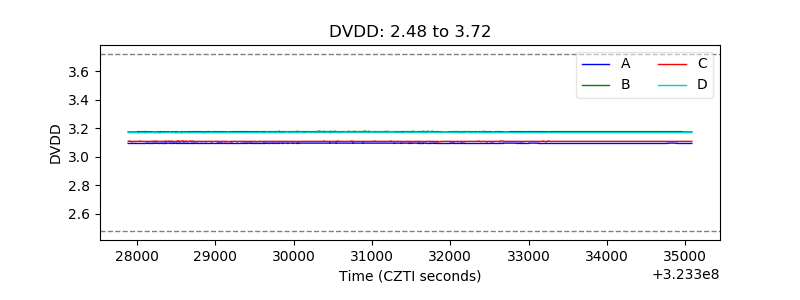 |
| Temperature 1 | 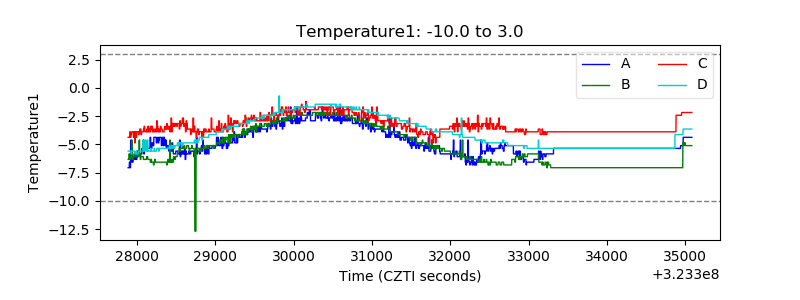 |
| Veto HV Monitor |  |
| Veto LLD | 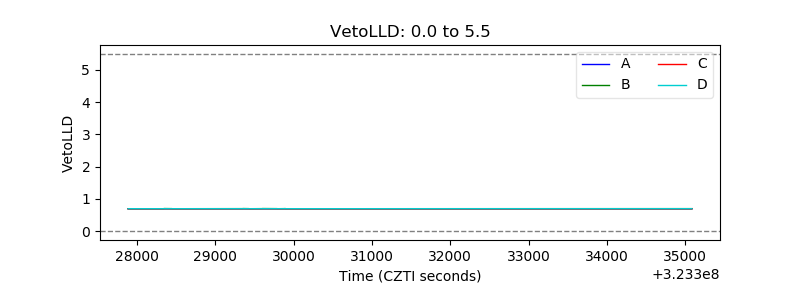 |
| Alpha Counter | 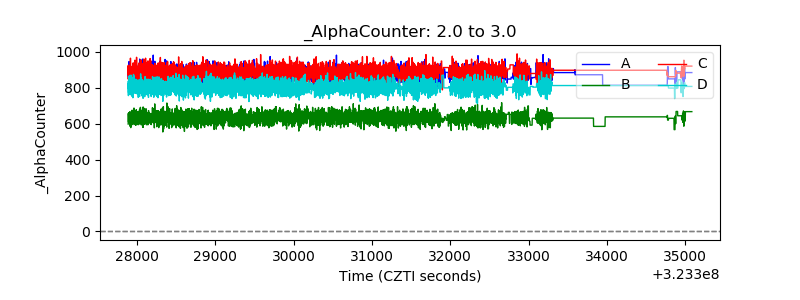 |
| _CPM_Rate | 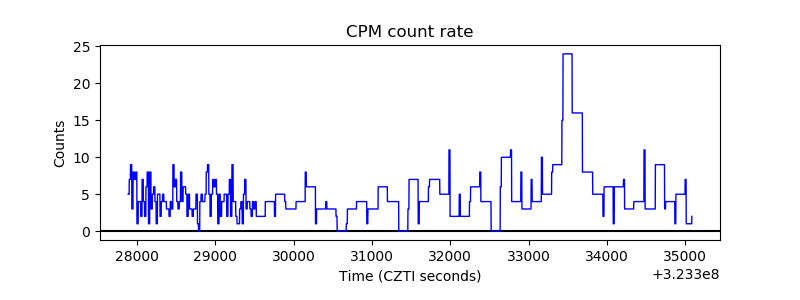 |
| CZT Counter |  |
| +2.5 Volts monitor |  |
| +5 Volts monitor |  |
| _ROLL_ROT |  |
| _Roll_DEC |  |
| _Roll_RA |  |
| Veto Counter | 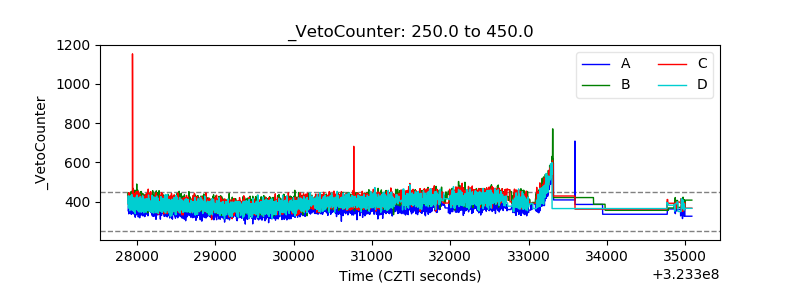 |