| Param | Original file | Final file |
|---|---|---|
| Filename | modeM0/AS1A07_145T01_9000003594_24366cztM0_level2.evt | modeM0/AS1A07_145T01_9000003594_24366cztM0_level2_quad_clean.evt |
| Size (bytes) | 586,353,600 | 87,436,800 |
| Size | 559.2 MB | 83.4 MB |
| Events in quadrant A | 3,133,494 | 544,412 |
| Events in quadrant B | 3,211,177 | 563,931 |
| Events in quadrant C | 5,032,668 | 543,592 |
| Events in quadrant D | 5,921,363 | 523,501 |
| Mode M0 | |||
|---|---|---|---|
| Quadrant | BADHDUFLAG | Total packets | Discarded packets |
| A | 0 | 13834 | 1 |
| B | 0 | 13947 | 1 |
| C | 0 | 19307 | 1 |
| D | 0 | 22263 | 1 |
| Mode M9 | |||
|---|---|---|---|
| Quadrant | BADHDUFLAG | Total packets | Discarded packets |
| A | 0 | 2 | 0 |
| B | 0 | 2 | 0 |
| C | 0 | 2 | 0 |
| D | 0 | 2 | 0 |
| Mode SS | |||
|---|---|---|---|
| Quadrant | BADHDUFLAG | Total packets | Discarded packets |
| A | 0 | 138 | 0 |
| B | 0 | 138 | 0 |
| C | 0 | 138 | 0 |
| D | 0 | 138 | 0 |
| Quadrant | Total seconds | Saturated seconds | Saturation percentage |
|---|---|---|---|
| A | 6771 | 116 | 1.713189% |
| B | 6772 | 144 | 2.126403% |
| C | 6772 | 557 | 8.225044% |
| D | 6771 | 523 | 7.724118% |
Noise dominated data is calculated using 1-second bins in cleaned event files. If a bin has >2000 counts, and if more than 50% of those come from <1% of pixels, then it is considered to be noise-dominated and hence unusable.
| Quadrant | # 1 sec bins | Bins with >0 counts | Bins with >2000 counts | High rate bins dominated by noise | Noise dominated (total time) | Noise dominated (detector-on time) | Marked lightcurve |
|---|---|---|---|---|---|---|---|
| A | 6996 | 6772 | 0 | 0 | 0.00% | 0.00% | 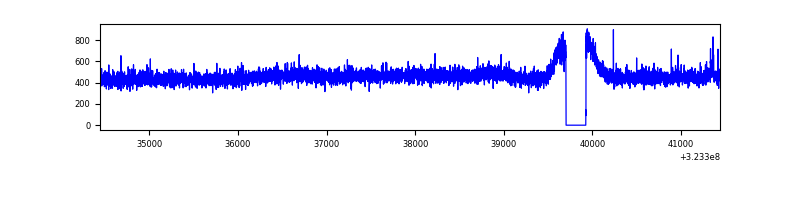 |
| B | 6997 | 6773 | 2 | 2 | 0.03% | 0.03% | 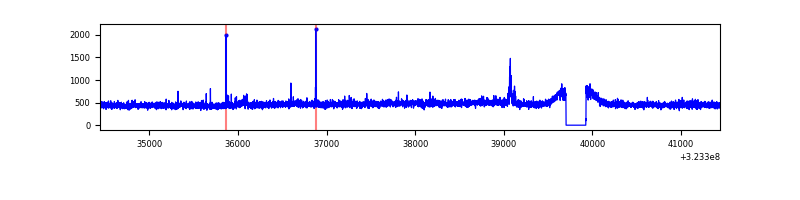 |
| C | 6997 | 6773 | 334 | 334 | 4.77% | 4.93% | 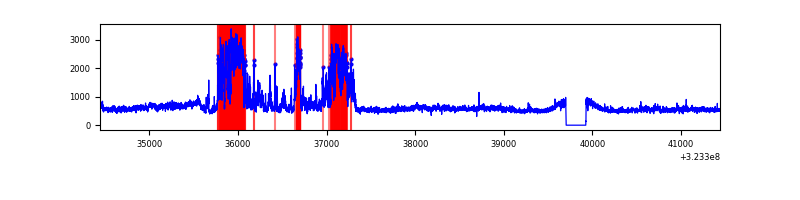 |
| D | 6996 | 6772 | 397 | 397 | 5.67% | 5.86% | 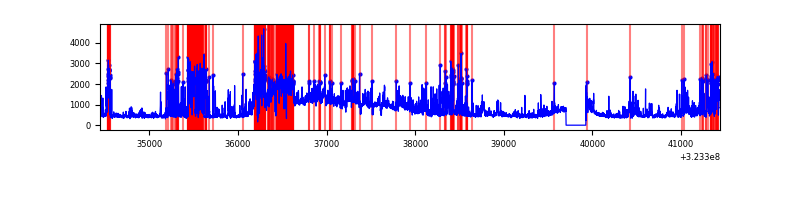 |
Top three noisy pixels from each quadrant. If the there are fewer than three noisy pixels in the level2.evt file, extra rows are filled as -1
| Pixel properties | Quadrant properties | ||||||
|---|---|---|---|---|---|---|---|
| Quadrant | DetID | PixID | Counts | Sigma | Mean | Median | Sigma |
| A | 13 | 254 | 9520 | 53.28 | 810 | 792 | 163.8 |
| A | 3 | 137 | 7777 | 42.64 | 810 | 792 | 163.8 |
| A | 0 | 226 | 6845 | 36.95 | 810 | 792 | 163.8 |
| B | 0 | 230 | 28097 | 174.59 | 808 | 786 | 156.4 |
| B | 12 | 111 | 19649 | 120.58 | 808 | 786 | 156.4 |
| B | 11 | 111 | 17378 | 106.07 | 808 | 786 | 156.4 |
| C | 7 | 247 | 1937657 | 10854.11 | 760 | 765 | 178.4 |
| C | 14 | 238 | 119994 | 668.14 | 760 | 765 | 178.4 |
| C | 3 | 233 | 6429 | 31.74 | 760 | 765 | 178.4 |
| D | 9 | 35 | 1236063 | 6569.22 | 770 | 746 | 188.0 |
| D | 7 | 238 | 869043 | 4617.47 | 770 | 746 | 188.0 |
| D | 12 | 233 | 437143 | 2320.69 | 770 | 746 | 188.0 |
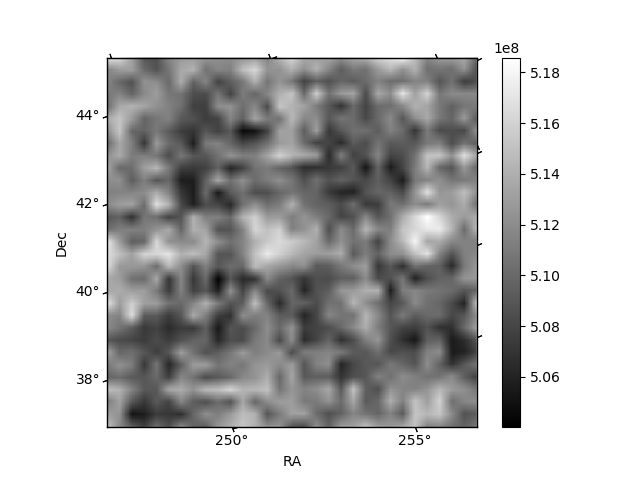
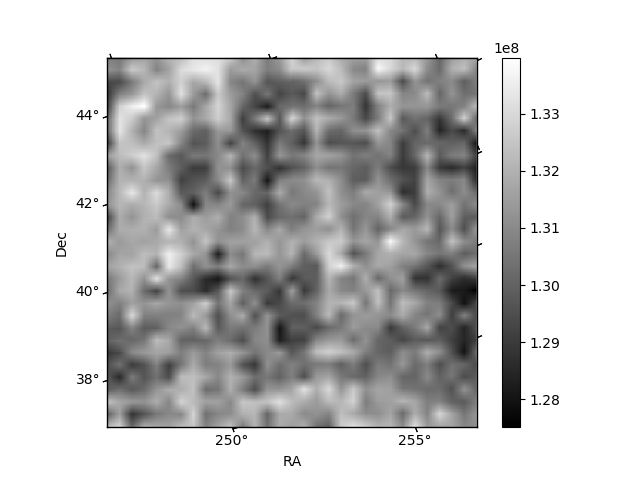
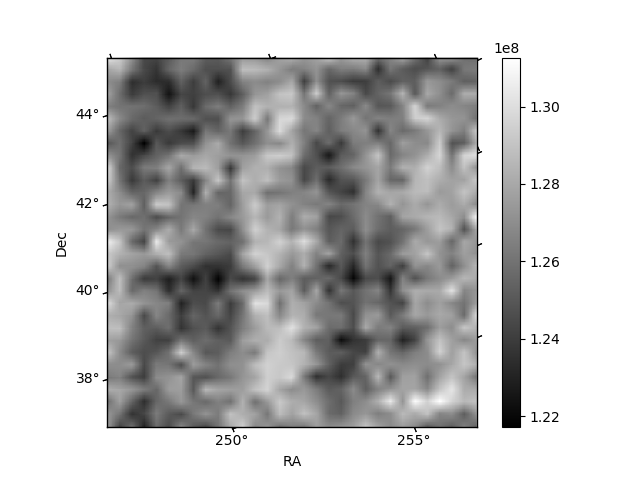
Histogram calculated using DETX and DETY for each event in the final _common_clean file
| Quadrant A | 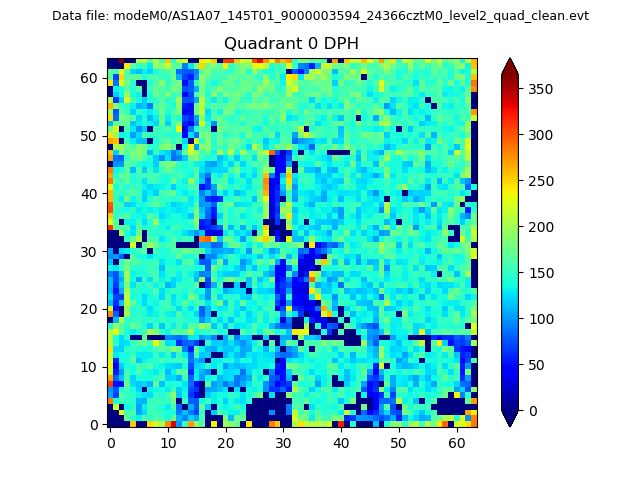 |
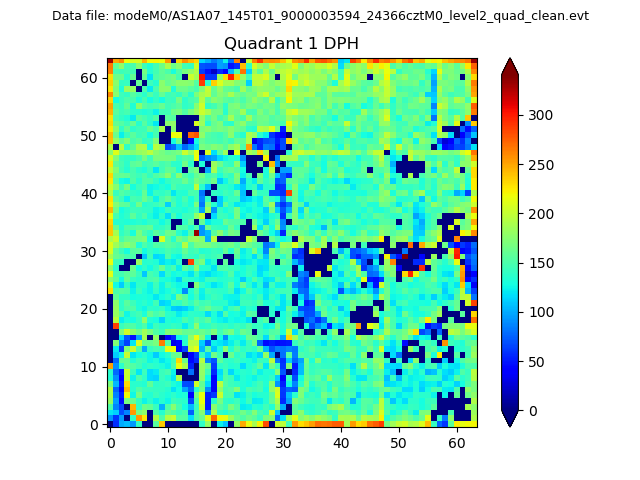 |
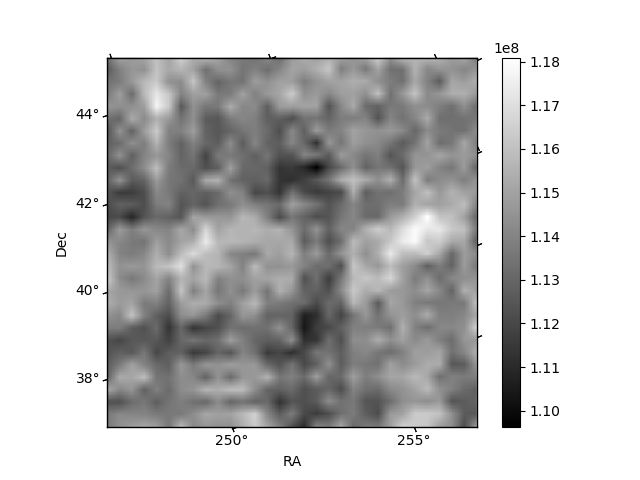
Quadrant B |
|---|---|---|---|
| Quadrant D | 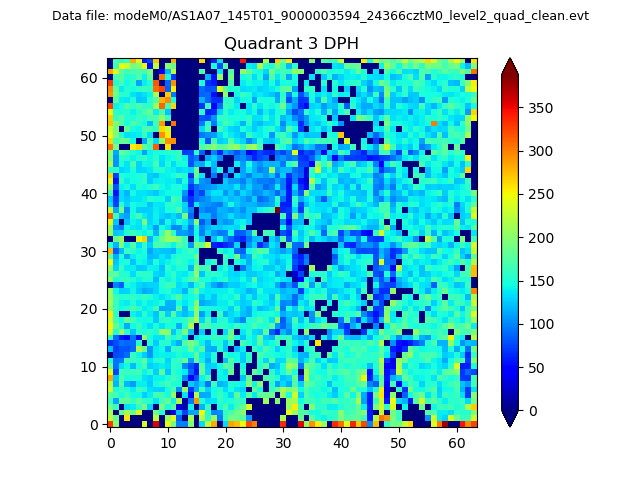 |
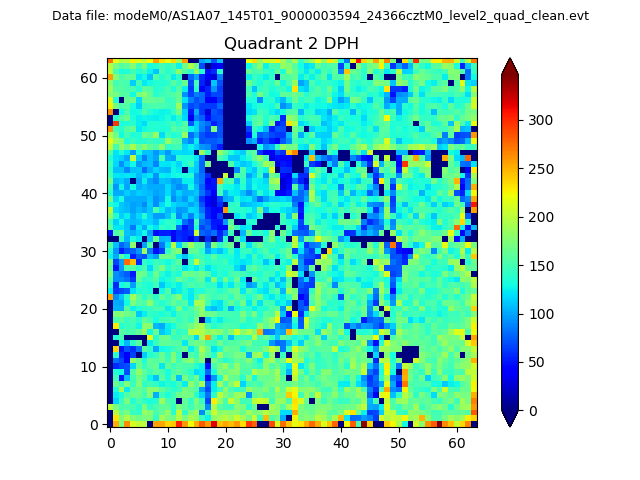 |
Quadrant C |
| Plot type | Count rate plots | Images |
|---|---|---|
| Comparison with Poisson distribution Blue bars denote a histogram of data divided into 1 sec bins. Red curve is a Poisson curve with rate = median count rate of data. |
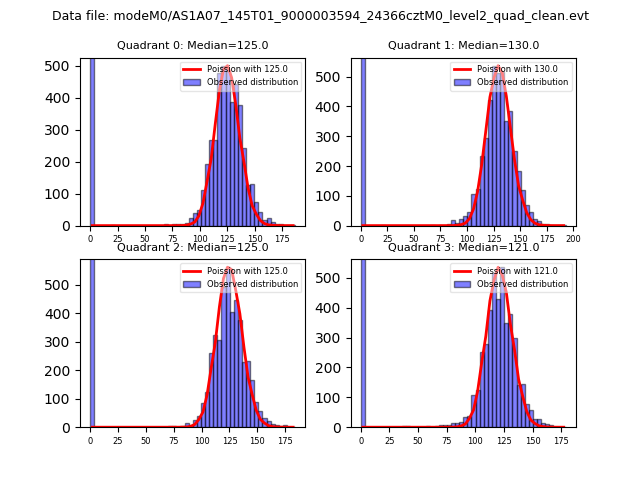 |
 |
| Quadrant-wise count rates Data is divided into 100 sec bins |
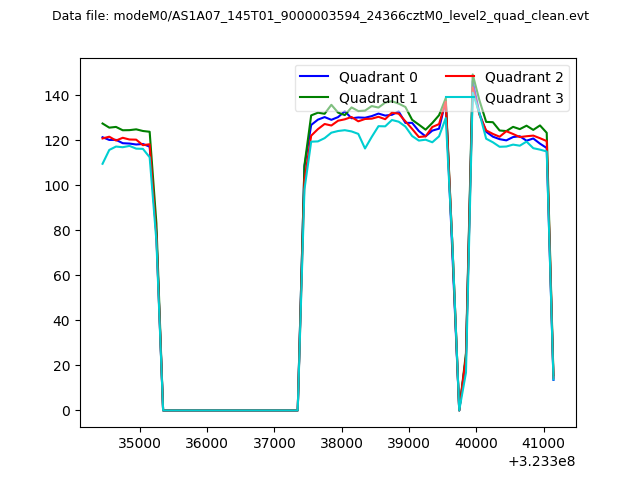 |
|
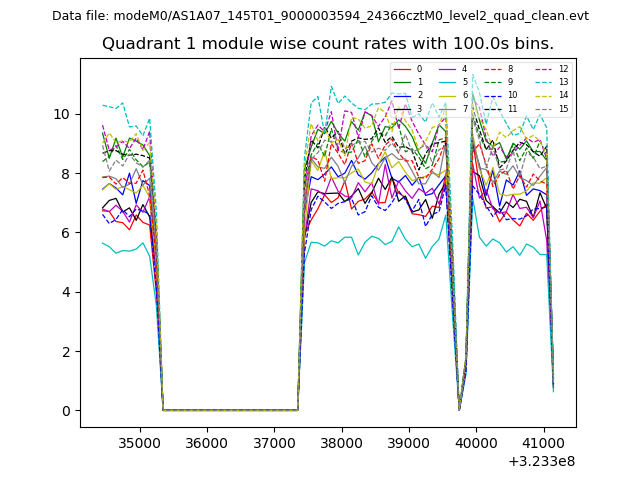
| Module-wise count rates for Quadrant A Data is divided into 100 sec bins |
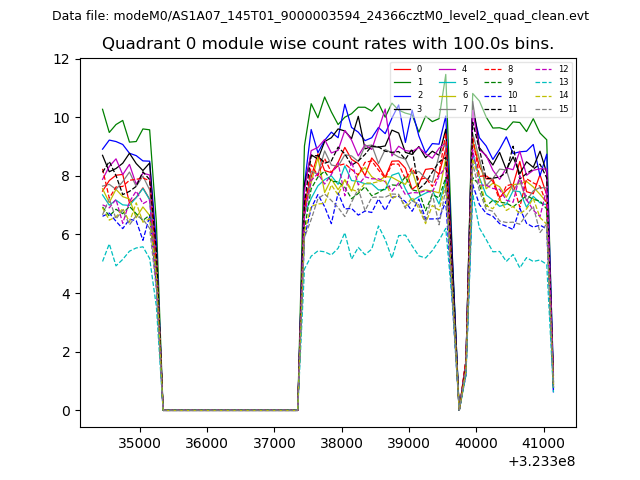 |
 |
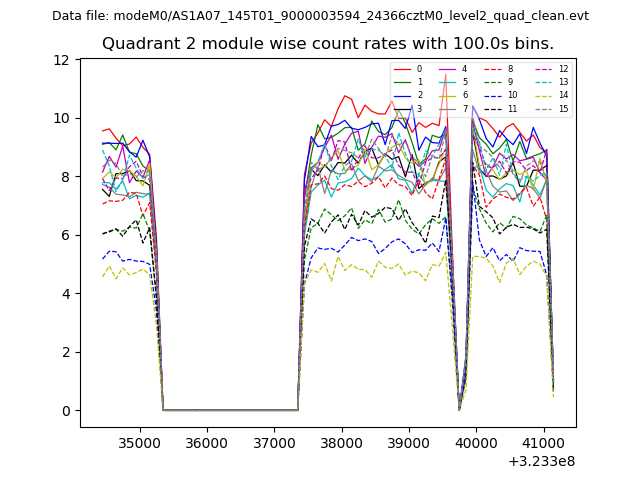
| Module-wise count rates for Quadrant B Data is divided into 100 sec bins |
 |
 |
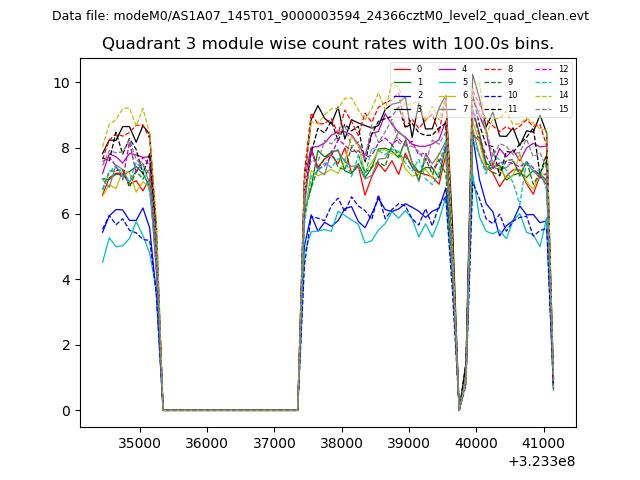
| Module-wise count rates for Quadrant C Data is divided into 100 sec bins |
 |
 |
| Module-wise count rates for Quadrant D Data is divided into 100 sec bins |
 |
 |
| Parameter | Plot |
|---|---|
| CZT HV Monitor | 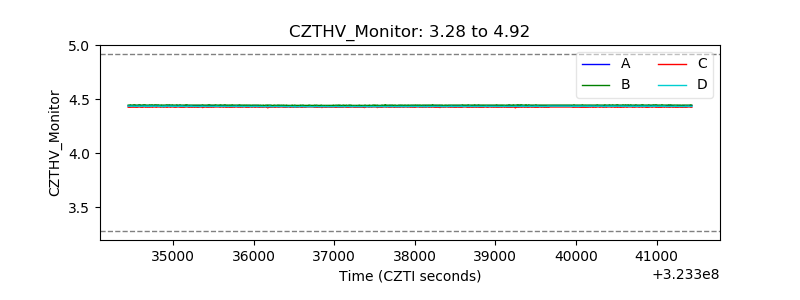 |
| D_VDD | 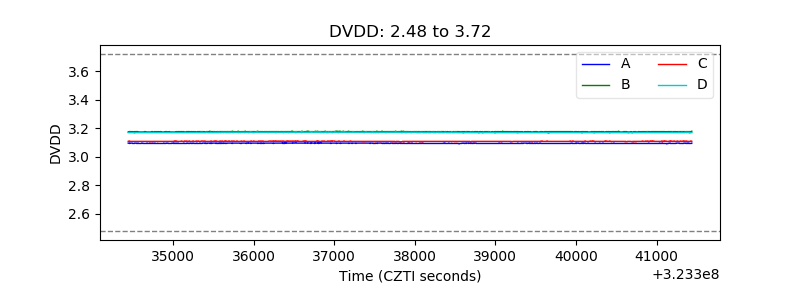 |
| Temperature 1 | 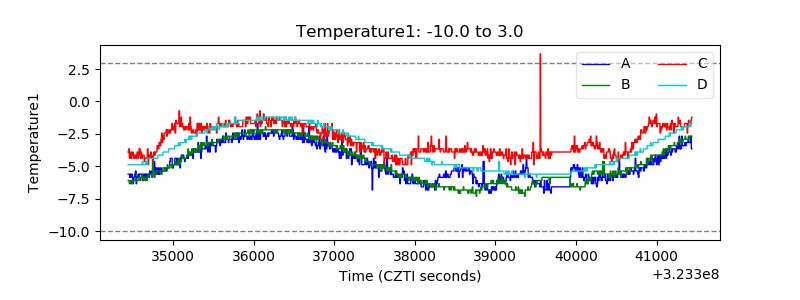 |
| Veto HV Monitor | 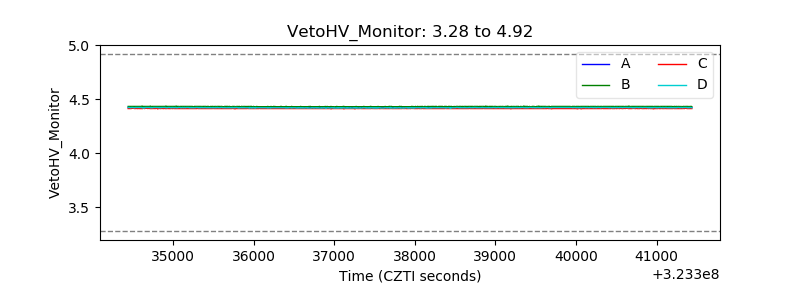 |
| Veto LLD | 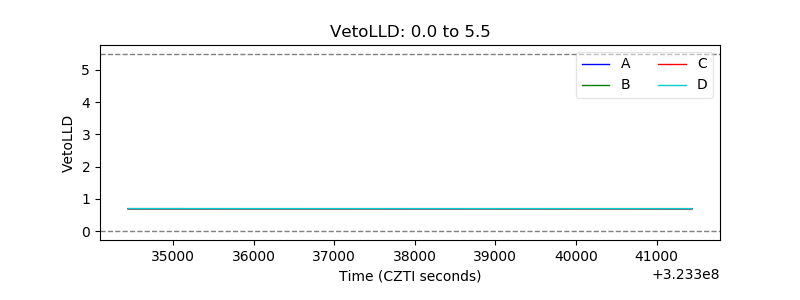 |
| Alpha Counter | 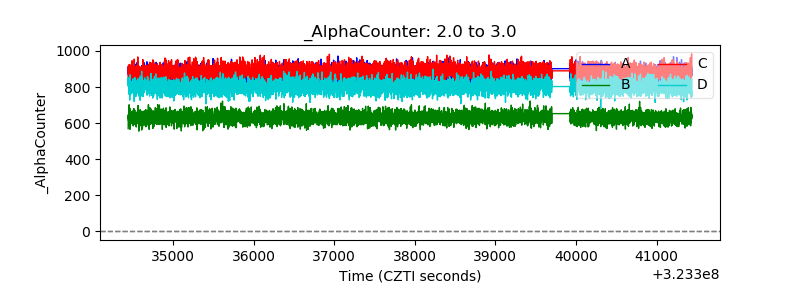 |
| _CPM_Rate | 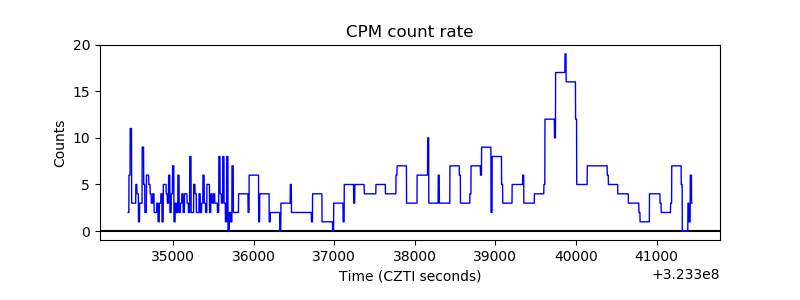 |
| CZT Counter | 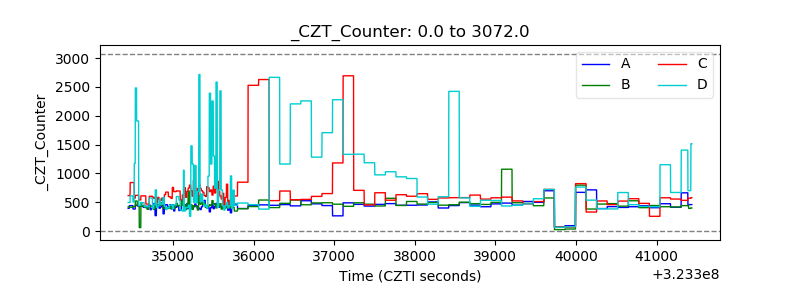 |
| +2.5 Volts monitor | 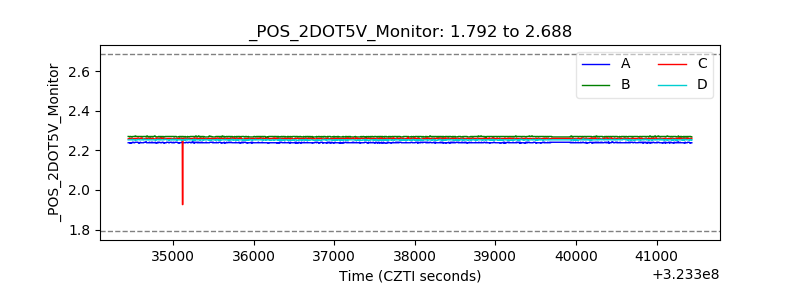 |
| +5 Volts monitor | 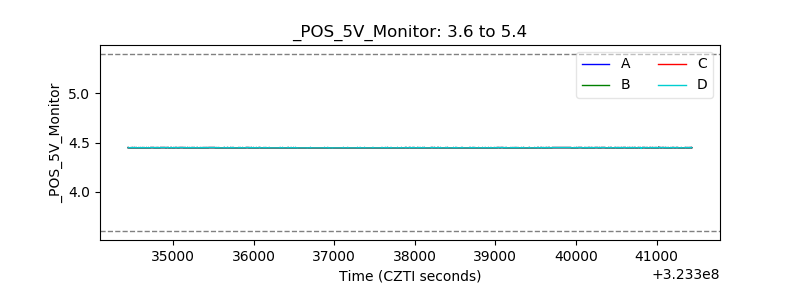 |
| _ROLL_ROT | 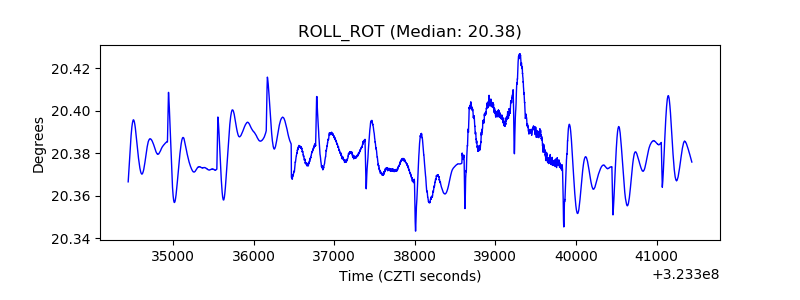 |
| _Roll_DEC | 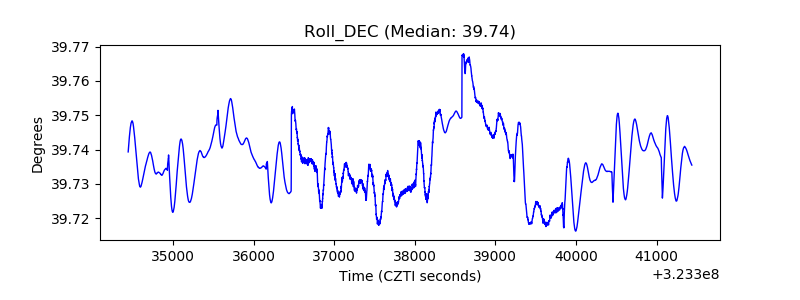 |
| _Roll_RA | 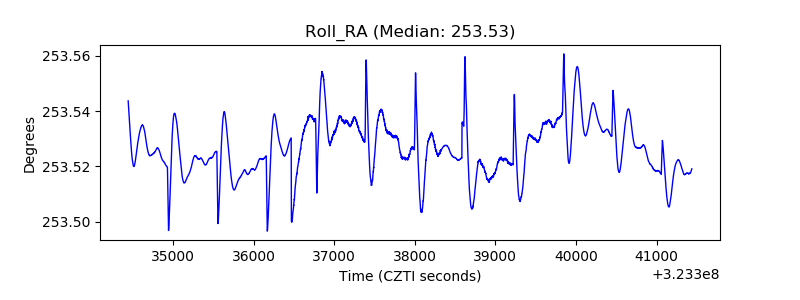 |
| Veto Counter | 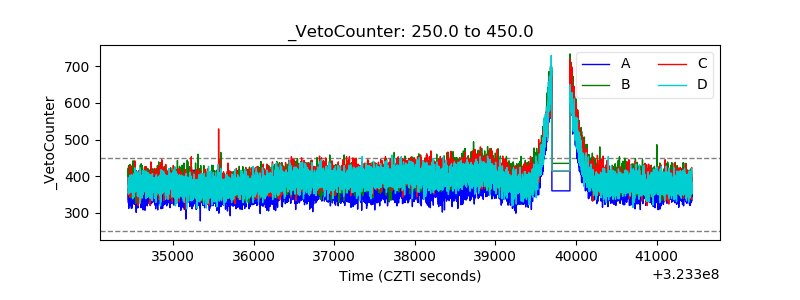 |