| Param | Original file | Final file |
|---|---|---|
| Filename | modeM0/AS1A07_145T01_9000003594_24369cztM0_level2.evt | modeM0/AS1A07_145T01_9000003594_24369cztM0_level2_quad_clean.evt |
| Size (bytes) | 1,658,491,200 | 216,267,840 |
| Size | 1.5 GB | 206.2 MB |
| Events in quadrant A | 8,633,307 | 1,335,548 |
| Events in quadrant B | 8,887,072 | 1,367,939 |
| Events in quadrant C | 10,628,406 | 1,313,369 |
| Events in quadrant D | 20,828,869 | 1,256,367 |
| Mode M0 | |||
|---|---|---|---|
| Quadrant | BADHDUFLAG | Total packets | Discarded packets |
| A | 0 | 37684 | 3 |
| B | 0 | 38111 | 3 |
| C | 0 | 43364 | 3 |
| D | 0 | 74326 | 3 |
| Mode M9 | |||
|---|---|---|---|
| Quadrant | BADHDUFLAG | Total packets | Discarded packets |
| A | 0 | 18 | 0 |
| B | 0 | 18 | 0 |
| C | 0 | 18 | 0 |
| D | 0 | 18 | 0 |
| Mode SS | |||
|---|---|---|---|
| Quadrant | BADHDUFLAG | Total packets | Discarded packets |
| A | 0 | 374 | 0 |
| B | 0 | 374 | 0 |
| C | 0 | 374 | 0 |
| D | 0 | 374 | 0 |
| Quadrant | Total seconds | Saturated seconds | Saturation percentage |
|---|---|---|---|
| A | 18529 | 202 | 1.090183% |
| B | 18528 | 232 | 1.252159% |
| C | 18528 | 312 | 1.683938% |
| D | 18529 | 4910 | 26.499002% |
Noise dominated data is calculated using 1-second bins in cleaned event files. If a bin has >2000 counts, and if more than 50% of those come from <1% of pixels, then it is considered to be noise-dominated and hence unusable.
| Quadrant | # 1 sec bins | Bins with >0 counts | Bins with >2000 counts | High rate bins dominated by noise | Noise dominated (total time) | Noise dominated (detector-on time) | Marked lightcurve |
|---|---|---|---|---|---|---|---|
| A | 20259 | 18532 | 0 | 0 | 0.00% | 0.00% | 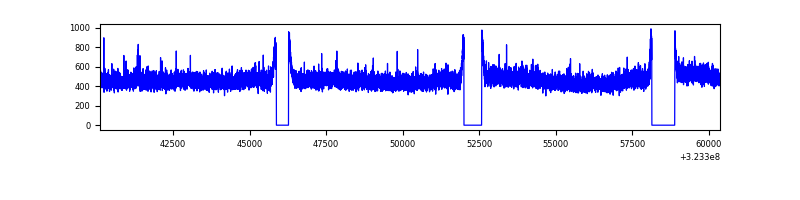 |
| B | 20258 | 18531 | 11 | 11 | 0.05% | 0.06% | 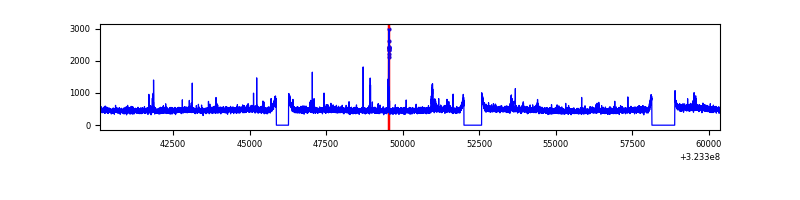 |
| C | 20258 | 18531 | 0 | 0 | 0.00% | 0.00% | 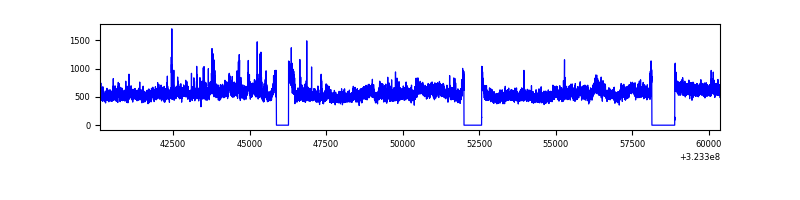 |
| D | 20259 | 18532 | 4441 | 4441 | 21.92% | 23.96% | 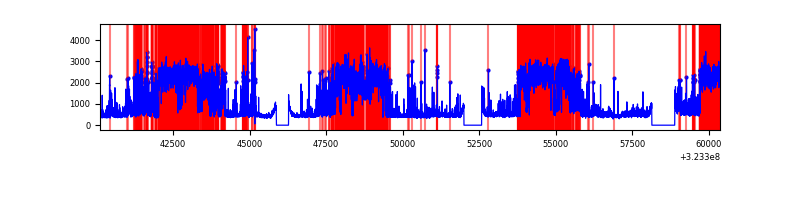 |
Top three noisy pixels from each quadrant. If the there are fewer than three noisy pixels in the level2.evt file, extra rows are filled as -1
| Pixel properties | Quadrant properties | ||||||
|---|---|---|---|---|---|---|---|
| Quadrant | DetID | PixID | Counts | Sigma | Mean | Median | Sigma |
| A | 13 | 254 | 26190 | 53.39 | 2237 | 2187 | 449.6 |
| A | 3 | 137 | 21041 | 41.93 | 2237 | 2187 | 449.6 |
| A | 0 | 226 | 19073 | 37.56 | 2237 | 2187 | 449.6 |
| B | 0 | 230 | 60434 | 135.65 | 2231 | 2174 | 429.5 |
| B | 0 | 190 | 54415 | 121.64 | 2231 | 2174 | 429.5 |
| B | 12 | 111 | 53540 | 119.6 | 2231 | 2174 | 429.5 |
| C | 7 | 247 | 1858333 | 3722.07 | 2145 | 2159 | 498.7 |
| C | 14 | 238 | 342339 | 682.14 | 2145 | 2159 | 498.7 |
| C | 2 | 16 | 54971 | 105.9 | 2145 | 2159 | 498.7 |
| D | 9 | 35 | 9734800 | 19866.52 | 1990 | 1922 | 489.9 |
| D | 7 | 238 | 1100368 | 2242.12 | 1990 | 1922 | 489.9 |
| D | 8 | 195 | 952108 | 1939.5 | 1990 | 1922 | 489.9 |
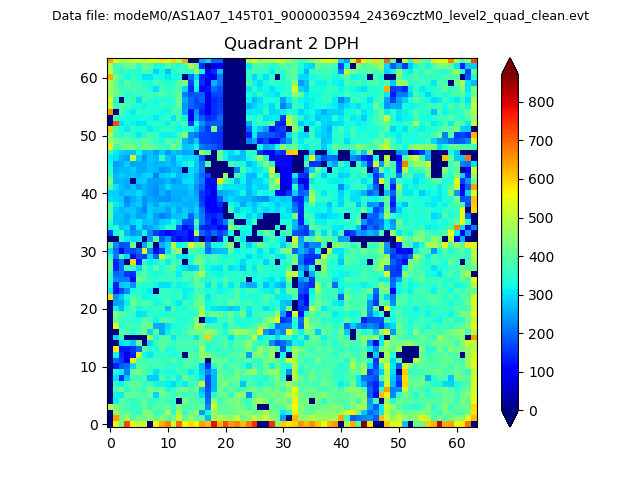
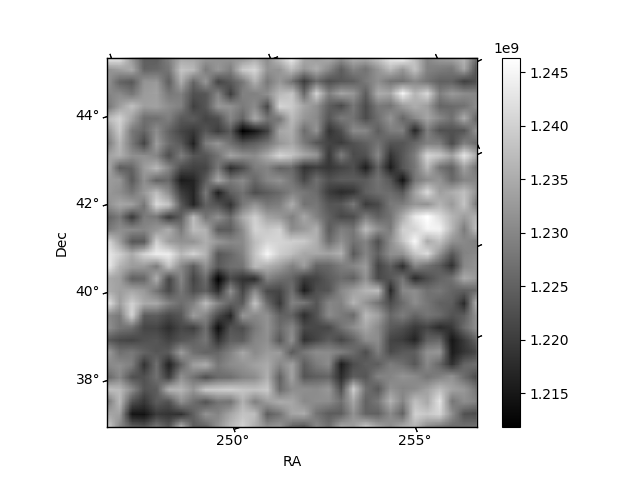
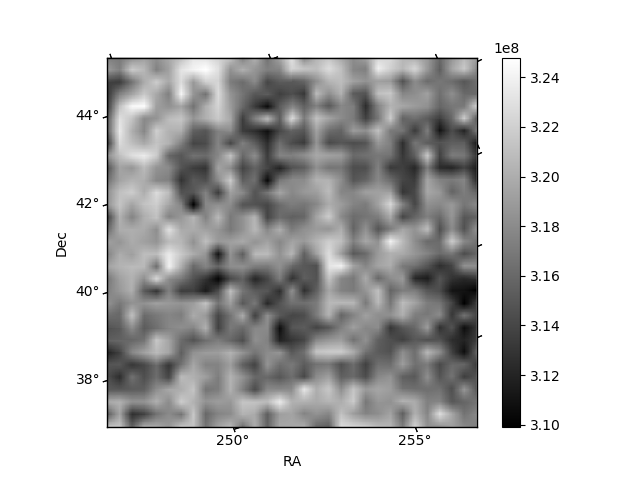
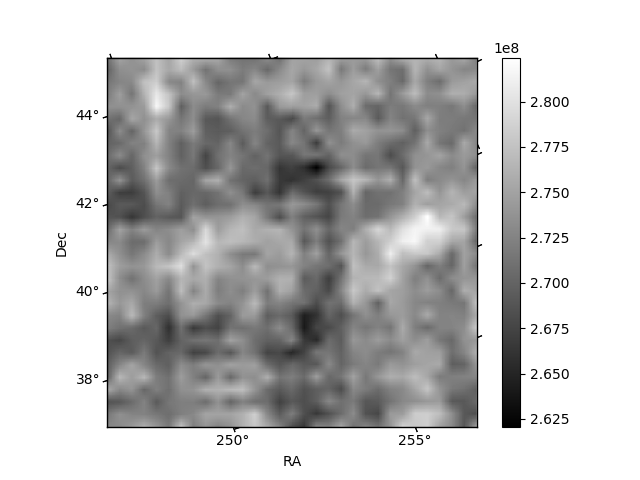
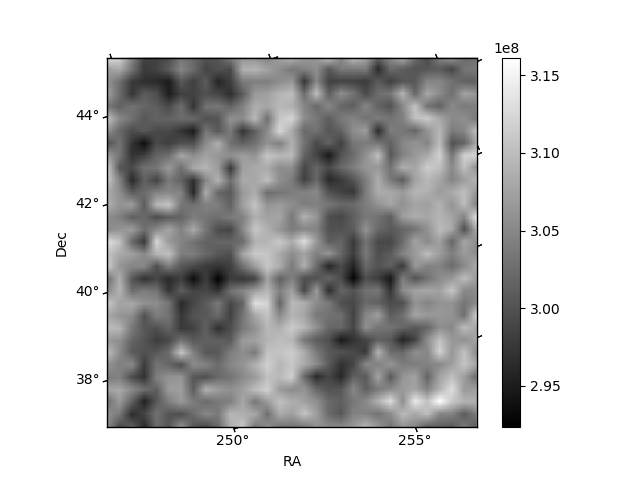
Histogram calculated using DETX and DETY for each event in the final _common_clean file
| Quadrant A | 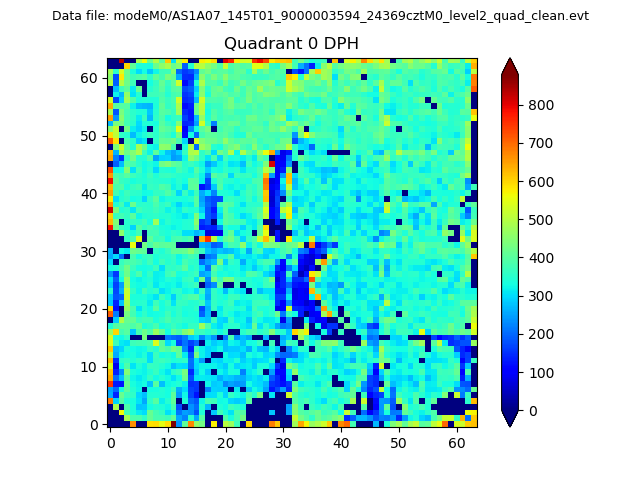 |
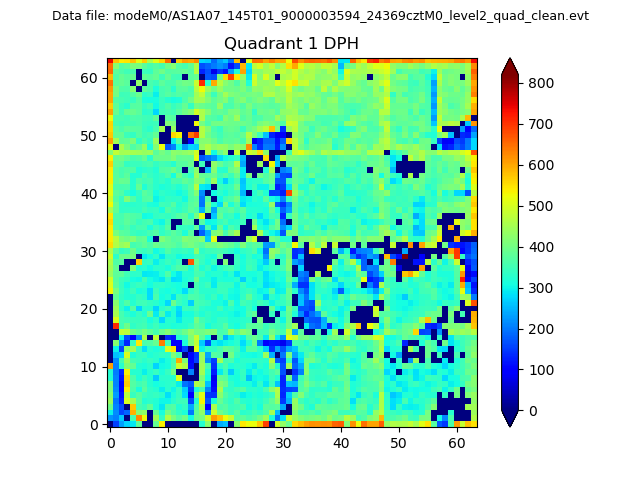 |
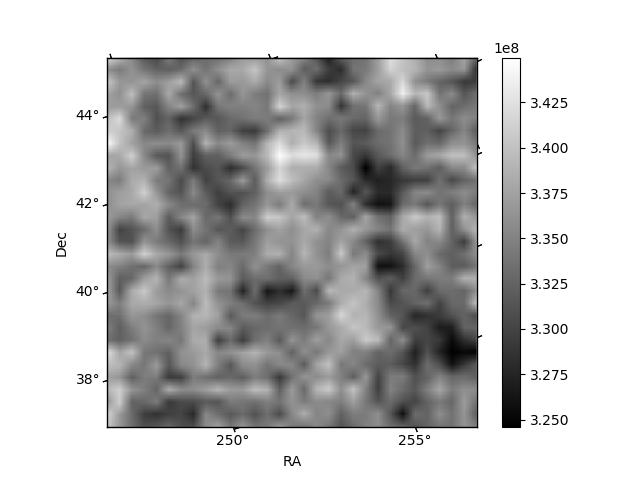
Quadrant B |
|---|---|---|---|
| Quadrant D | 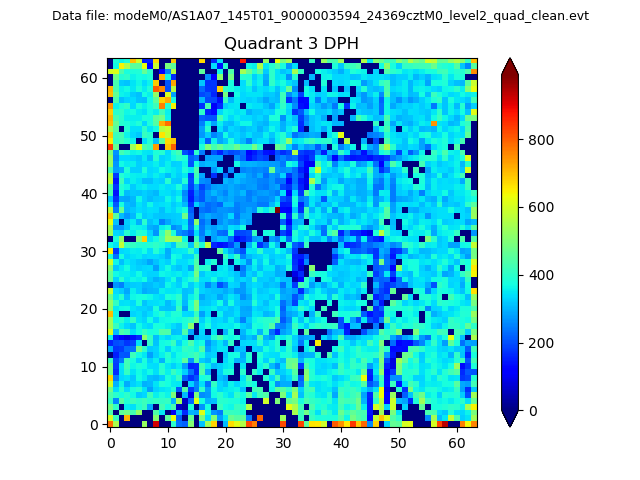 |
 |
Quadrant C |
| Plot type | Count rate plots | Images |
|---|---|---|
| Comparison with Poisson distribution Blue bars denote a histogram of data divided into 1 sec bins. Red curve is a Poisson curve with rate = median count rate of data. |
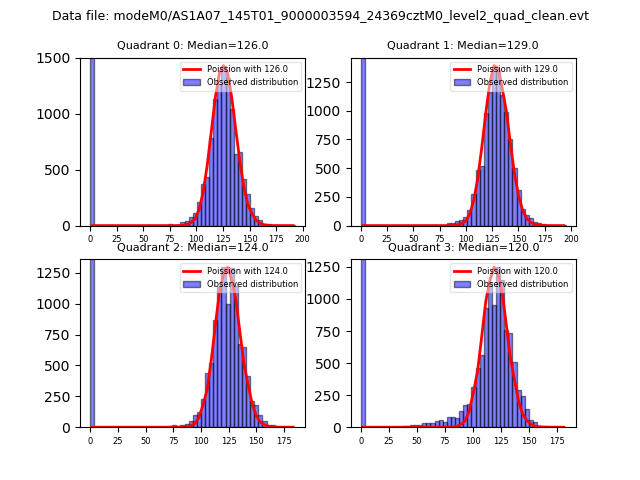 |
 |
| Quadrant-wise count rates Data is divided into 100 sec bins |
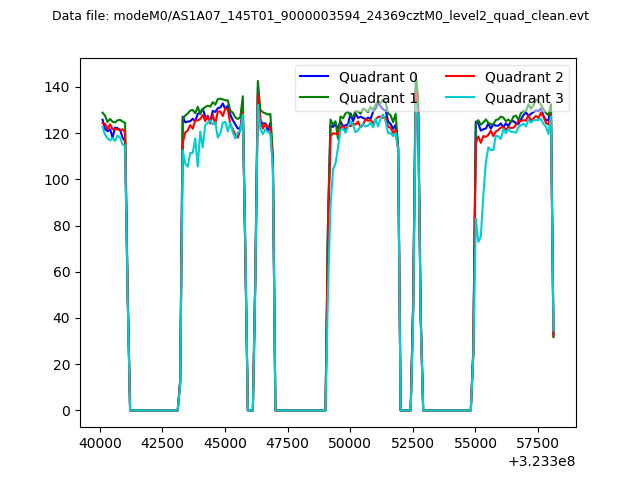 |
|
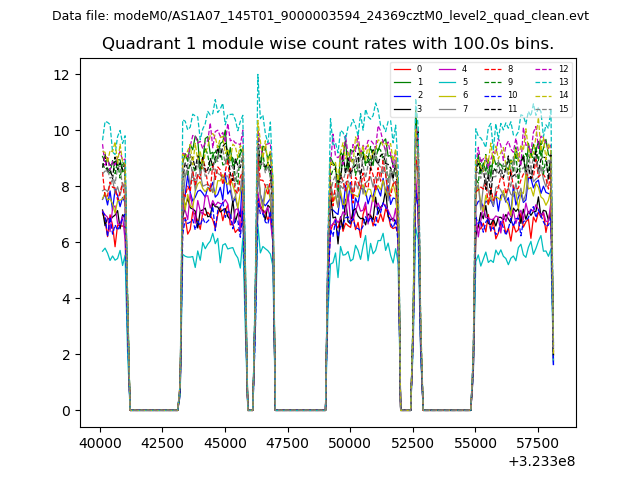
| Module-wise count rates for Quadrant A Data is divided into 100 sec bins |
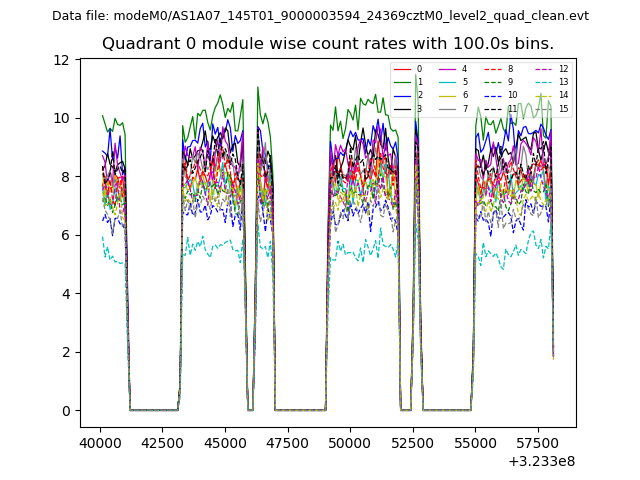 |
 |
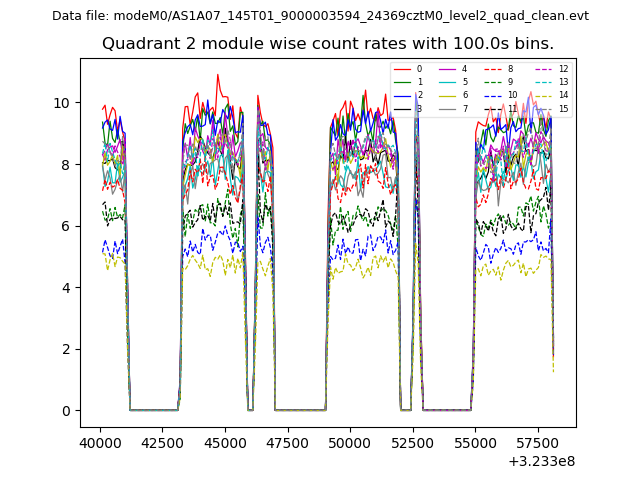
| Module-wise count rates for Quadrant B Data is divided into 100 sec bins |
 |
 |
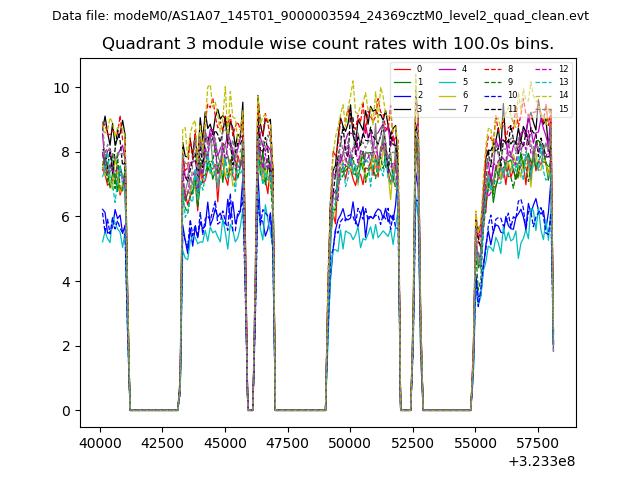
| Module-wise count rates for Quadrant C Data is divided into 100 sec bins |
 |
 |
| Module-wise count rates for Quadrant D Data is divided into 100 sec bins |
 |
 |
| Parameter | Plot |
|---|---|
| CZT HV Monitor | 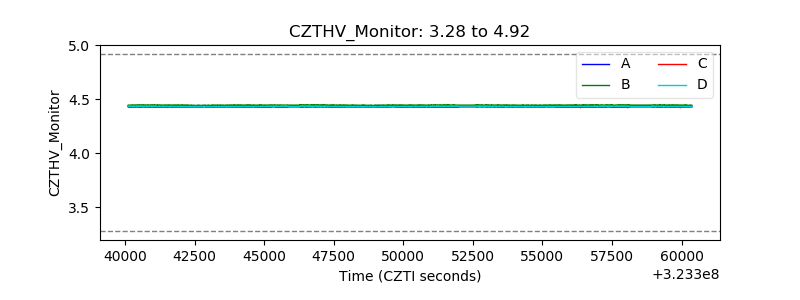 |
| D_VDD | 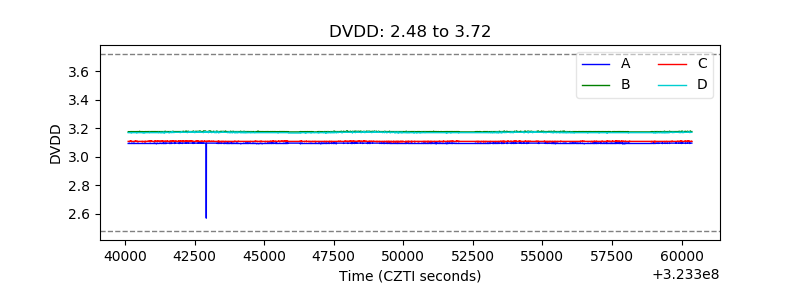 |
| Temperature 1 | 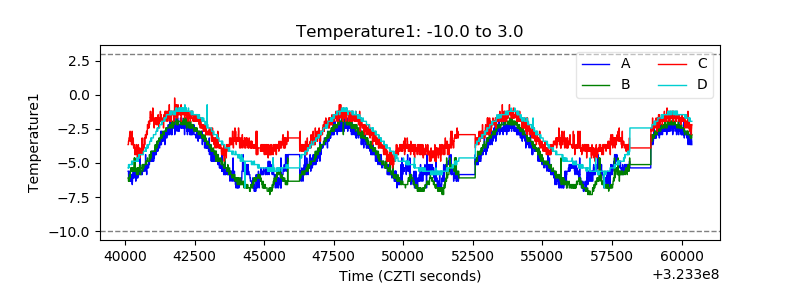 |
| Veto HV Monitor | 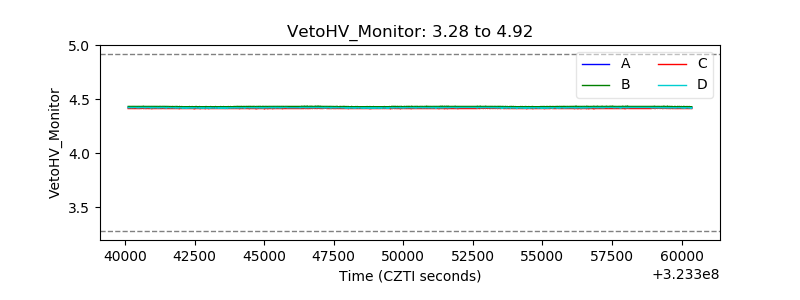 |
| Veto LLD | 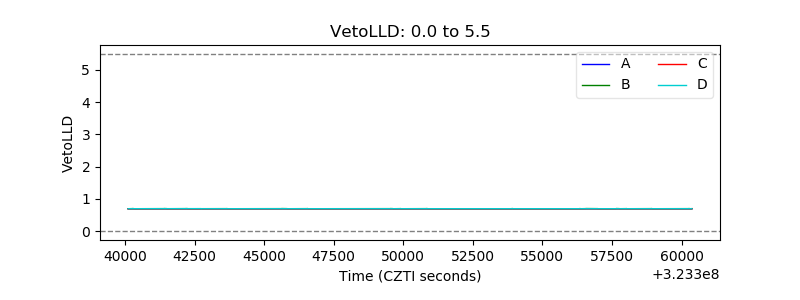 |
| Alpha Counter | 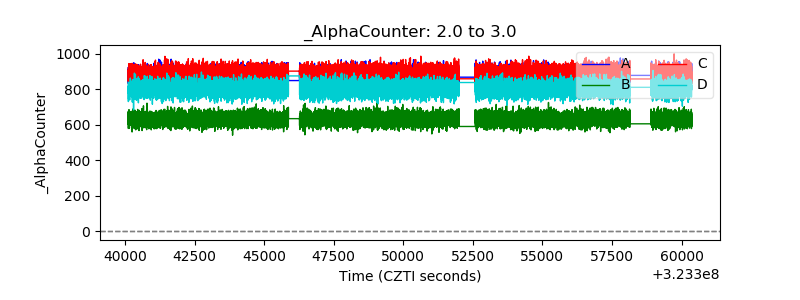 |
| _CPM_Rate | 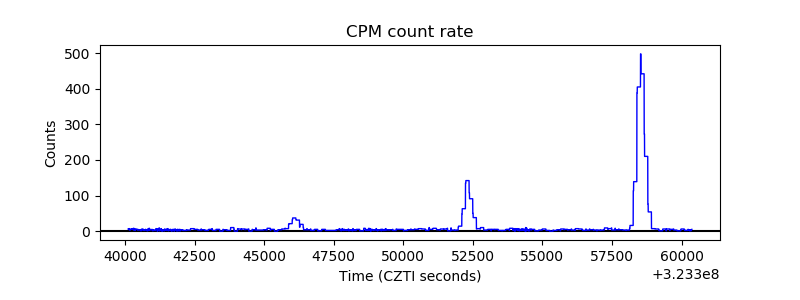 |
| CZT Counter | 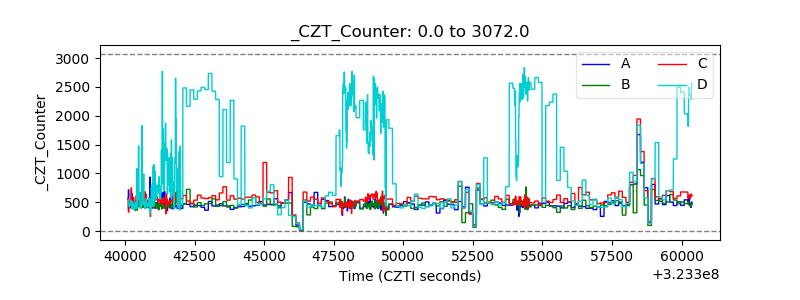 |
| +2.5 Volts monitor |  |
| +5 Volts monitor |  |
| _ROLL_ROT | 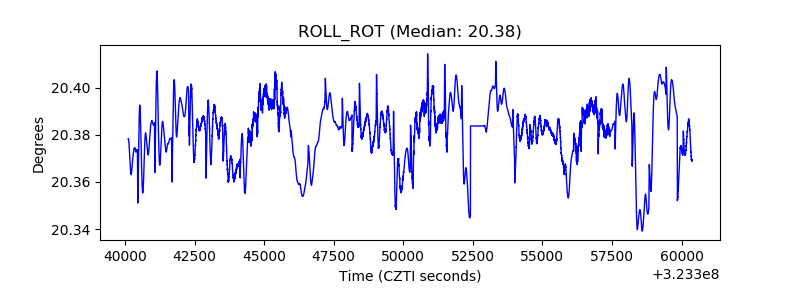 |
| _Roll_DEC | 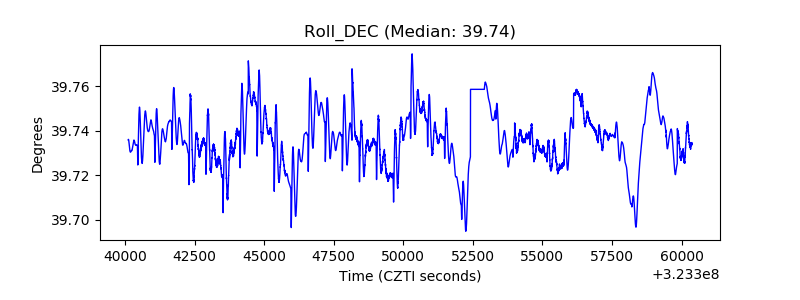 |
| _Roll_RA | 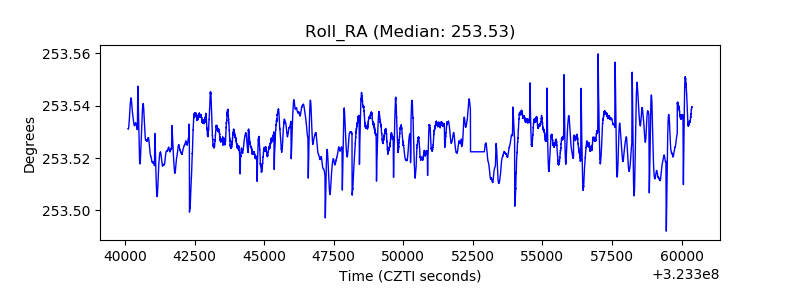 |
| Veto Counter | 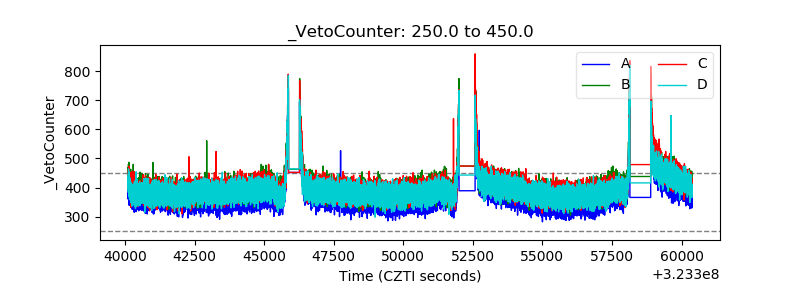 |