| Param | Original file | Final file |
|---|---|---|
| Filename | modeM0/AS1A07_145T01_9000003594_24370cztM0_level2.evt | modeM0/AS1A07_145T01_9000003594_24370cztM0_level2_quad_clean.evt |
| Size (bytes) | 4,194,512,640 | 584,965,440 |
| Size | 3.9 GB | 557.9 MB |
| Events in quadrant A | 22,039,064 | 3,662,526 |
| Events in quadrant B | 22,687,777 | 3,767,894 |
| Events in quadrant C | 27,299,796 | 3,629,609 |
| Events in quadrant D | 51,850,133 | 3,441,454 |
| Mode M0 | |||
|---|---|---|---|
| Quadrant | BADHDUFLAG | Total packets | Discarded packets |
| A | 0 | 96183 | 8 |
| B | 0 | 97299 | 8 |
| C | 0 | 110917 | 8 |
| D | 0 | 186243 | 8 |
| Mode M9 | |||
|---|---|---|---|
| Quadrant | BADHDUFLAG | Total packets | Discarded packets |
| A | 0 | 50 | 0 |
| B | 0 | 51 | 0 |
| C | 0 | 51 | 0 |
| D | 0 | 51 | 0 |
| Mode SS | |||
|---|---|---|---|
| Quadrant | BADHDUFLAG | Total packets | Discarded packets |
| A | 0 | 948 | 0 |
| B | 0 | 948 | 0 |
| C | 0 | 948 | 0 |
| D | 0 | 948 | 0 |
| Quadrant | Total seconds | Saturated seconds | Saturation percentage |
|---|---|---|---|
| A | 46863 | 649 | 1.384888% |
| B | 46863 | 768 | 1.638820% |
| C | 46863 | 1365 | 2.912746% |
| D | 46862 | 10480 | 22.363535% |
Noise dominated data is calculated using 1-second bins in cleaned event files. If a bin has >2000 counts, and if more than 50% of those come from <1% of pixels, then it is considered to be noise-dominated and hence unusable.
| Quadrant | # 1 sec bins | Bins with >0 counts | Bins with >2000 counts | High rate bins dominated by noise | Noise dominated (total time) | Noise dominated (detector-on time) | Marked lightcurve |
|---|---|---|---|---|---|---|---|
| A | 51553 | 46871 | 0 | 0 | 0.00% | 0.00% | 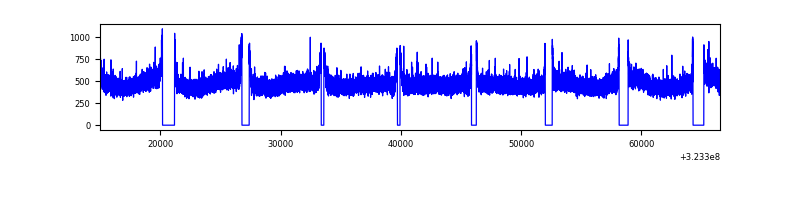 |
| B | 51553 | 46871 | 18 | 18 | 0.03% | 0.04% | 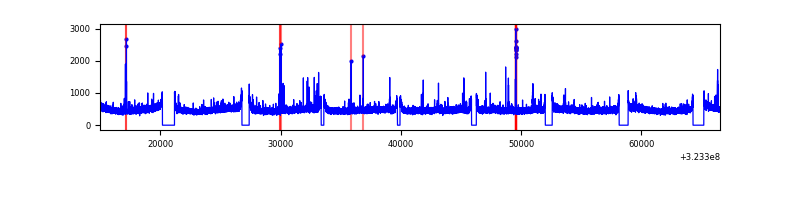 |
| C | 51553 | 46871 | 334 | 334 | 0.65% | 0.71% | 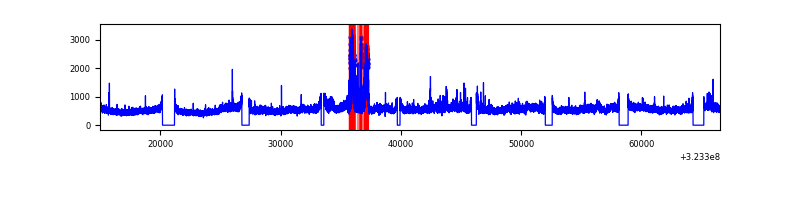 |
| D | 51552 | 46870 | 8973 | 8973 | 17.41% | 19.14% | 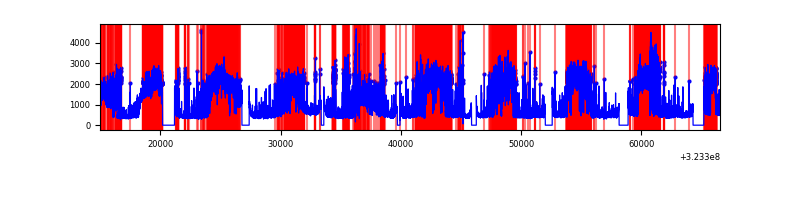 |
Top three noisy pixels from each quadrant. If the there are fewer than three noisy pixels in the level2.evt file, extra rows are filled as -1
| Pixel properties | Quadrant properties | ||||||
|---|---|---|---|---|---|---|---|
| Quadrant | DetID | PixID | Counts | Sigma | Mean | Median | Sigma |
| A | 13 | 254 | 69489 | 55.88 | 5714 | 5594 | 1143.5 |
| A | 3 | 137 | 53420 | 41.82 | 5714 | 5594 | 1143.5 |
| A | 0 | 226 | 48582 | 37.59 | 5714 | 5594 | 1143.5 |
| B | 12 | 111 | 135697 | 120.28 | 5705 | 5562 | 1081.9 |
| B | 0 | 230 | 121860 | 107.49 | 5705 | 5562 | 1081.9 |
| B | 11 | 111 | 121478 | 107.14 | 5705 | 5562 | 1081.9 |
| C | 7 | 247 | 4903866 | 3855.5 | 5480 | 5514 | 1270.5 |
| C | 14 | 238 | 871319 | 681.48 | 5480 | 5514 | 1270.5 |
| C | 2 | 16 | 100518 | 74.78 | 5480 | 5514 | 1270.5 |
| D | 9 | 35 | 22356851 | 17740.85 | 5181 | 5024 | 1259.9 |
| D | 7 | 238 | 3026173 | 2397.91 | 5181 | 5024 | 1259.9 |
| D | 1 | 52 | 2838986 | 2249.34 | 5181 | 5024 | 1259.9 |
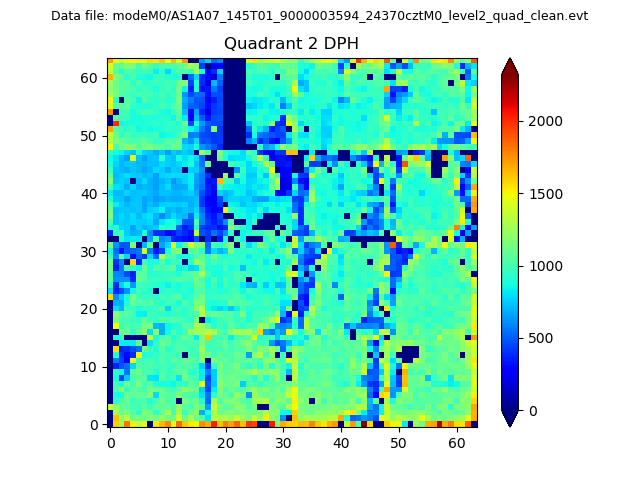
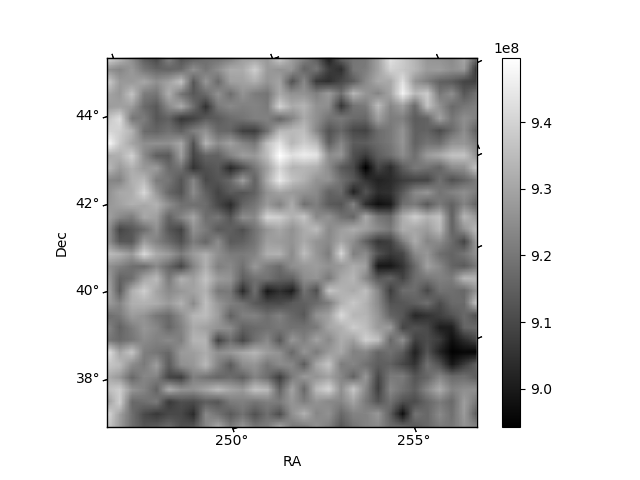
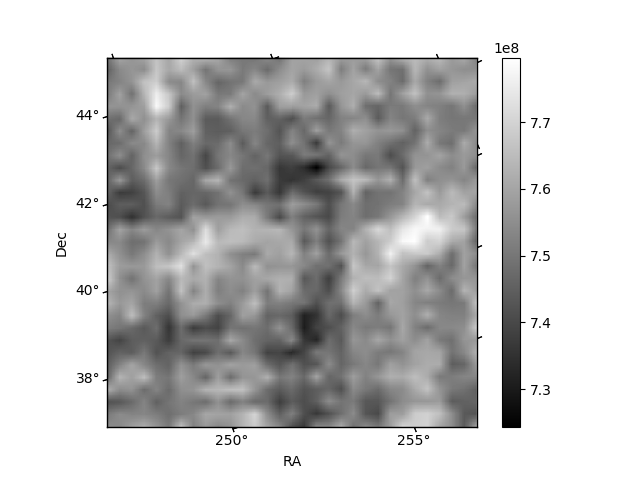
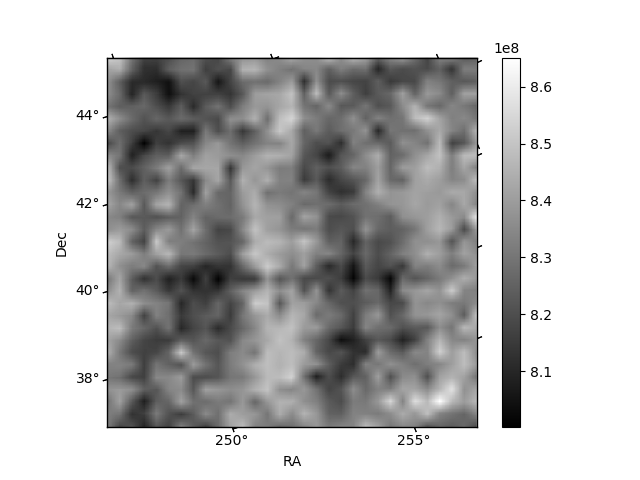
Histogram calculated using DETX and DETY for each event in the final _common_clean file
| Quadrant A | 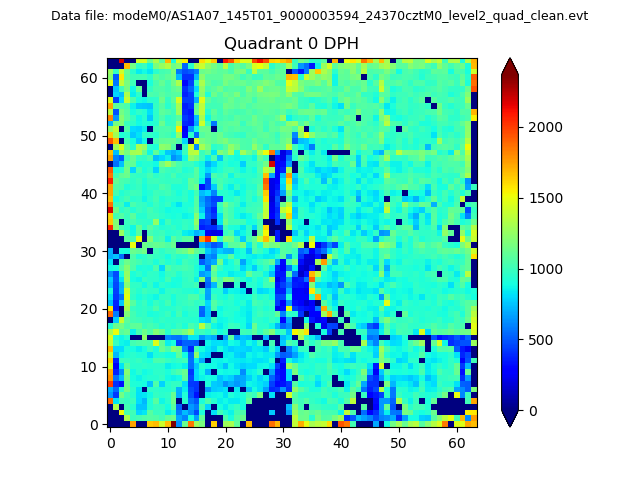 |
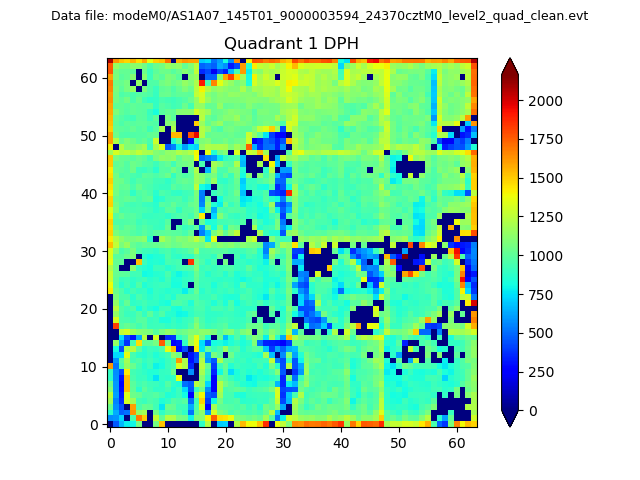 |
Quadrant B |
|---|---|---|---|
| Quadrant D | 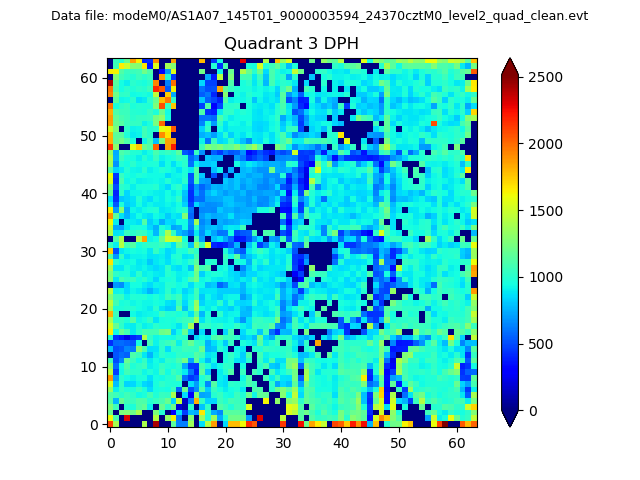 |
 |
Quadrant C |
| Plot type | Count rate plots | Images |
|---|---|---|
| Comparison with Poisson distribution Blue bars denote a histogram of data divided into 1 sec bins. Red curve is a Poisson curve with rate = median count rate of data. |
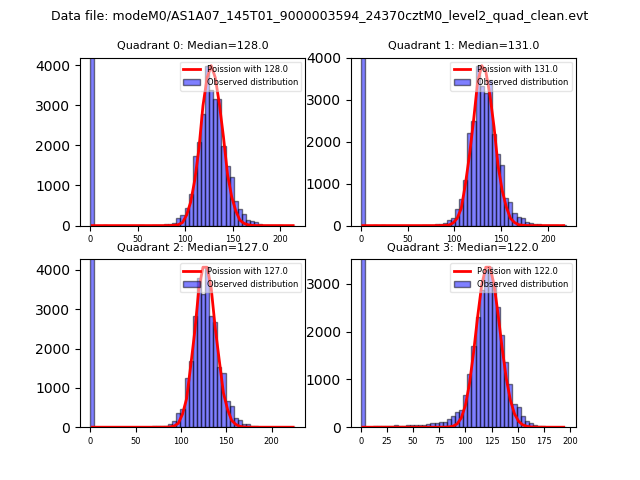 |
 |
| Quadrant-wise count rates Data is divided into 100 sec bins |
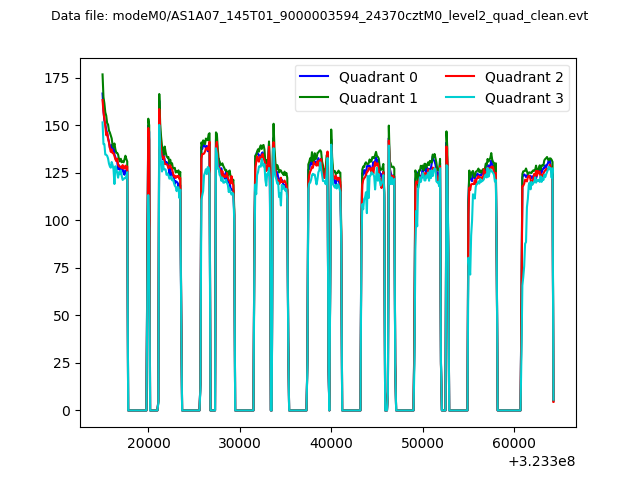 |
|
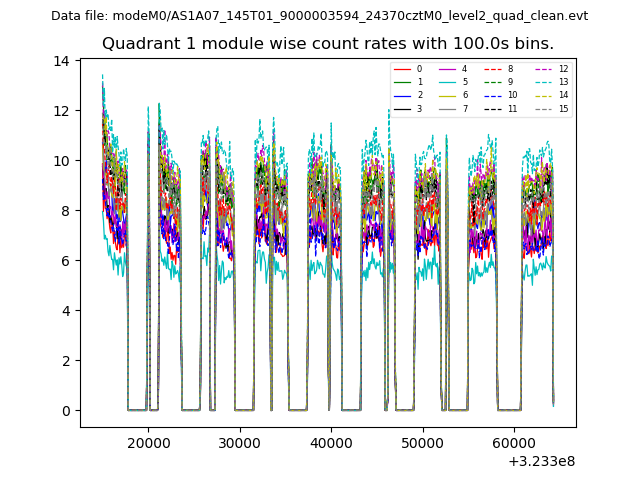
| Module-wise count rates for Quadrant A Data is divided into 100 sec bins |
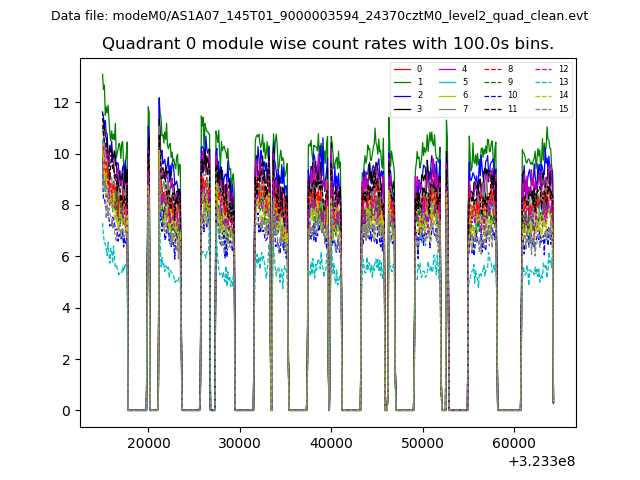 |
 |
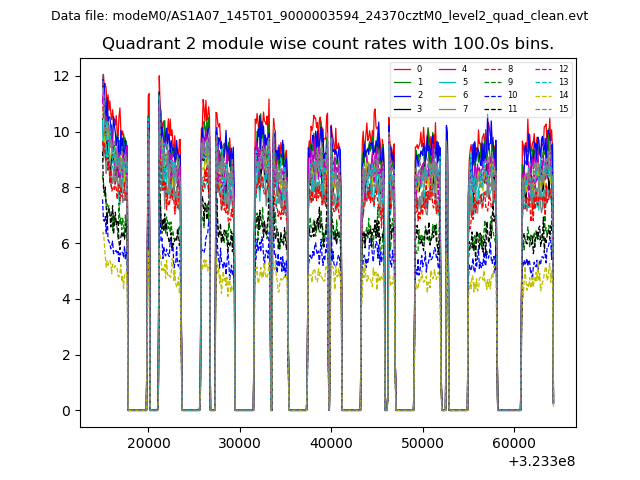
| Module-wise count rates for Quadrant B Data is divided into 100 sec bins |
 |
 |
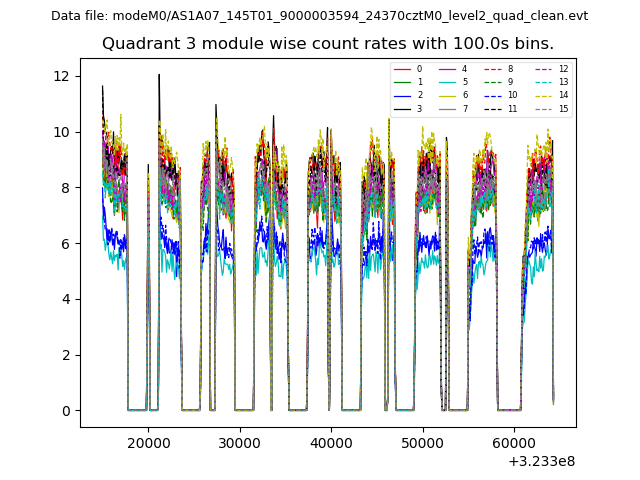
| Module-wise count rates for Quadrant C Data is divided into 100 sec bins |
 |
 |
| Module-wise count rates for Quadrant D Data is divided into 100 sec bins |
 |
 |
| Parameter | Plot |
|---|---|
| CZT HV Monitor | 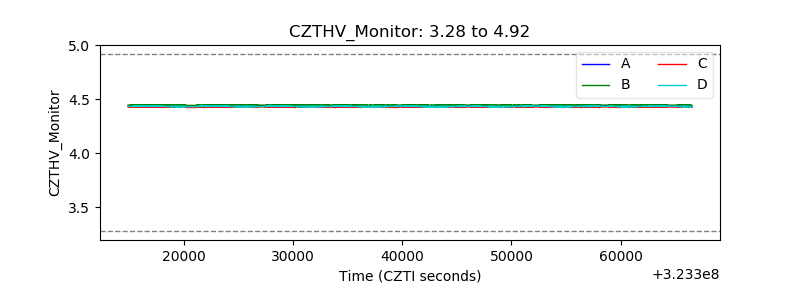 |
| D_VDD | 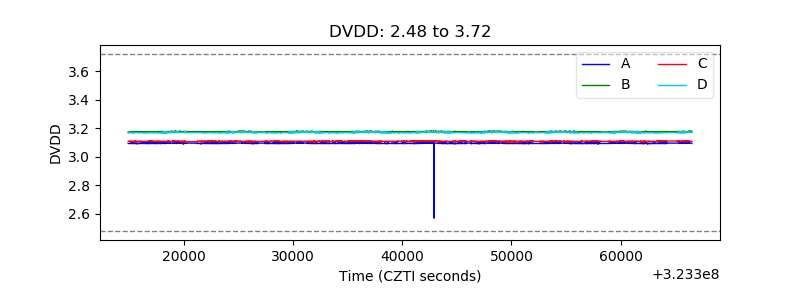 |
| Temperature 1 | 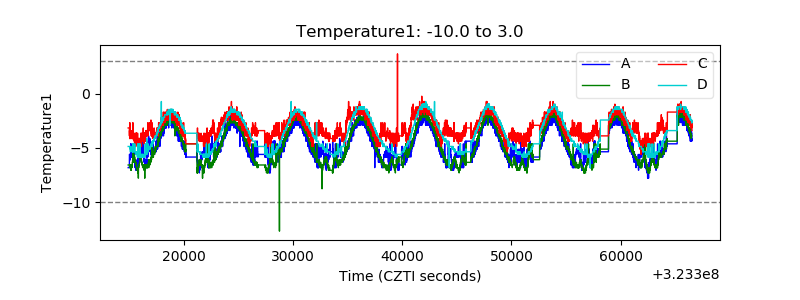 |
| Veto HV Monitor | 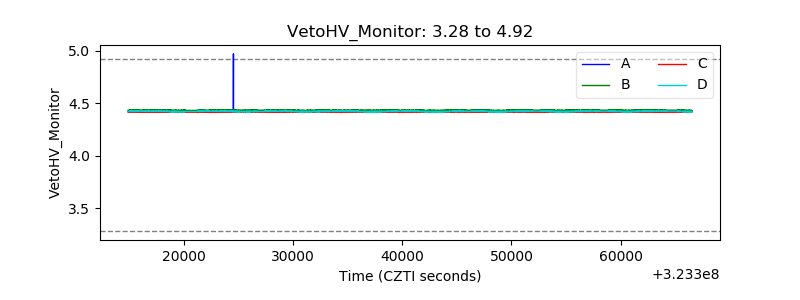 |
| Veto LLD | 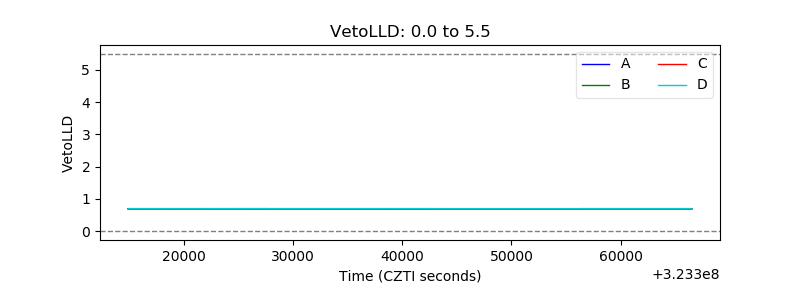 |
| Alpha Counter | 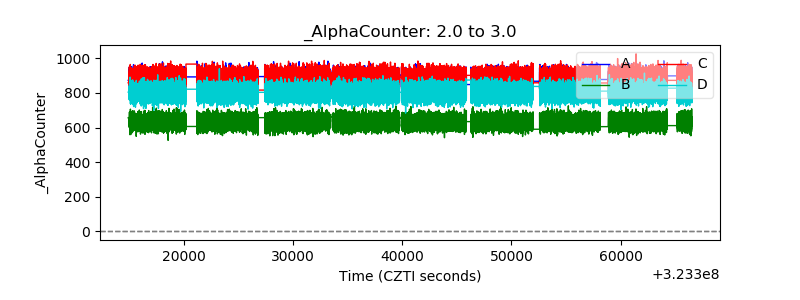 |
| _CPM_Rate | 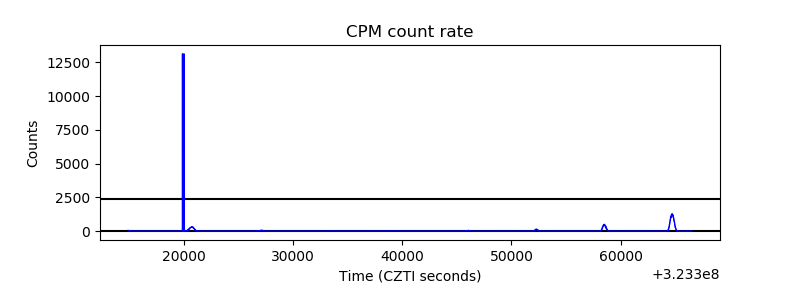 |
| CZT Counter | 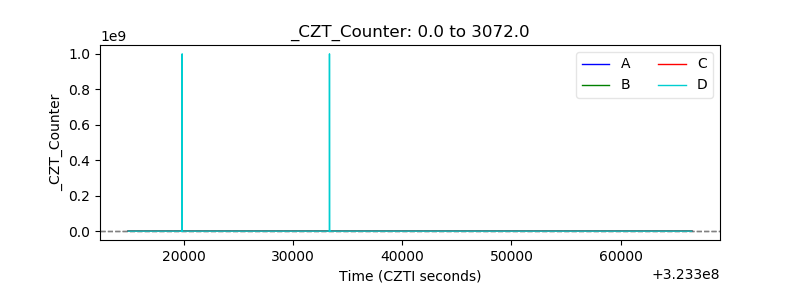 |
| +2.5 Volts monitor |  |
| +5 Volts monitor |  |
| _ROLL_ROT | 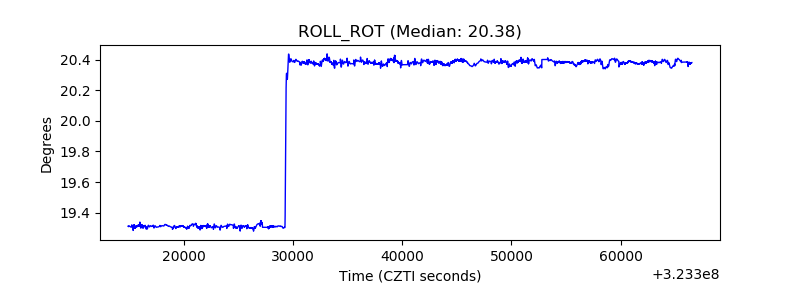 |
| _Roll_DEC | 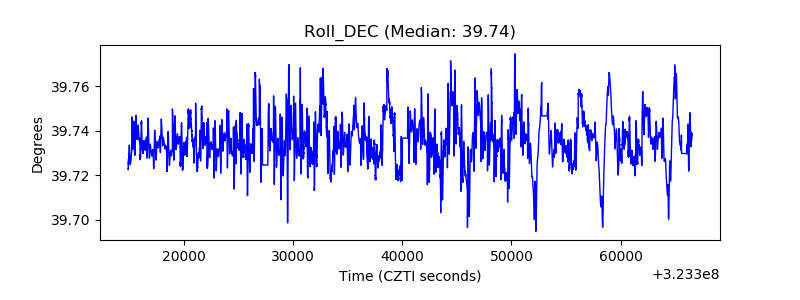 |
| _Roll_RA |  |
| Veto Counter | 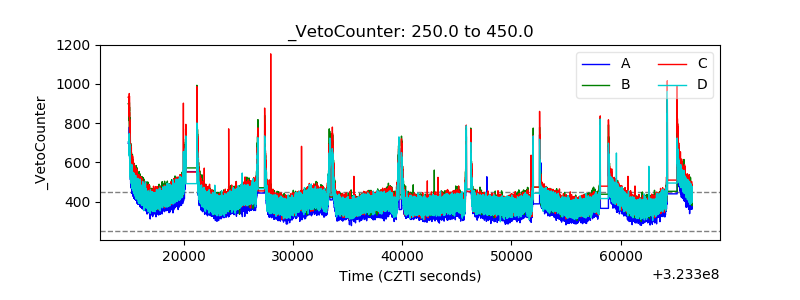 |