| Param | Original file | Final file |
|---|---|---|
| Filename | modeM0/AS1A07_145T01_9000003594_24372cztM0_level2.evt | modeM0/AS1A07_145T01_9000003594_24372cztM0_level2_quad_clean.evt |
| Size (bytes) | 608,446,080 | 84,827,520 |
| Size | 580.3 MB | 80.9 MB |
| Events in quadrant A | 3,353,952 | 530,925 |
| Events in quadrant B | 3,402,100 | 543,894 |
| Events in quadrant C | 4,222,611 | 522,163 |
| Events in quadrant D | 6,994,500 | 505,314 |
| Mode M0 | |||
|---|---|---|---|
| Quadrant | BADHDUFLAG | Total packets | Discarded packets |
| A | 0 | 14406 | 2 |
| B | 0 | 14479 | 2 |
| C | 0 | 17120 | 2 |
| D | 0 | 25372 | 2 |
| Mode M9 | |||
|---|---|---|---|
| Quadrant | BADHDUFLAG | Total packets | Discarded packets |
| A | 0 | 20 | 0 |
| B | 0 | 20 | 0 |
| C | 0 | 20 | 0 |
| D | 0 | 20 | 0 |
| Mode SS | |||
|---|---|---|---|
| Quadrant | BADHDUFLAG | Total packets | Discarded packets |
| A | 0 | 136 | 0 |
| B | 0 | 136 | 0 |
| C | 0 | 136 | 0 |
| D | 0 | 136 | 0 |
| Quadrant | Total seconds | Saturated seconds | Saturation percentage |
|---|---|---|---|
| A | 6694 | 105 | 1.568569% |
| B | 6695 | 102 | 1.523525% |
| C | 6695 | 188 | 2.808066% |
| D | 6695 | 1892 | 28.259895% |
Noise dominated data is calculated using 1-second bins in cleaned event files. If a bin has >2000 counts, and if more than 50% of those come from <1% of pixels, then it is considered to be noise-dominated and hence unusable.
| Quadrant | # 1 sec bins | Bins with >0 counts | Bins with >2000 counts | High rate bins dominated by noise | Noise dominated (total time) | Noise dominated (detector-on time) | Marked lightcurve |
|---|---|---|---|---|---|---|---|
| A | 8654 | 6696 | 0 | 0 | 0.00% | 0.00% | 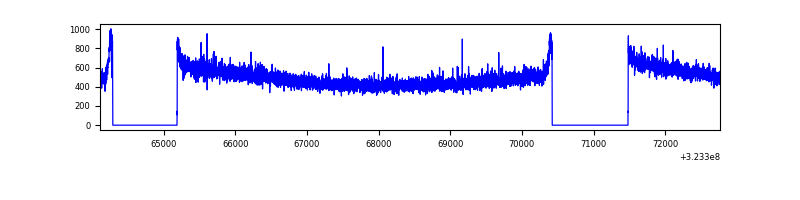 |
| B | 8655 | 6697 | 0 | 0 | 0.00% | 0.00% | 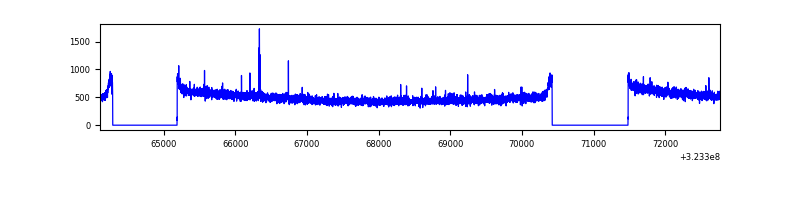 |
| C | 8655 | 6697 | 4 | 4 | 0.05% | 0.06% | 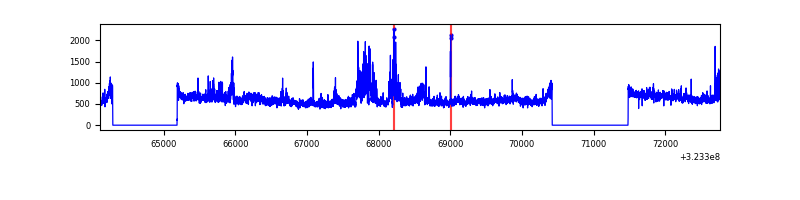 |
| D | 8655 | 6697 | 1580 | 1580 | 18.26% | 23.59% | 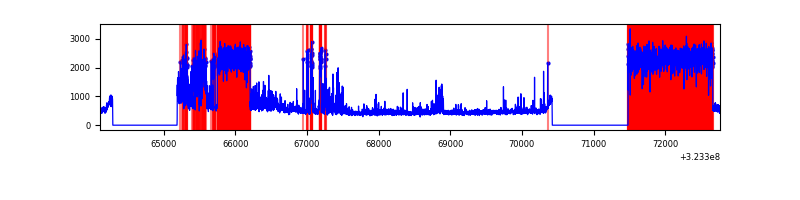 |
Top three noisy pixels from each quadrant. If the there are fewer than three noisy pixels in the level2.evt file, extra rows are filled as -1
| Pixel properties | Quadrant properties | ||||||
|---|---|---|---|---|---|---|---|
| Quadrant | DetID | PixID | Counts | Sigma | Mean | Median | Sigma |
| A | 13 | 254 | 10504 | 55.12 | 868 | 848 | 175.2 |
| A | 3 | 137 | 7836 | 39.89 | 868 | 848 | 175.2 |
| A | 0 | 226 | 7558 | 38.3 | 868 | 848 | 175.2 |
| B | 12 | 111 | 20061 | 116.43 | 867 | 848 | 165.0 |
| B | 11 | 111 | 17988 | 103.87 | 867 | 848 | 165.0 |
| B | 14 | 111 | 15662 | 89.77 | 867 | 848 | 165.0 |
| C | 7 | 247 | 744240 | 3781.3 | 841 | 848 | 196.6 |
| C | 14 | 238 | 134756 | 681.13 | 841 | 848 | 196.6 |
| C | 3 | 233 | 52667 | 263.58 | 841 | 848 | 196.6 |
| D | 9 | 35 | 3531830 | 19374.12 | 750 | 726 | 182.3 |
| D | 8 | 195 | 222842 | 1218.68 | 750 | 726 | 182.3 |
| D | 1 | 52 | 200851 | 1098.03 | 750 | 726 | 182.3 |
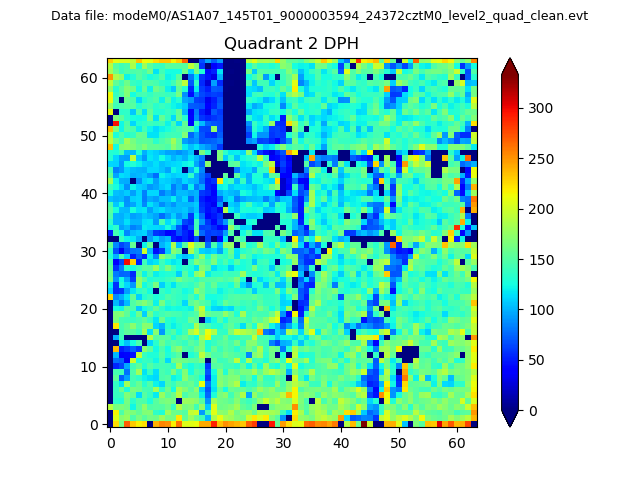
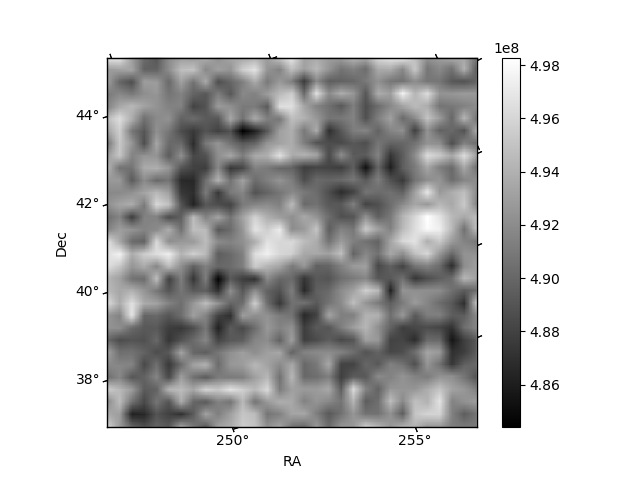
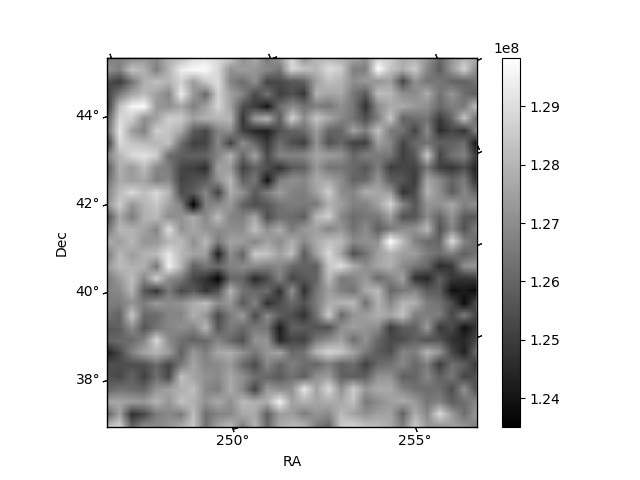
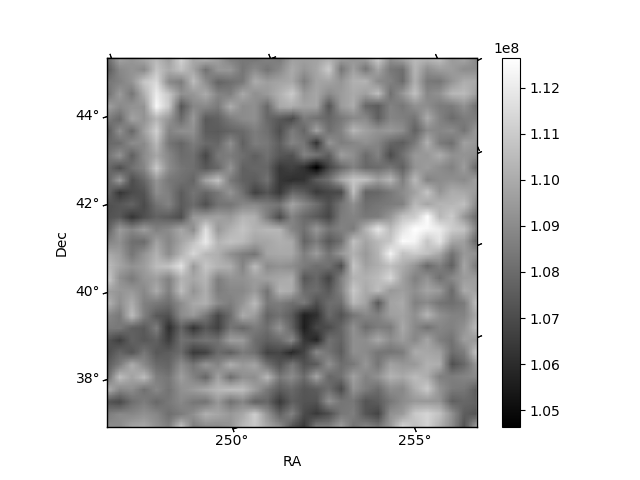
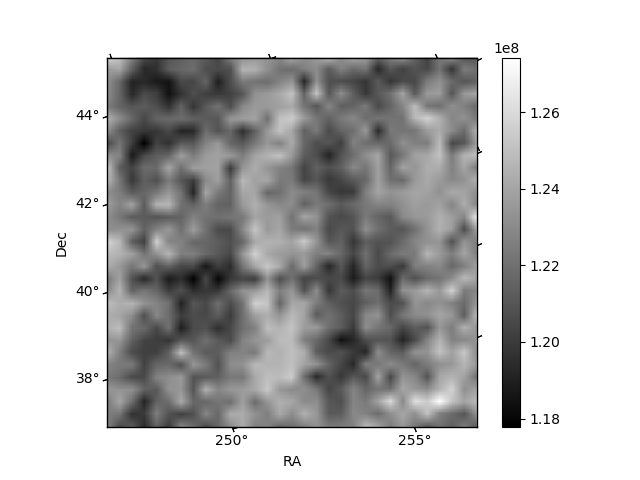
Histogram calculated using DETX and DETY for each event in the final _common_clean file
| Quadrant A | 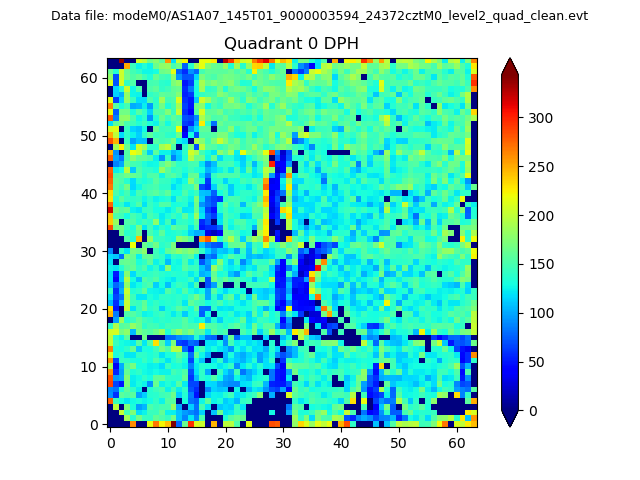 |
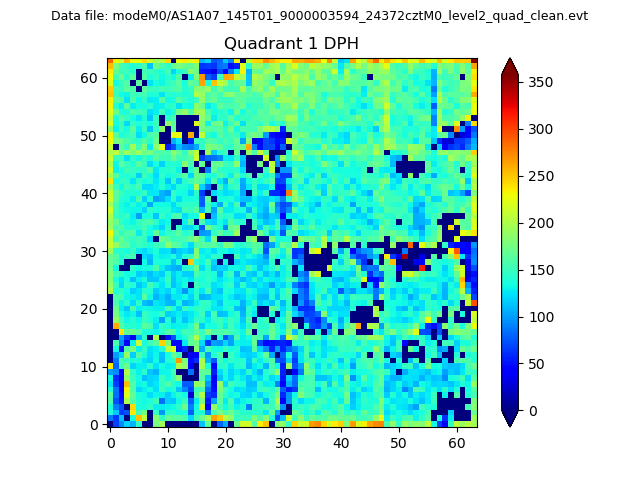 |
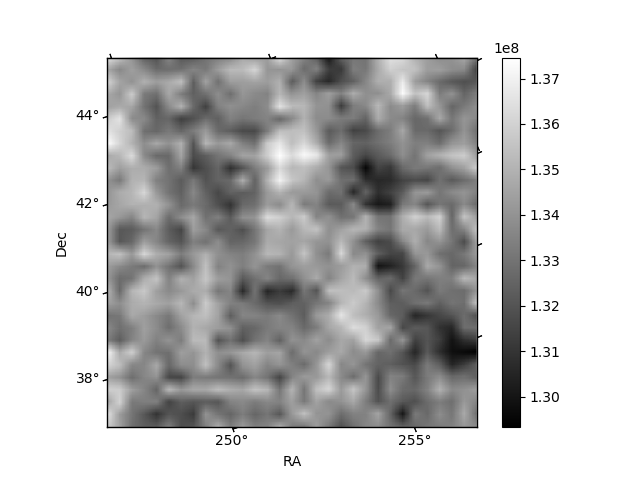
Quadrant B |
|---|---|---|---|
| Quadrant D | 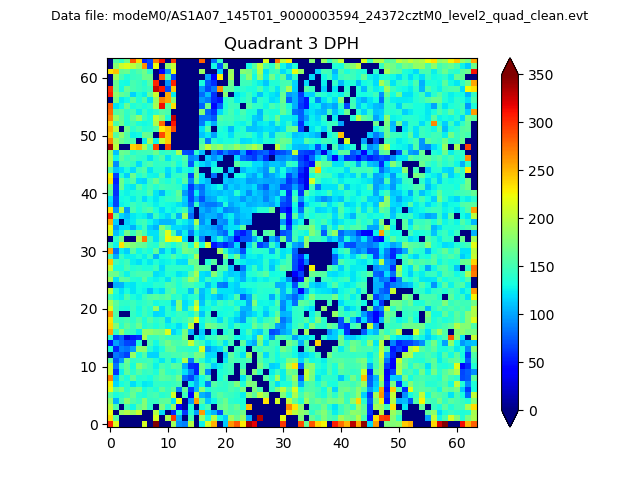 |
 |
Quadrant C |
| Plot type | Count rate plots | Images |
|---|---|---|
| Comparison with Poisson distribution Blue bars denote a histogram of data divided into 1 sec bins. Red curve is a Poisson curve with rate = median count rate of data. |
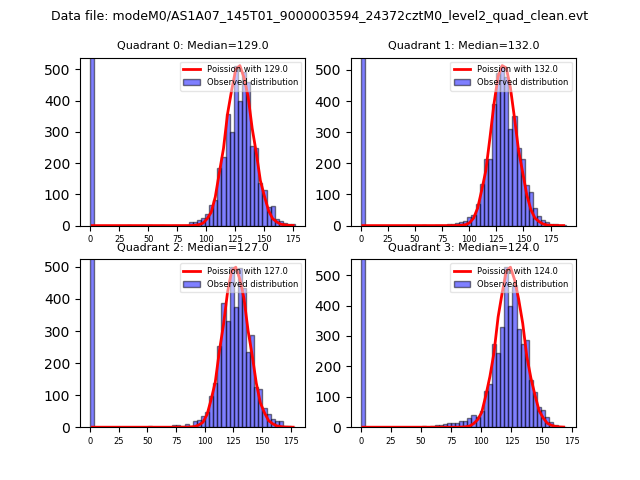 |
 |
| Quadrant-wise count rates Data is divided into 100 sec bins |
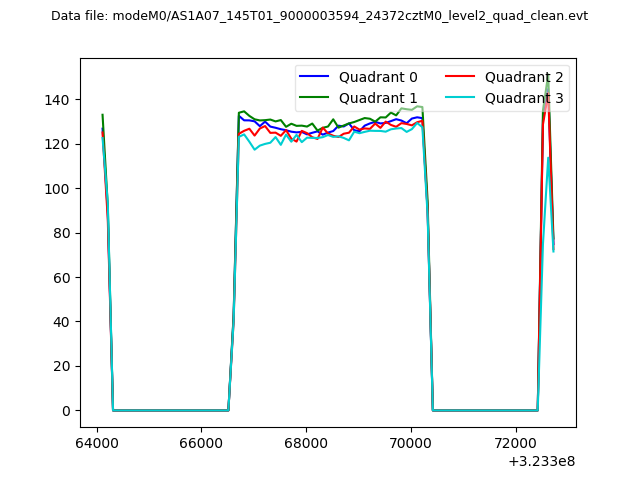 |
|
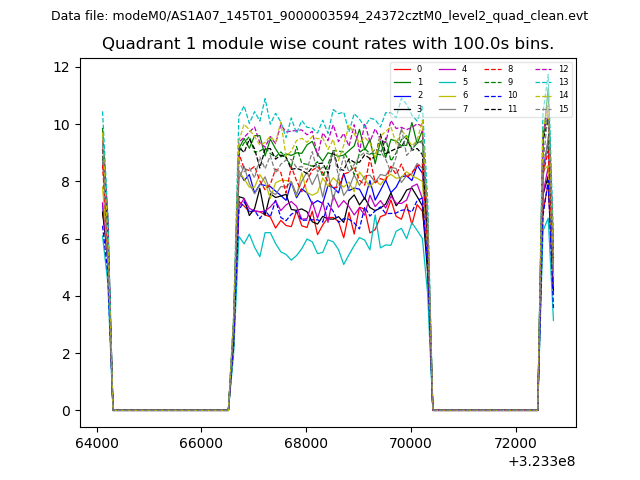
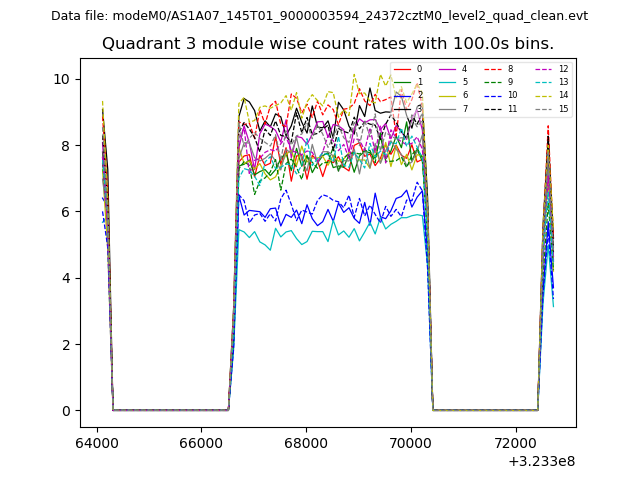
| Module-wise count rates for Quadrant A Data is divided into 100 sec bins |
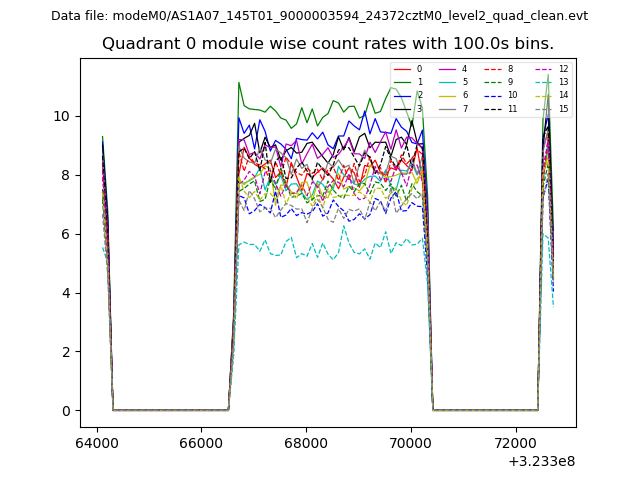 |
 |
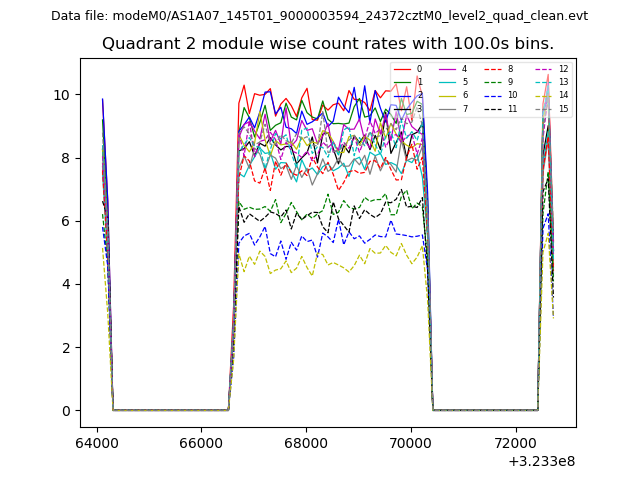
| Module-wise count rates for Quadrant B Data is divided into 100 sec bins |
 |
 |
| Module-wise count rates for Quadrant C Data is divided into 100 sec bins |
 |
 |
| Module-wise count rates for Quadrant D Data is divided into 100 sec bins |
 |
 |
| Parameter | Plot |
|---|---|
| CZT HV Monitor | 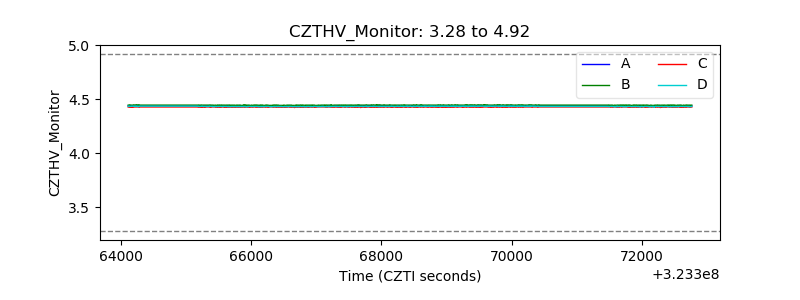 |
| D_VDD | 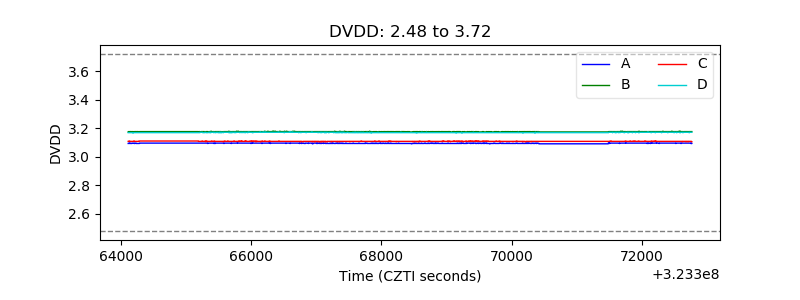 |
| Temperature 1 | 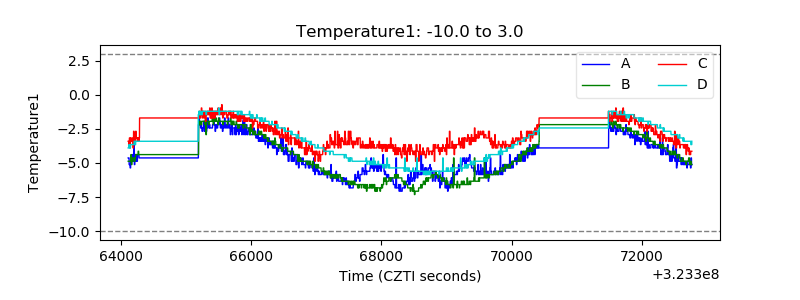 |
| Veto HV Monitor | 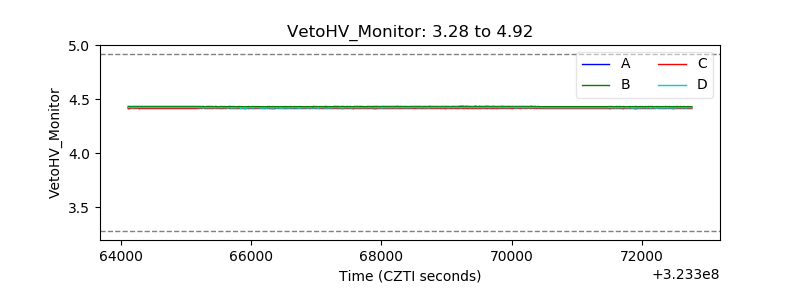 |
| Veto LLD | 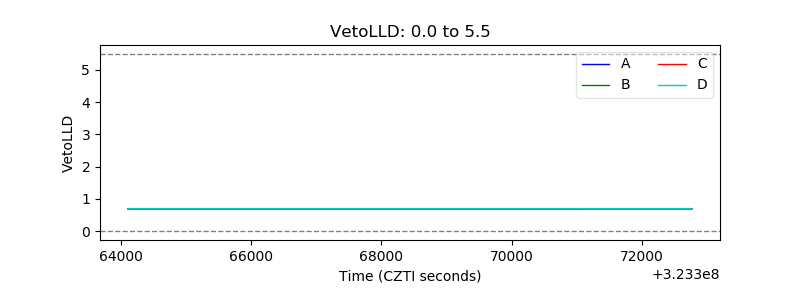 |
| Alpha Counter | 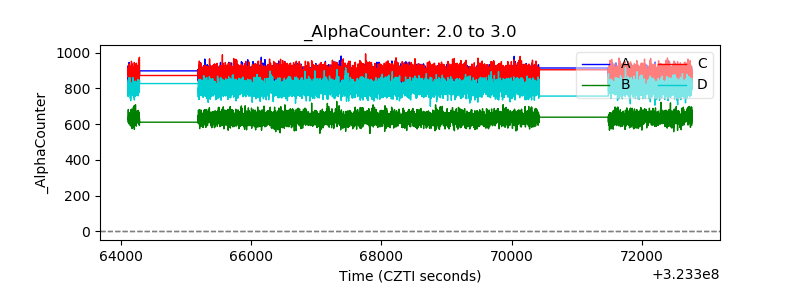 |
| _CPM_Rate | 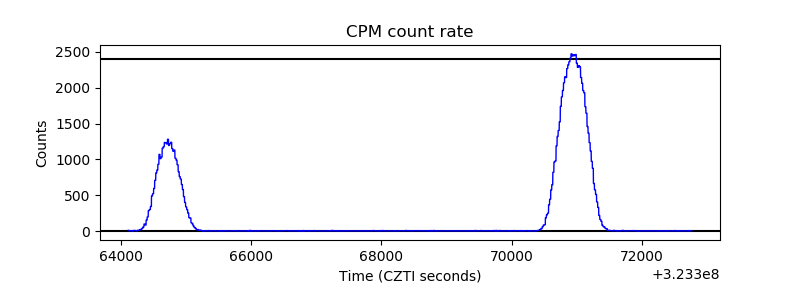 |
| CZT Counter | 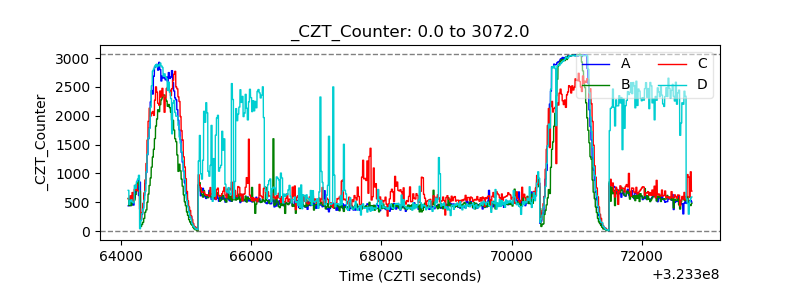 |
| +2.5 Volts monitor |  |
| +5 Volts monitor |  |
| _ROLL_ROT | 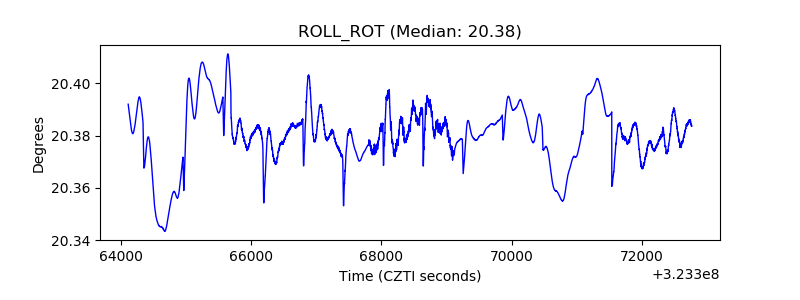 |
| _Roll_DEC | 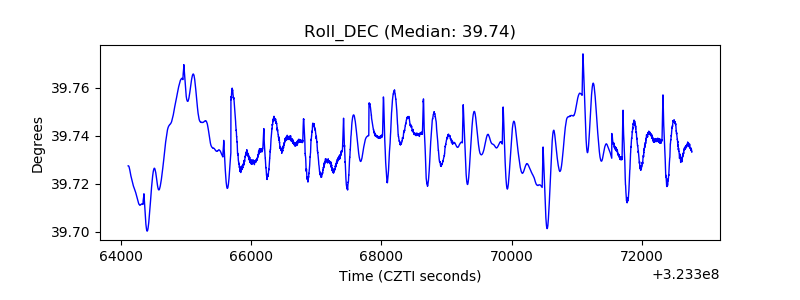 |
| _Roll_RA | 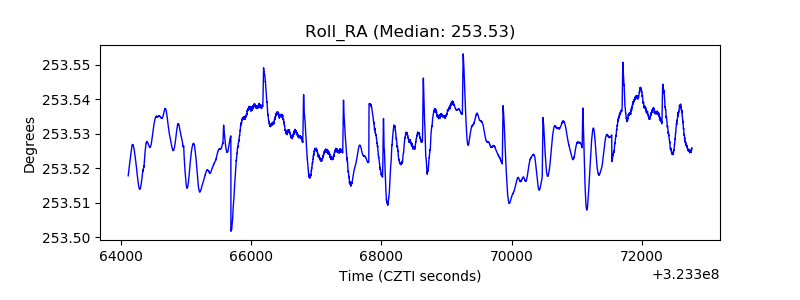 |
| Veto Counter | 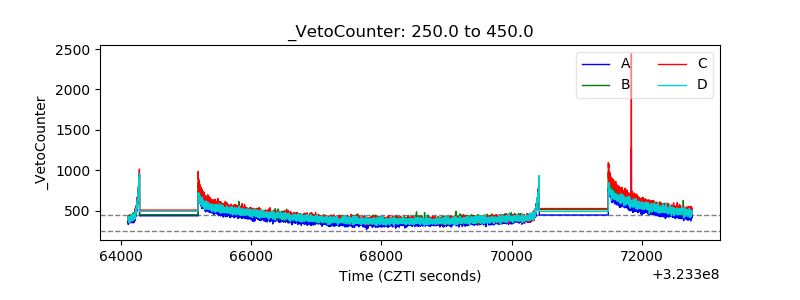 |