| Param | Original file | Final file |
|---|---|---|
| Filename | modeM0/AS1A07_145T01_9000003594_24373cztM0_level2.evt | modeM0/AS1A07_145T01_9000003594_24373cztM0_level2_quad_clean.evt |
| Size (bytes) | 224,614,080 | 38,145,600 |
| Size | 214.2 MB | 36.4 MB |
| Events in quadrant A | 1,195,124 | 245,994 |
| Events in quadrant B | 1,221,525 | 253,062 |
| Events in quadrant C | 1,462,632 | 244,358 |
| Events in quadrant D | 2,751,676 | 232,328 |
| Mode M0 | |||
|---|---|---|---|
| Quadrant | BADHDUFLAG | Total packets | Discarded packets |
| A | 0 | 5180 | 0 |
| B | 0 | 5231 | 0 |
| C | 0 | 6007 | 0 |
| D | 0 | 9806 | 0 |
| Mode SS | |||
|---|---|---|---|
| Quadrant | BADHDUFLAG | Total packets | Discarded packets |
| A | 0 | 50 | 0 |
| B | 0 | 50 | 0 |
| C | 0 | 50 | 0 |
| D | 0 | 50 | 0 |
| Quadrant | Total seconds | Saturated seconds | Saturation percentage |
|---|---|---|---|
| A | 2492 | 1 | 0.040128% |
| B | 2492 | 3 | 0.120385% |
| C | 2492 | 29 | 1.163724% |
| D | 2492 | 815 | 32.704655% |
Noise dominated data is calculated using 1-second bins in cleaned event files. If a bin has >2000 counts, and if more than 50% of those come from <1% of pixels, then it is considered to be noise-dominated and hence unusable.
| Quadrant | # 1 sec bins | Bins with >0 counts | Bins with >2000 counts | High rate bins dominated by noise | Noise dominated (total time) | Noise dominated (detector-on time) | Marked lightcurve |
|---|---|---|---|---|---|---|---|
| A | 2492 | 2492 | 0 | 0 | 0.00% | 0.00% | 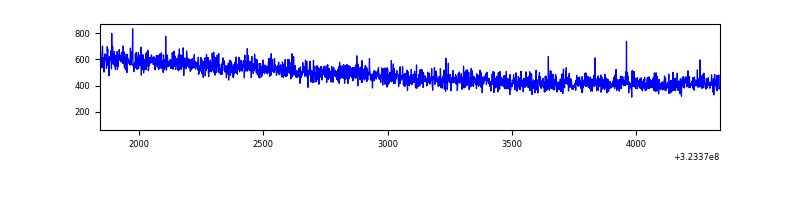 |
| B | 2492 | 2492 | 0 | 0 | 0.00% | 0.00% | 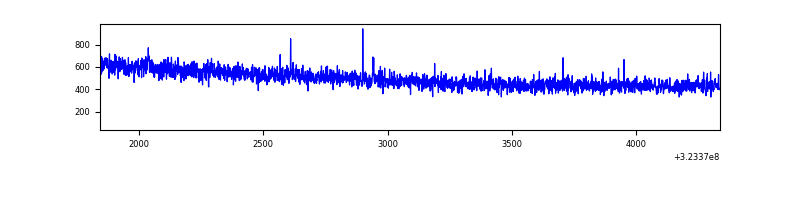 |
| C | 2492 | 2492 | 4 | 4 | 0.16% | 0.16% | 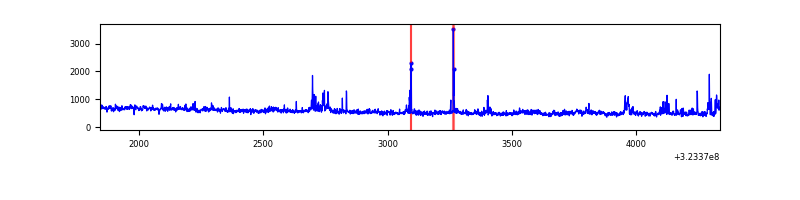 |
| D | 2492 | 2492 | 754 | 754 | 30.26% | 30.26% | 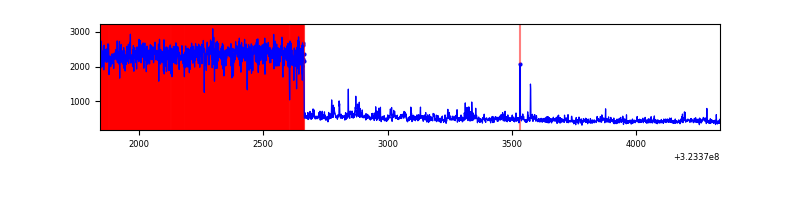 |
Top three noisy pixels from each quadrant. If the there are fewer than three noisy pixels in the level2.evt file, extra rows are filled as -1
| Pixel properties | Quadrant properties | ||||||
|---|---|---|---|---|---|---|---|
| Quadrant | DetID | PixID | Counts | Sigma | Mean | Median | Sigma |
| A | 13 | 254 | 4204 | 60.74 | 309 | 302 | 64.2 |
| A | 3 | 137 | 2605 | 35.85 | 309 | 302 | 64.2 |
| A | 0 | 226 | 2576 | 35.4 | 309 | 302 | 64.2 |
| B | 12 | 111 | 6921 | 108.88 | 312 | 304 | 60.8 |
| B | 11 | 111 | 6109 | 95.52 | 312 | 304 | 60.8 |
| B | 14 | 111 | 5297 | 82.15 | 312 | 304 | 60.8 |
| C | 7 | 247 | 121450 | 1656.02 | 308 | 311 | 73.2 |
| C | 3 | 233 | 86624 | 1179.93 | 308 | 311 | 73.2 |
| C | 14 | 238 | 50364 | 684.24 | 308 | 311 | 73.2 |
| D | 9 | 35 | 1609957 | 24456.63 | 263 | 256 | 65.8 |
| D | 8 | 195 | 81999 | 1241.94 | 263 | 256 | 65.8 |
| D | 1 | 52 | 54151 | 818.84 | 263 | 256 | 65.8 |
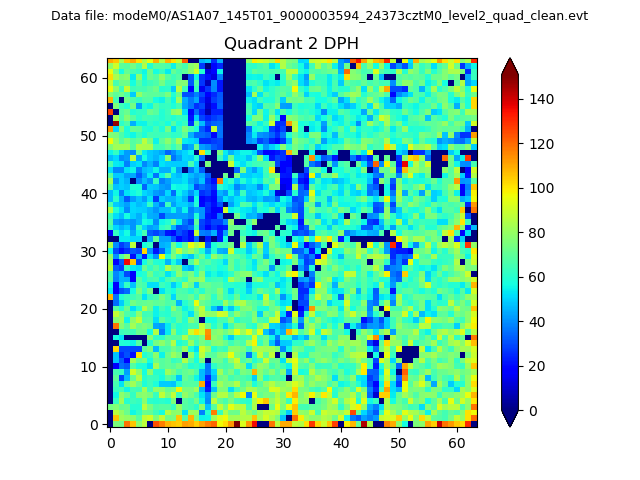
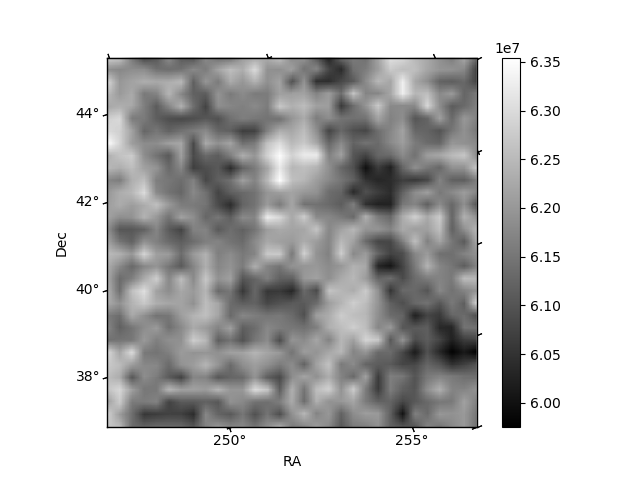
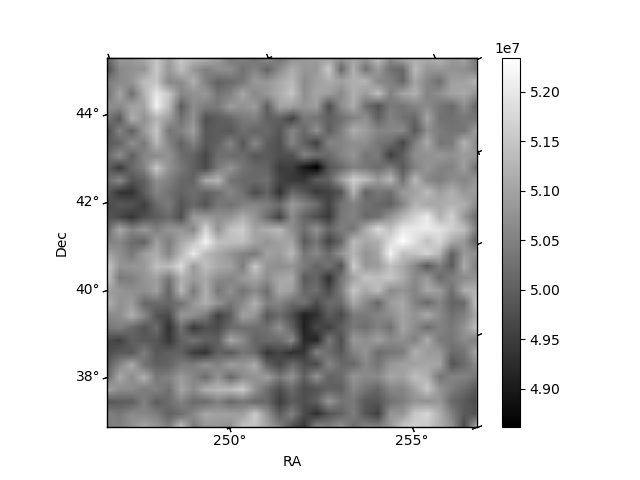
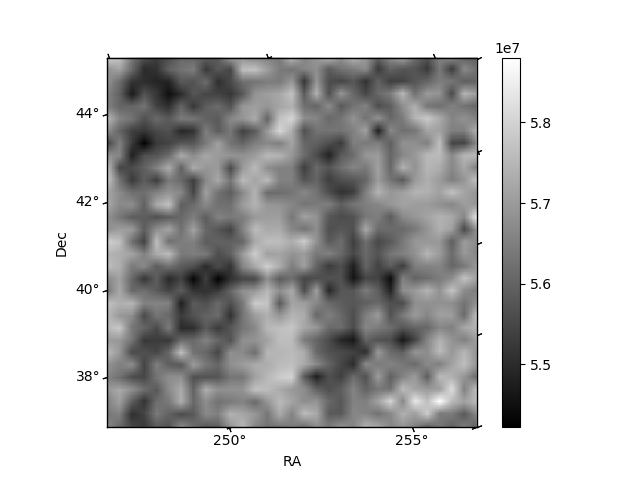
Histogram calculated using DETX and DETY for each event in the final _common_clean file
| Quadrant A | 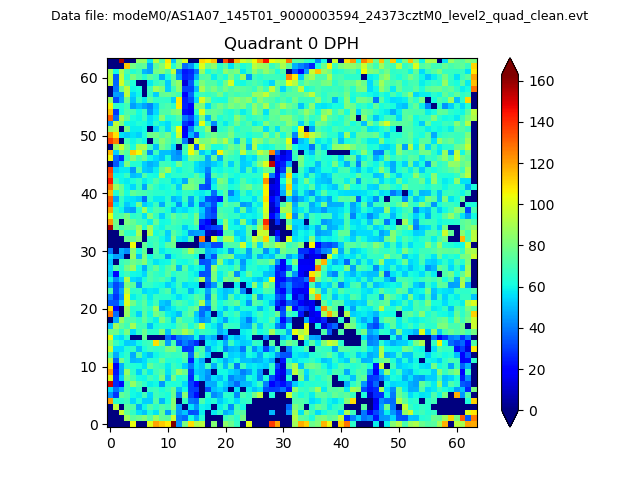 |
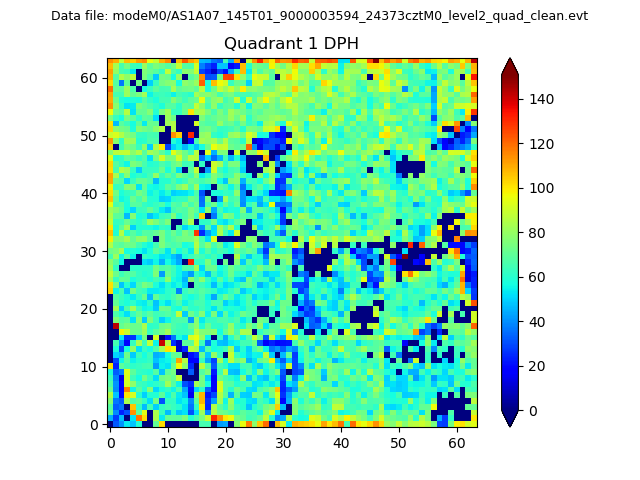 |
Quadrant B |
|---|---|---|---|
| Quadrant D | 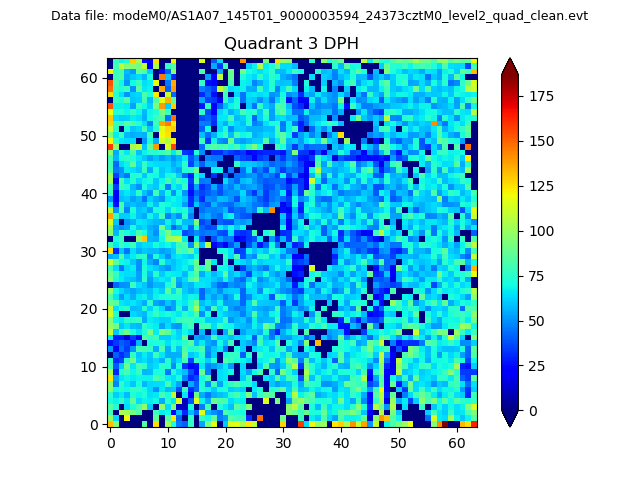 |
 |
Quadrant C |
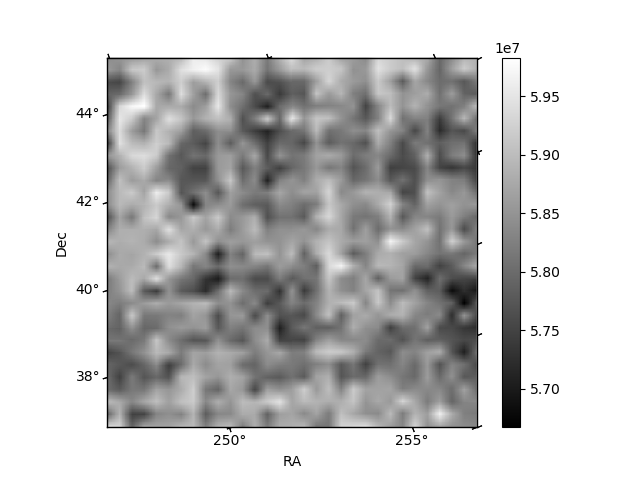
| Plot type | Count rate plots | Images |
|---|---|---|
| Comparison with Poisson distribution Blue bars denote a histogram of data divided into 1 sec bins. Red curve is a Poisson curve with rate = median count rate of data. |
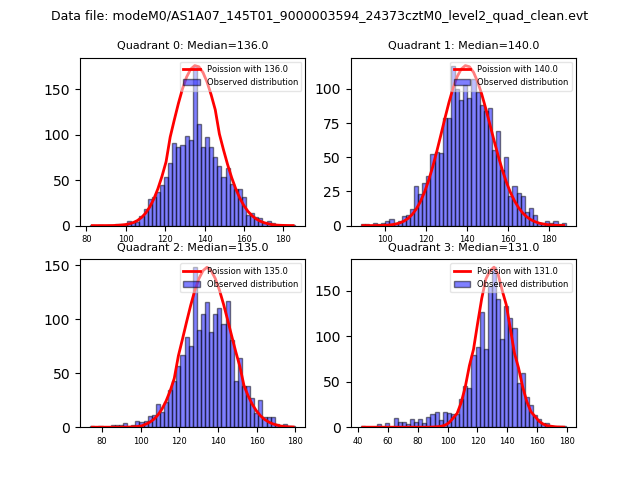 |
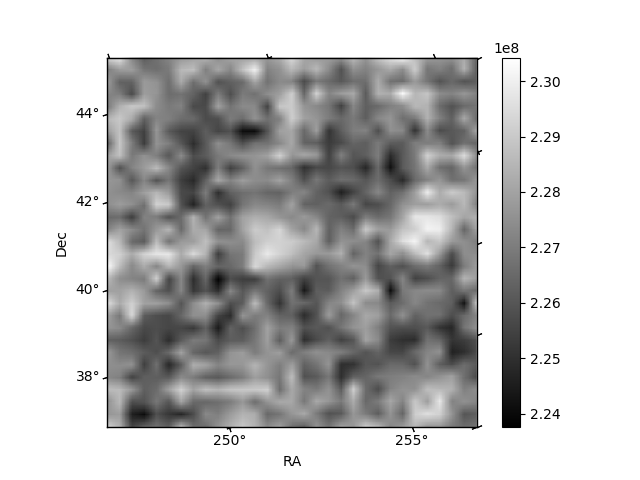 |
| Quadrant-wise count rates Data is divided into 100 sec bins |
 |
|
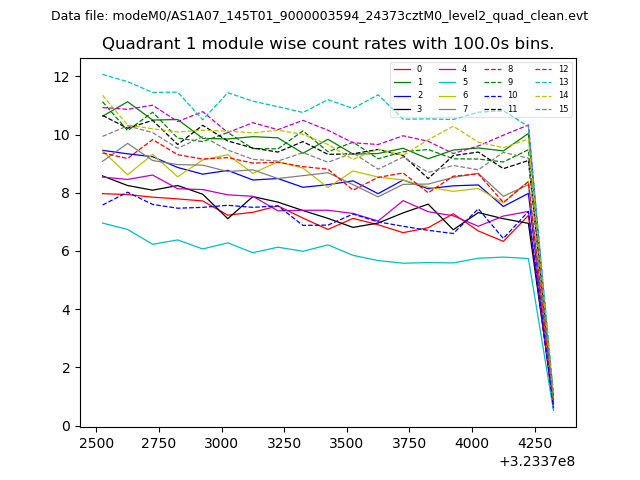
| Module-wise count rates for Quadrant A Data is divided into 100 sec bins |
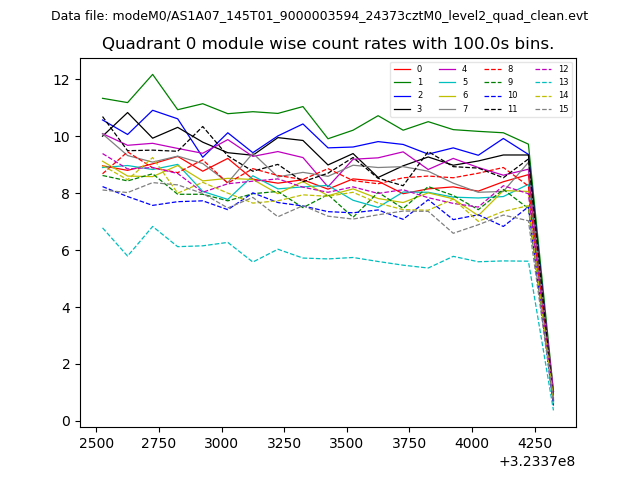 |
 |
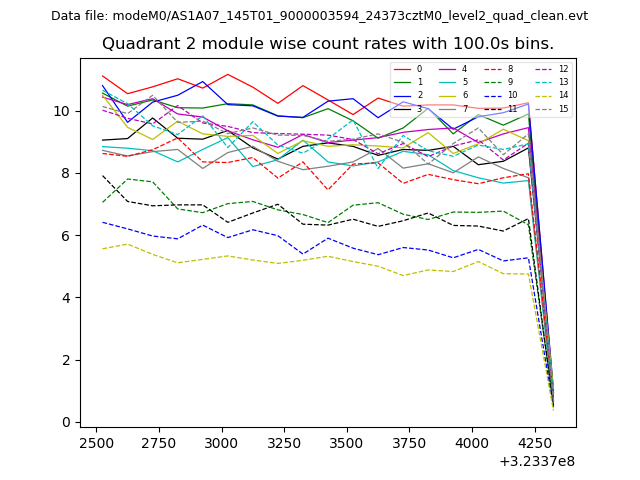
| Module-wise count rates for Quadrant B Data is divided into 100 sec bins |
 |
 |
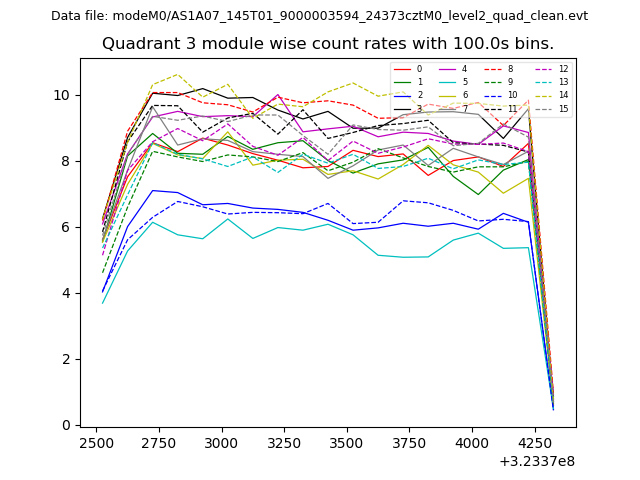
| Module-wise count rates for Quadrant C Data is divided into 100 sec bins |
 |
 |
| Module-wise count rates for Quadrant D Data is divided into 100 sec bins |
 |
 |
| Parameter | Plot |
|---|---|
| CZT HV Monitor | 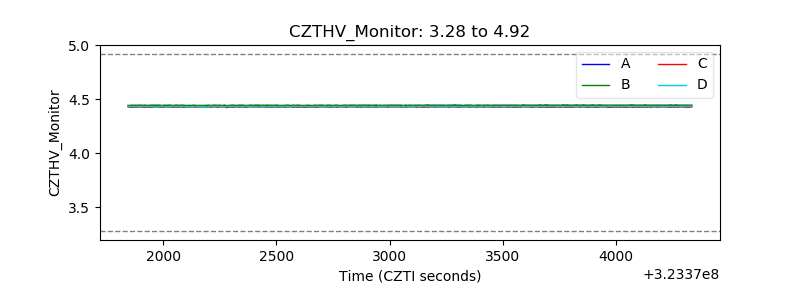 |
| D_VDD | 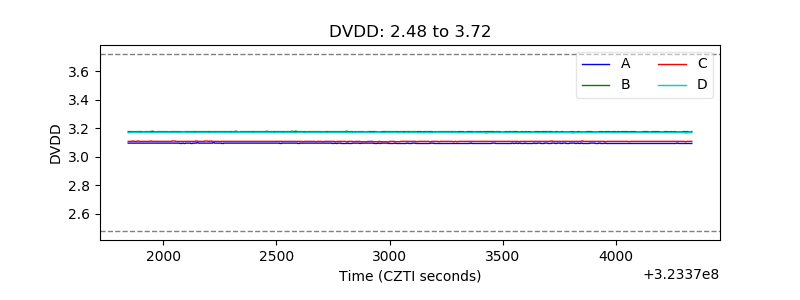 |
| Temperature 1 | 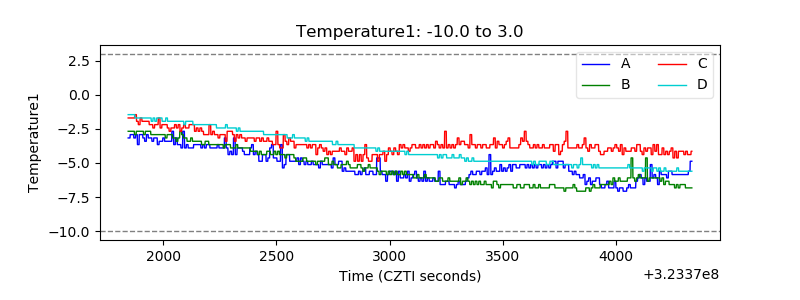 |
| Veto HV Monitor | 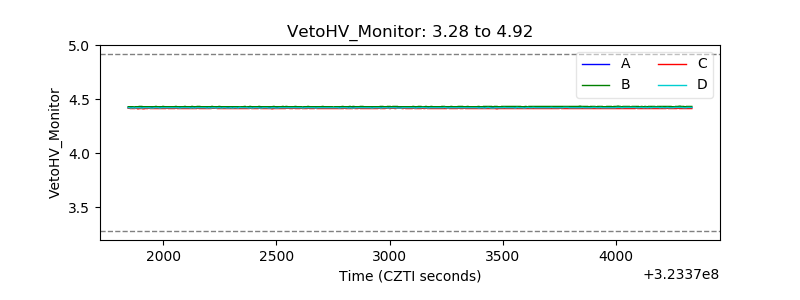 |
| Veto LLD | 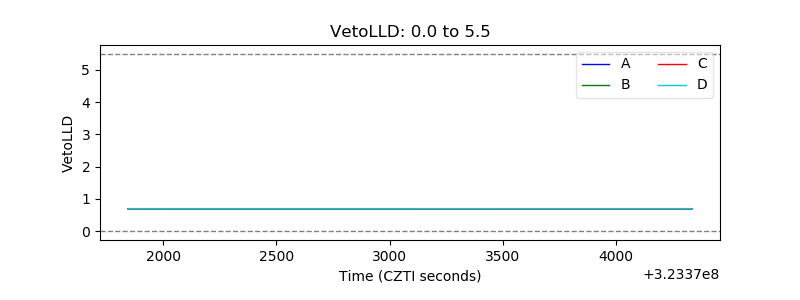 |
| Alpha Counter | 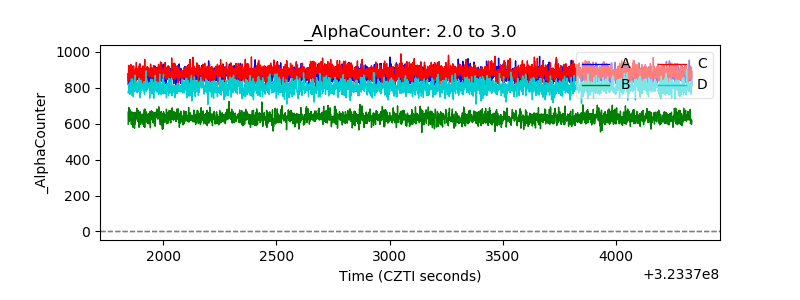 |
| _CPM_Rate |  |
| CZT Counter | 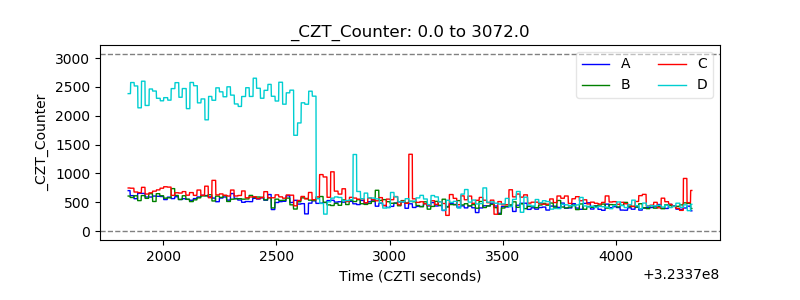 |
| +2.5 Volts monitor |  |
| +5 Volts monitor |  |
| _ROLL_ROT | 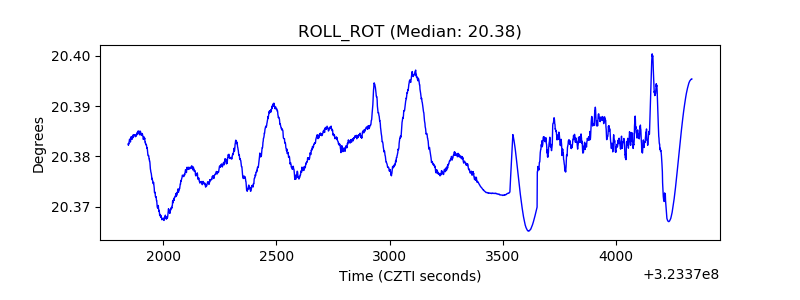 |
| _Roll_DEC | 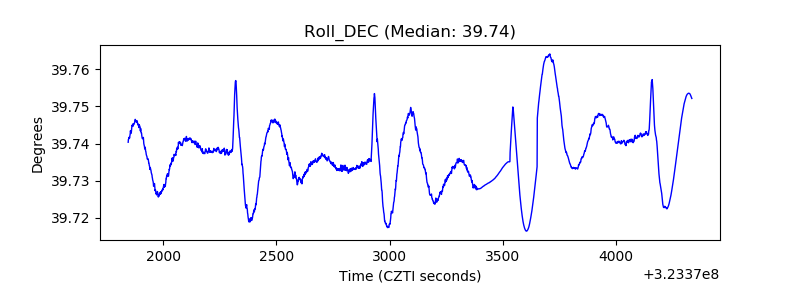 |
| _Roll_RA | 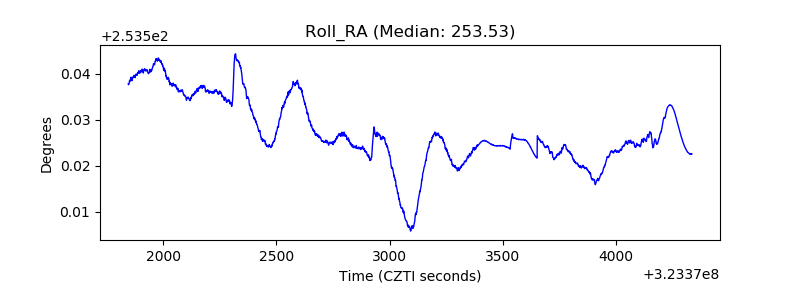 |
| Veto Counter | 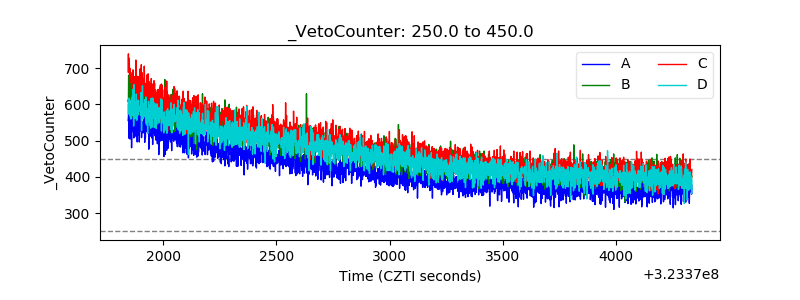 |