| Param | Original file | Final file |
|---|---|---|
| Filename | modeM0/AS1A08_008T01_9000003596_24377cztM0_level2.evt | modeM0/AS1A08_008T01_9000003596_24377cztM0_level2_quad_clean.evt |
| Size (bytes) | 480,139,200 | 92,401,920 |
| Size | 457.9 MB | 88.1 MB |
| Events in quadrant A | 3,226,406 | 588,242 |
| Events in quadrant B | 3,311,465 | 605,930 |
| Events in quadrant C | 4,255,173 | 574,104 |
| Events in quadrant D | 3,295,963 | 565,963 |
| Mode SS | |||
|---|---|---|---|
| Quadrant | BADHDUFLAG | Total packets | Discarded packets |
| A | 0 | 134 | 0 |
| B | 0 | 134 | 0 |
| C | 0 | 134 | 0 |
| D | 0 | 134 | 0 |
| Mode M0 | |||
|---|---|---|---|
| Quadrant | BADHDUFLAG | Total packets | Discarded packets |
| A | 0 | 13662 | 2 |
| B | 0 | 13795 | 2 |
| C | 0 | 16909 | 2 |
| D | 0 | 14047 | 2 |
| Mode M9 | |||
|---|---|---|---|
| Quadrant | BADHDUFLAG | Total packets | Discarded packets |
| A | 0 | 23 | 0 |
| B | 0 | 24 | 0 |
| C | 0 | 24 | 0 |
| D | 0 | 24 | 0 |
| Quadrant | Total seconds | Saturated seconds | Saturation percentage |
|---|---|---|---|
| A | 6660 | 47 | 0.705706% |
| B | 6660 | 51 | 0.765766% |
| C | 6660 | 155 | 2.327327% |
| D | 6660 | 52 | 0.780781% |
Noise dominated data is calculated using 1-second bins in cleaned event files. If a bin has >2000 counts, and if more than 50% of those come from <1% of pixels, then it is considered to be noise-dominated and hence unusable.
| Quadrant | # 1 sec bins | Bins with >0 counts | Bins with >2000 counts | High rate bins dominated by noise | Noise dominated (total time) | Noise dominated (detector-on time) | Marked lightcurve |
|---|---|---|---|---|---|---|---|
| A | 7840 | 6661 | 0 | 0 | 0.00% | 0.00% | 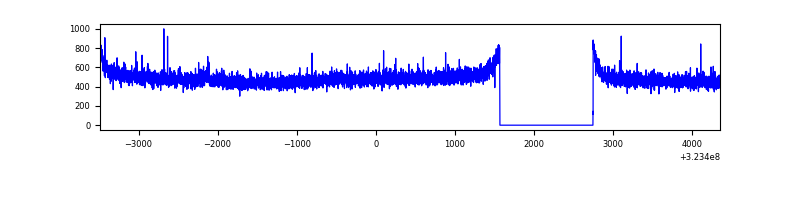 |
| B | 7840 | 6661 | 0 | 0 | 0.00% | 0.00% | 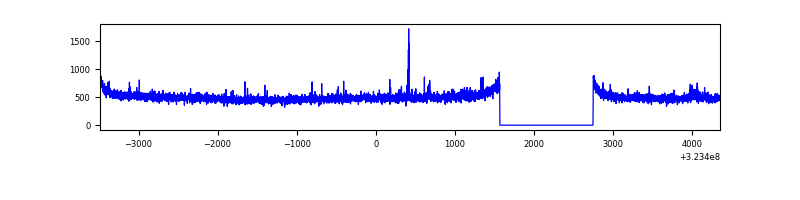 |
| C | 7840 | 6661 | 14 | 14 | 0.18% | 0.21% | 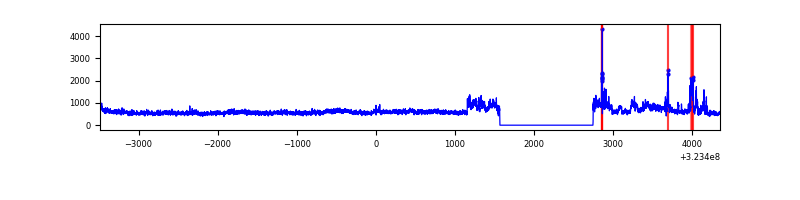 |
| D | 7840 | 6661 | 8 | 8 | 0.10% | 0.12% | 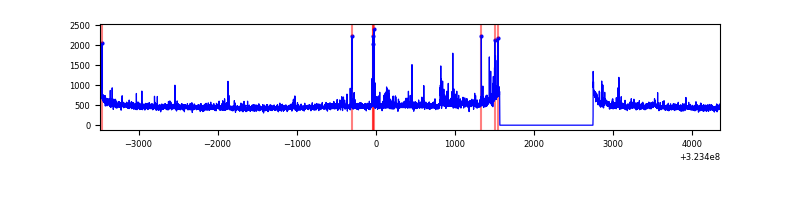 |
Top three noisy pixels from each quadrant. If the there are fewer than three noisy pixels in the level2.evt file, extra rows are filled as -1
| Pixel properties | Quadrant properties | ||||||
|---|---|---|---|---|---|---|---|
| Quadrant | DetID | PixID | Counts | Sigma | Mean | Median | Sigma |
| A | 13 | 254 | 10802 | 60.14 | 835 | 818 | 166.0 |
| A | 3 | 137 | 7080 | 37.72 | 835 | 818 | 166.0 |
| A | 0 | 226 | 6990 | 37.18 | 835 | 818 | 166.0 |
| B | 12 | 111 | 18514 | 113.79 | 839 | 820 | 155.5 |
| B | 11 | 111 | 16618 | 101.6 | 839 | 820 | 155.5 |
| B | 0 | 190 | 15916 | 97.09 | 839 | 820 | 155.5 |
| C | 7 | 247 | 496131 | 2696.11 | 808 | 814 | 183.7 |
| C | 2 | 16 | 470829 | 2558.38 | 808 | 814 | 183.7 |
| C | 14 | 238 | 132602 | 717.35 | 808 | 814 | 183.7 |
| D | 1 | 52 | 63633 | 319.58 | 816 | 793 | 196.6 |
| D | 12 | 233 | 52561 | 263.27 | 816 | 793 | 196.6 |
| D | 8 | 195 | 49839 | 249.43 | 816 | 793 | 196.6 |
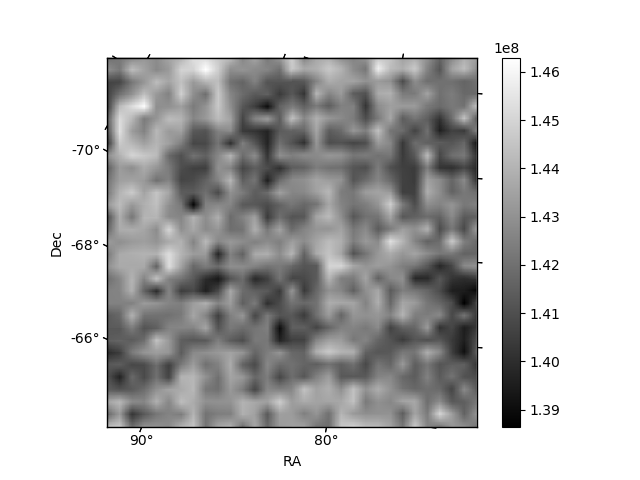
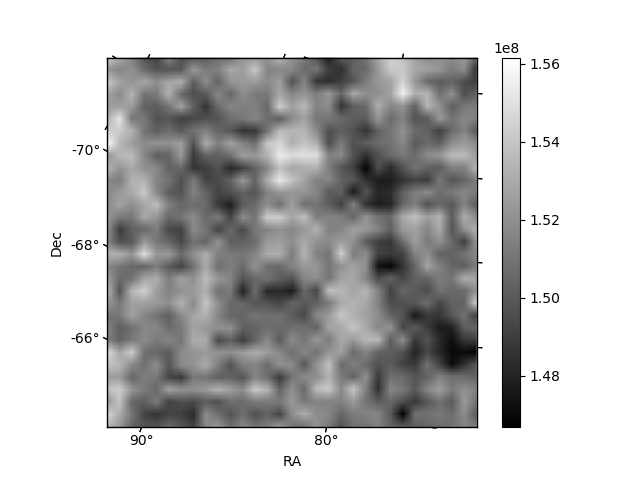
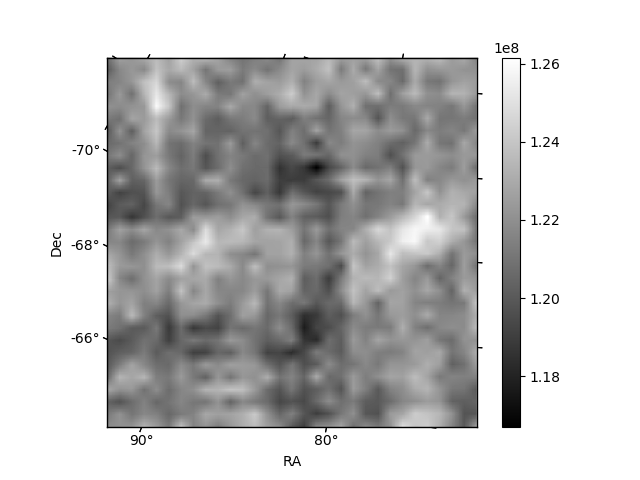
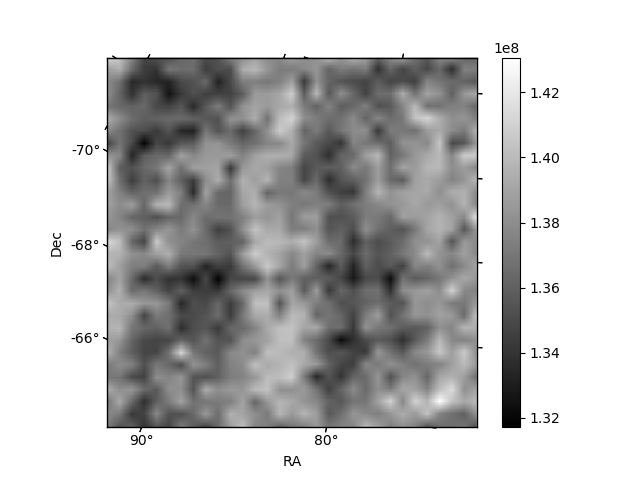
Histogram calculated using DETX and DETY for each event in the final _common_clean file
| Quadrant A | 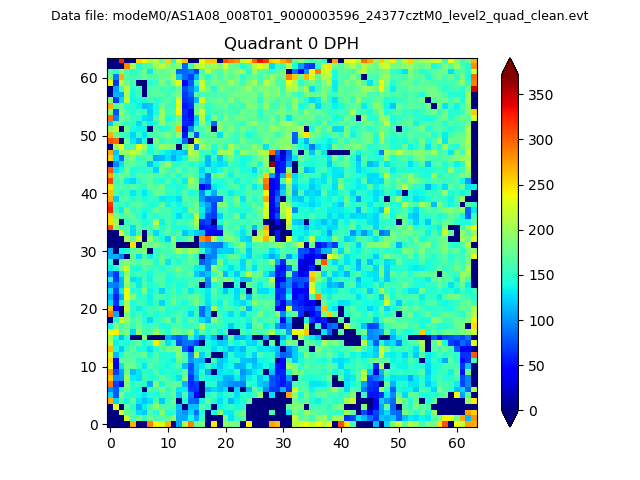 |
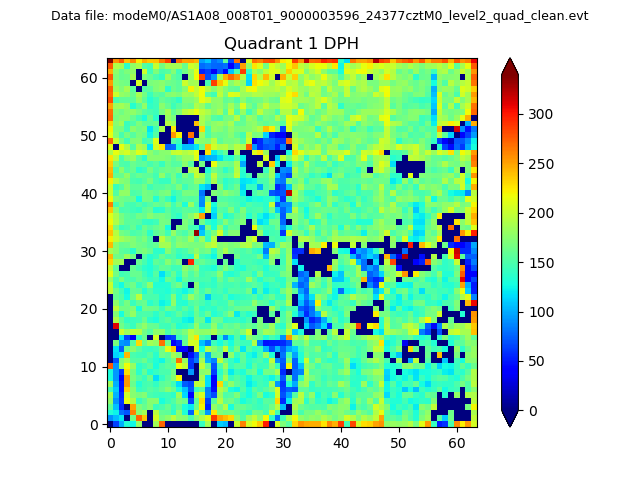 |
Quadrant B |
|---|---|---|---|
| Quadrant D |  |
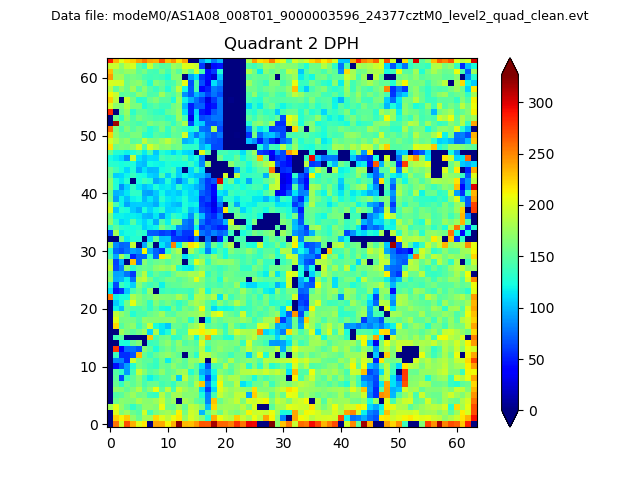 |
Quadrant C |
| Plot type | Count rate plots | Images |
|---|---|---|
| Comparison with Poisson distribution Blue bars denote a histogram of data divided into 1 sec bins. Red curve is a Poisson curve with rate = median count rate of data. |
 |
 |
| Quadrant-wise count rates Data is divided into 100 sec bins |
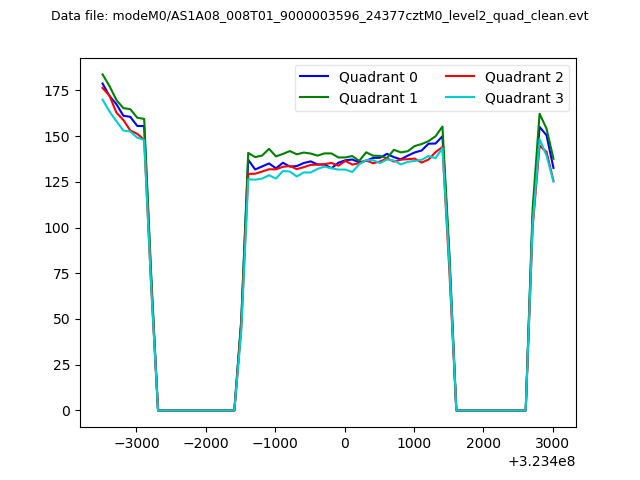 |
|
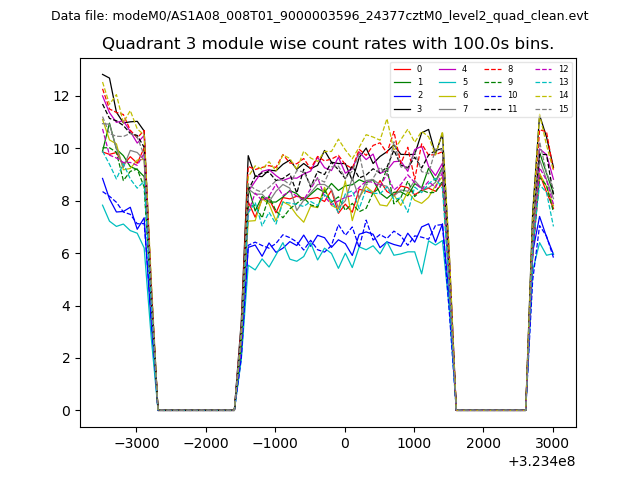
| Module-wise count rates for Quadrant A Data is divided into 100 sec bins |
 |
 |
| Module-wise count rates for Quadrant B Data is divided into 100 sec bins |
 |
 |
| Module-wise count rates for Quadrant C Data is divided into 100 sec bins |
 |
 |
| Module-wise count rates for Quadrant D Data is divided into 100 sec bins |
 |
 |
| Parameter | Plot |
|---|---|
| CZT HV Monitor |  |
| D_VDD | 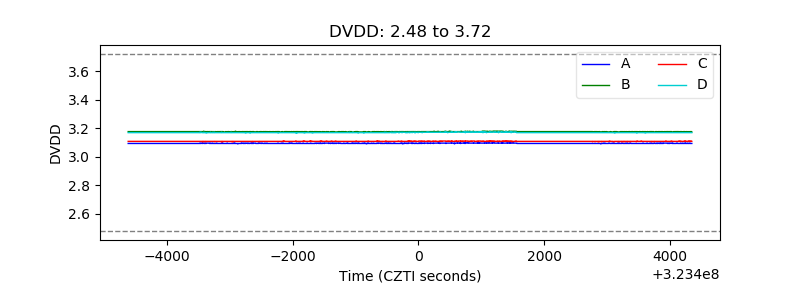 |
| Temperature 1 | 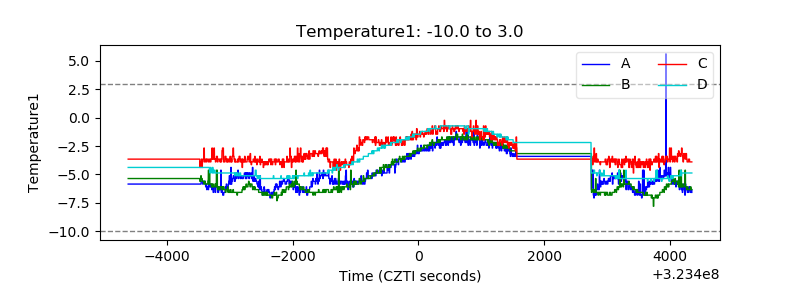 |
| Veto HV Monitor | 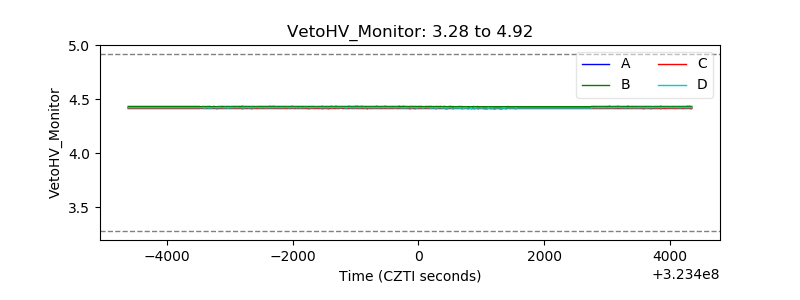 |
| Veto LLD | 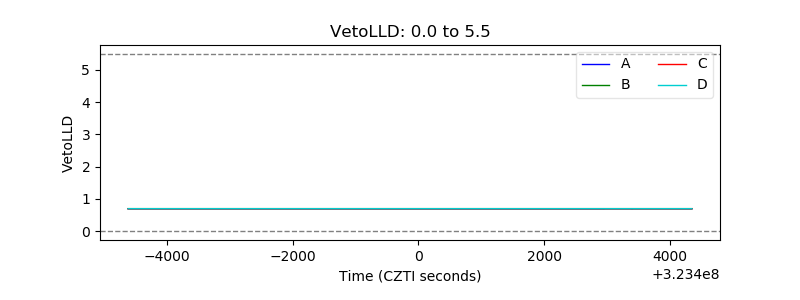 |
| Alpha Counter | 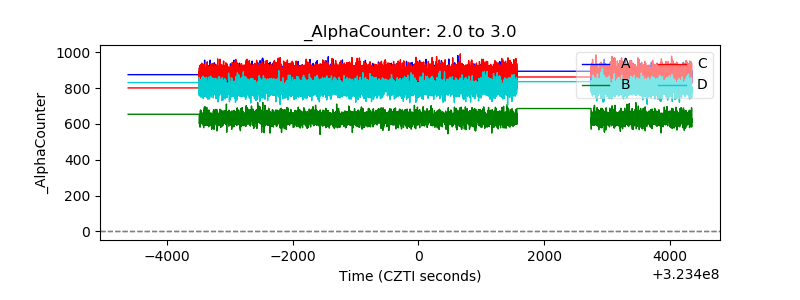 |
| _CPM_Rate | 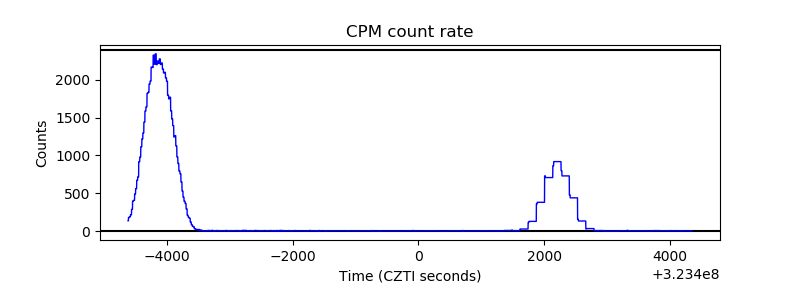 |
| CZT Counter | 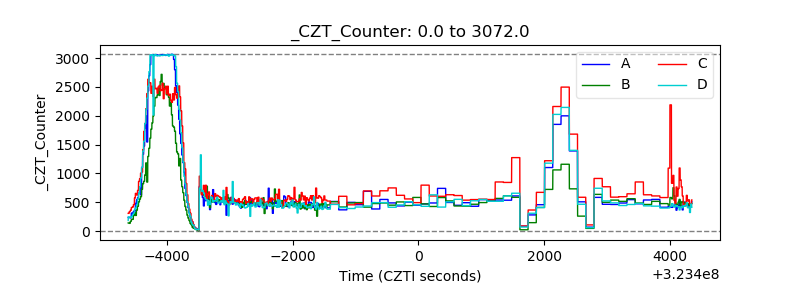 |
| +2.5 Volts monitor |  |
| +5 Volts monitor |  |
| _ROLL_ROT | 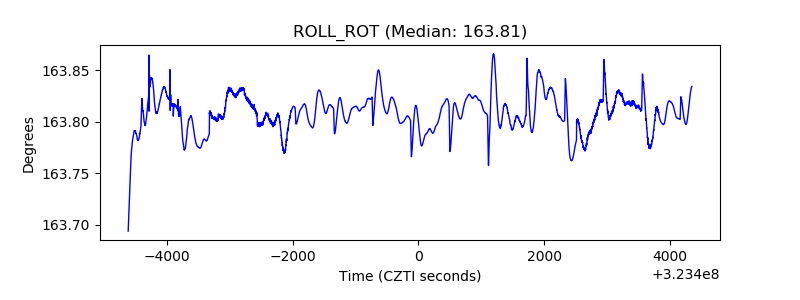 |
| _Roll_DEC | 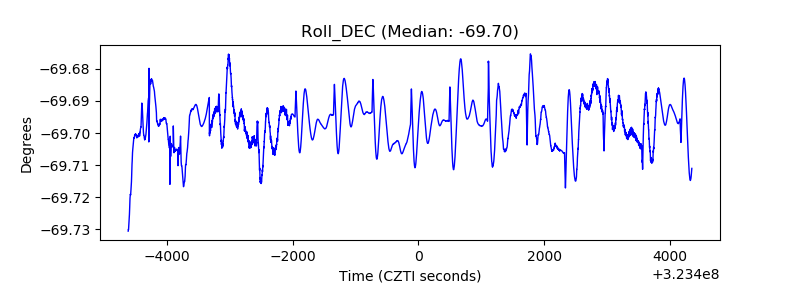 |
| _Roll_RA | 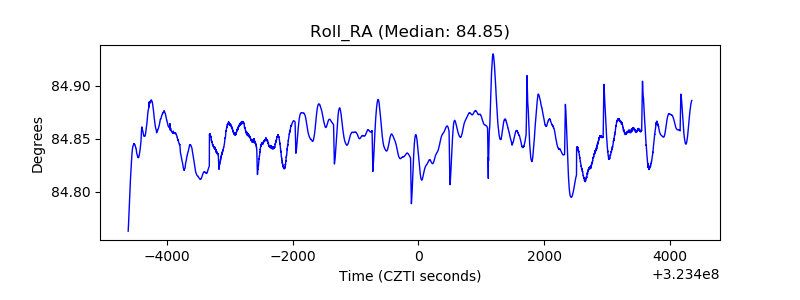 |
| Veto Counter |  |